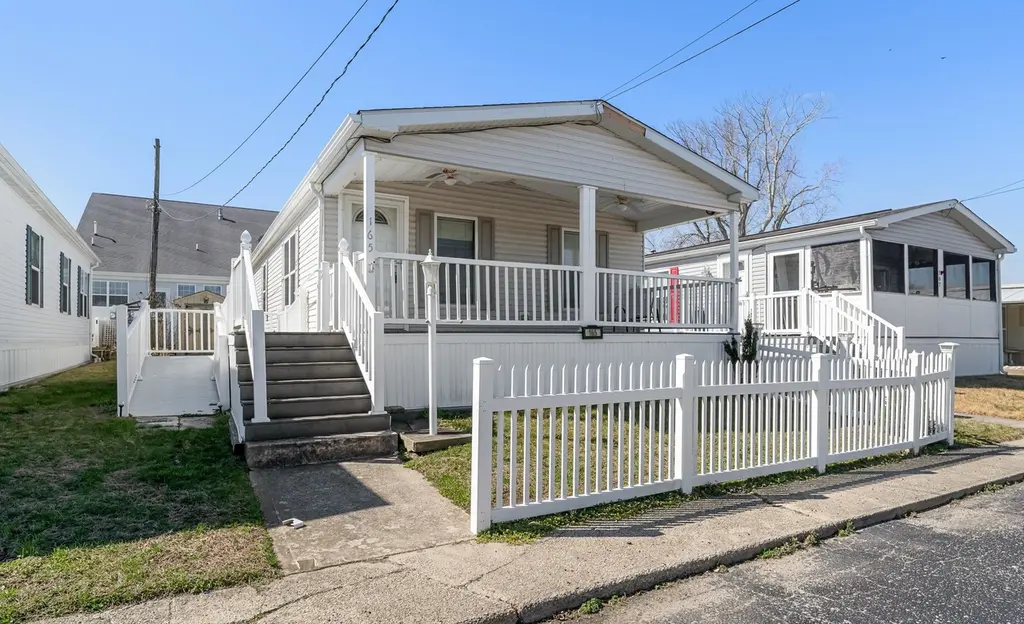
165 Maurice Blvd · Middle, NJ
Flood risk No data
- FEMA flood zone
- —
- Chance of flooding over 30 yrs
- —
- Est. flood insurance / yr
- —
Fire risk No data
- Est. fire insurance / yr
- —
Heat risk No data
- Hot days now (above threshold)
- —
- Hot days in 30 yrs
- —
Wind risk No data
- Chance of severe wind over 30 yrs
- —
Air-quality risk No data
- Unhealthy air days now
- —
- Unhealthy air days in 30 yrs
- —
Risk factors via First Street. Map © Google.
Why this score? — see what drove the D+ grade
The composite is a weighted blend of 9 inputs, each scored 0–100. Each bar is that input's sub-score; the figure is the points it added to the 100-point composite (weight × sub-score).
- ARV discount +15.0/15.0
- Appreciation +10.0/10.0
- Cash flow +8.2/30.0
- 1% rule +2.6/10.0
- Rent growth +2.5/5.0
- Livability +2.5/5.0
- Condition / age +2.5/5.0
- Schools +2.4/10.0
- DSCR +2.2/10.0
$170,000
🖨 Deal sheet (PDF) 📄 Offer letter ✓ Due diligence
Listing remarks
Welcome to easy living in the desirable Grande Woods South manufactured home community! This well-maintained 2 bedroom, 2 full bath, 20 x 56 (1,120 sq ft) home offers comfortable one-level living in a fantastic location close to the Wildwoods, Cape May, the bay, local shops, restaurants, wineries, and breweries. Inside, the home features a living room, kitchen, dining area, and a dedicated laundry room, creating a practical layout for everyday living or a relaxing shore getaway. The home also offers a charming covered front porch—perfect for enjoying your morning coffee or relaxing after a day at the shore. A convenient accessibility ramp provides easy entry, making the home ideal for
Key facts
- Built 2009
- Listed 94 days
Property features AI
Exterior
- Utilities: City sewer; Well water; Electric hot water
- Home design: Vinyl exterior; Offered for sale
- Exterior features: Deck; Porch; Fenced yard; Storage building; Cable TV available; Sidewalks
Interior
- Kitchen: Range; Oven; Microwave; Dishwasher; Natural gas stove
- Bedrooms: 2 bedrooms
- Flooring: Laminate flooring; Vinyl flooring
- Bathrooms: 2 full bathrooms
- Heating & cooling: Natural gas forced-air heating; Central air conditioning; Smoke/Fire detector
- Interior features: Storage; Curtains and blinds included; Living room; Dining room; Kitchen; Laundry/utility room; Total of 8 rooms
- Laundry & utility: Washer; Dryer; Laundry/utility room
Neighborhood map
What this means for you Summary
Snapshot
- This is a 2-bed/2.0-bath manufactured listed at $170k.
Deal economics
- At list price, monthly cash flow is $-160 ($-2k/yr) — negative.
- To cash-flow at today's rent, offer at most $147k (13.6% below list).
- To meet the 1% rule (rent ≥ 1% of price), the offer needs to be $129k (24.4% below list).
- Recommended offer: $129k (24.4% below list) — sets the bar for 1% rule.
Location & tenants
- Location reads: area grade D — affects rentability + tenant quality, not the cash-flow math above.
- Middle Township Public School District (suburban): math 15% / reading 38% proficiency, ranked #372 of 472 in NJ (top 79%) — low school quality limits family demand, transient renter base, plan for 1-2y turnover.
- Zoned schools: Middle Township Elementary #1 (657 students, 56% FRL); Middle Township Elementary #4 (math 14% / reading 47%, grade F, #303 of 431 statewide, top 72%, 594 students, 52% FRL); Middle Township High School (math 17% / reading 32%, grade F, #327 of 399 statewide, top 82%, 790 students, 36% FRL).
- Market conditions: 72 active listings in the ZIP; 877 units permitted in Cape May County in 2024 (35 in 5+ unit buildings).
Forward outlook
- In year one you build about $18k of equity ($1k loan paydown + $17k appreciation (10.0% local appreciation)).
- Cape May County population projected at -24% by 2050 — secular population decline; favor cash flow + early exit over multi-decade hold.
- By year 3, paydown + projected appreciation supports a ~$46k cash-out refi (75% LTV) — recoverable capital for the next deal without selling this one.
Negotiation context
- It's been on market 94 days — a 9% lower offer ($155k) is reasonable based on typical stale-listing flexibility.
- 2 sale attempts; this cycle's ask has dropped $10k (6%) from the opening price — seller is motivated, your offer sets the floor, not the list.
Questions for the listing agent
- What do current leases actually rent for vs. the listed asking? Can we see a recent rent roll and the last 12 months of T-12 income?
- It's been on market 94 days. Have you received any prior offers? Is the seller open to a 24% concession, seller financing, or rate buy-down credit?
- Why hasn't it sold? Are there any deal-killer items the seller is aware of (foundation, flood, title, zoning, code violations)?
- Is there a deadline driving the sale (1031 exchange, divorce, estate, relocation)? That informs how much negotiation room exists.
- The area grade is low — what's the realistic commute time and amenity access for the typical tenant pool here? Any planned neighborhood developments (good or bad) we should know about?
- What's the average days-on-market for RENTAL listings here right now (not sales)? A rising rental-DOM trend means longer vacancies and softer asking-rent achievability than the comps imply.
- What's the recent tenant-quality profile in this submarket — average credit score on applications, eviction rate, late-payment / NSF rate, and stable-employment percentage? A property-management company in the area should have these aggregated.
- How much new for-sale + rental construction is in the pipeline within 1–3 miles? Heavy new supply typically softens prices + rents 12–24 months out; constrained supply supports both.
Investment metrics
- 1% rule
- 0.76% ✗
- Cap rate
- 5.17%
- Cash-on-cash
- -4.02%
- DSCR
- 0.82
- GRM
- 11.0
CMA / ARV
- ARV (on-the-fly)
- $203,840
- Comps found
- 2
Show comp detail 2 sales within ~0.75 mi
| Address | Dist | Beds/Ba | Sqft | Sold | Price | $/sf | Match |
|---|---|---|---|---|---|---|---|
| 68 Priest Blvd | 0.05mi | 2/2.0 | 980 (-12%) | 2mo | $140,000 | $143 | 75 |
| 322 Grande Blvd | 0.14mi | 3/2.0 (+1) | 980 (-12%) | 20mo | $178,000 | $182 | 52 |
Match score weights: distance 35% · size 25% · config 20% · recency 20%. Top-matched comps best support the ARV.
Projected returns pro-forma
10.0% appreciation · 3.0% rent growth · sell at horizon
- IRR
- 21.4%
- Equity multiple
- 2.73×
- Total profit
- $82,442
- Equity at exit
- $153,149
- IRR
- 19.4%
- Equity multiple
- 6.27×
- Total profit
- $250,810
- Equity at exit
- $330,273
Cash invested: $47,600 (down + closing). Projections, not guarantees.
Landlord ↔ Tenant lean methodology
- Overall (STATE)
- 21 Tenant-Leaning
- State New Jersey
- 21 Tenant-Leaning · D+6
- County
- — inherits STATE
- City
- — inherits STATE
ZIP-level market 08242
- Home prices YoY
- 14.2%
- Active inventory
- 72
- Price-to-rent
- 11.0×
Monthly cashflow live
- Estimated rent
- $1,285 medium interval (Pro) →
- Mortgage (P&I)
- −$891
- Tax est. 1.5%
- −$212 /mo · $2,550/yr
- Insurance
- −$71
- HOA
- −$0
- Vacancy / Maint / Mgmt
- −$270
- Net cashflow
- $-160
Break-even live
Sensitivity live
| Price | -10% $-42 | -5% $-101 | +0% $-160 | +5% $-218 | +10% $-277 |
|---|---|---|---|---|---|
| Rent | -10% $-261 | -5% $-210 | +0% $-160 | +5% $-109 | +10% $-58 |
| Rate | -1.0pp $-74 | -0.5pp $-116 | base $-160 | +0.5pp $-204 | +1.0pp $-248 |
UW: 25.0% down · 7.5% · 30yr · 1.5% tax · 5.0% vac · 8.0% maint · 8.0% mgmt
Financing live
Cash to close
- Down payment
- $42,500
- Closing costs
- $5,100
- Reserves months
- —
- Total cash needed
- —
Loan-product check · same deal, 3 products live
Conventional
25% down · 7.5% · 30yr
- Down + closing
- —
- Monthly P&I
- —
- Monthly cashflow
- —
- DSCR
- —
- Eligible?
- —
Personal DTI + credit; lowest rate.
DSCR
20% down · 8.5% · 30yr
- Down + closing
- —
- Monthly P&I
- —
- Monthly cashflow
- —
- DSCR
- —
- Eligible?
- —
No personal income docs; deal must DSCR.
Hard money
10% down · 12.0% · 12mo
- Down + closing
- —
- Monthly P&I
- —
- Monthly cashflow
- —
- DSCR
- —
- Eligible?
- —
Short-term bridge; refi at stabilization.
Listing history 18 events
-
2026-06-21days on market $170,000 Active 94 DOM
-
2026-06-21days on market $170,000 Active 93 DOM
-
2026-06-18days on market $170,000 Active 91 DOM
-
2026-06-17days on market $170,000 Active 90 DOM
-
2026-06-16days on market $170,000 Active 89 DOM
-
2026-06-15days on market $170,000 Active 88 DOM
-
2026-06-13days on market $170,000 Active 86 DOM
-
2026-06-12days on market $170,000 Active 85 DOM
-
2026-06-09days on market $170,000 Active 82 DOM
-
2026-06-08days on market $170,000 Active 81 DOM
-
2026-06-07days on market $170,000 Active 80 DOM
-
2026-06-07days on market $170,000 Active 79 DOM
-
2026-06-04days on market $170,000 Active 76 DOM
-
2026-06-02pricedays on market $170,000 Active 75 DOM
-
2026-06-01days on market $180,000 Active 74 DOM
-
2026-05-31days on market $180,000 Active 73 DOM
-
2026-03-19$180,000 Active
-
2026-03-16$180,000
ⓘ Source: listings_history table (triggers on properties + properties_extension) + one-shot
backfill from property_details.listing_events for pre-trigger history.
Nearby sold comps map
Loading sold comps map…
Walkable amenities ~0.75 mi
Loading nearby amenities…
Taxation est. · year 1
- Rental income
- $15,422
- − Mortgage interest
- −$9,523
- − Property taxes
- −$2,550
- − Insurance
- −$850
- − Repairs & maintenance
- −$1,234
- − Management
- −$1,234
- − Depreciation
- −$4,945
- Taxable loss
- −$4,914
- Est. tax savings @ 24.0%
- +$1,179
- After-tax cash flow
- $-736/yr
For passive investors: Depreciation is non-cash, so a rental often shows a tax loss while cash-flowing — sheltering income. Rental losses are passive: they offset passive income freely, and up to $25,000/yr can offset ordinary (W-2) income if you actively participate and your MAGI is under $100k (phasing out to $0 by $150k); unused losses carry forward. On sale, claimed depreciation is recaptured at up to 25%, and gains may owe capital-gains tax (a 1031 exchange can defer both). Figures are a year-1 estimate at your 24.0% rate — not tax advice; consult a CPA.
Schools (NCES district)
- District
- Middle Township Public School District
- NCES district ID
- 3410020
- Math proficiency
- 15% ▼ -18.00%
- Reading proficiency
- 38% ▼ -7.00%
- Median HH income
- $59,228
- Composite
- 24.09/100
- National rank
- #7754
- State rank
- #372 of 472 in NJ
Livability — Middle
No livability data for this city. (Only ~50 U.S. cities are tracked.)
Census & demographics
- Census place
- Rio Grande, NJ
- Population (ZIP)
- 4,021
Population outlook (Cape May County) Hauer SSP2
- Today (2025)
- 88,234 people
- By 2030
- 84,144 · -4.6%
- By 2040
- 75,146 · -14.8%
- By 2050
- 67,389 · -23.6%
- By 2075
- 55,732 · -36.8%
- By 2100
- 44,972 · -49.0%
Race, ethnicity, and origin ACS 2023
- Neighborhood character
- Predominantly White (69%)
- Race & ethnicity
- White 69% Hispanic / Latino 17% Two or more races 11% Black 7%
- Hispanic origin (detail)
- Mexican 5% Puerto Rican 10%
- Common ancestry
- Romanian 4% Slovak 2% Lithuanian 1%
- Foreign-born
- 6% · Canada
- Languages at home
- 85% English-only · Spanish 11% Russian/Polish/Slavic 2% Arabic 1%
Political lean MEDSL · Cape May
- 2024 margin
- R (+19.2) · D 39.7% · R 58.9% · Other 1.4%
- 2008→2024 swing
- -10.6pp toward R · 2008: -8.7pp · 2024: -19.2pp
- All cycles
- 2024: R+19.2 2020: R+15.9 2016: R+19.9 2012: R+8.9 2008: R+8.7
Not yet ingested
- Civics
- —
Market trends
- HPI YoY
- ▲ 51.53%
- Current HPI
- 414.7401
- Rent YoY
- —
- Metro
- —
- State GDP YoY
- ▲ 2.05%
- F500 in state
- 34
Industry mix (Fortune 500 HQ in NJ)
| Industry | F500 HQs | Revenue |
|---|---|---|
| Consumer Goods | 3 | $31B |
|
||
| Pharmaceuticals | 2 | $153B |
|
||
| Technology | 2 | $21B |
|
||
| Insurance | 2 | $20B |
|
||
| Healthcare | 2 | $19B |
|
||
| Financial Services | 1 | $70B |
|
||
Price history
+0.0% since first listed2 events — show timeline
- 2026-03-19 Listed $180,000 CMCMLS
- 2026-03-16 Listed $180,000 CMCMLS
Cash-flow waterfall
monthlySold comps — $/sqft
last 12 mo · ≤1 miLoading sold comps…