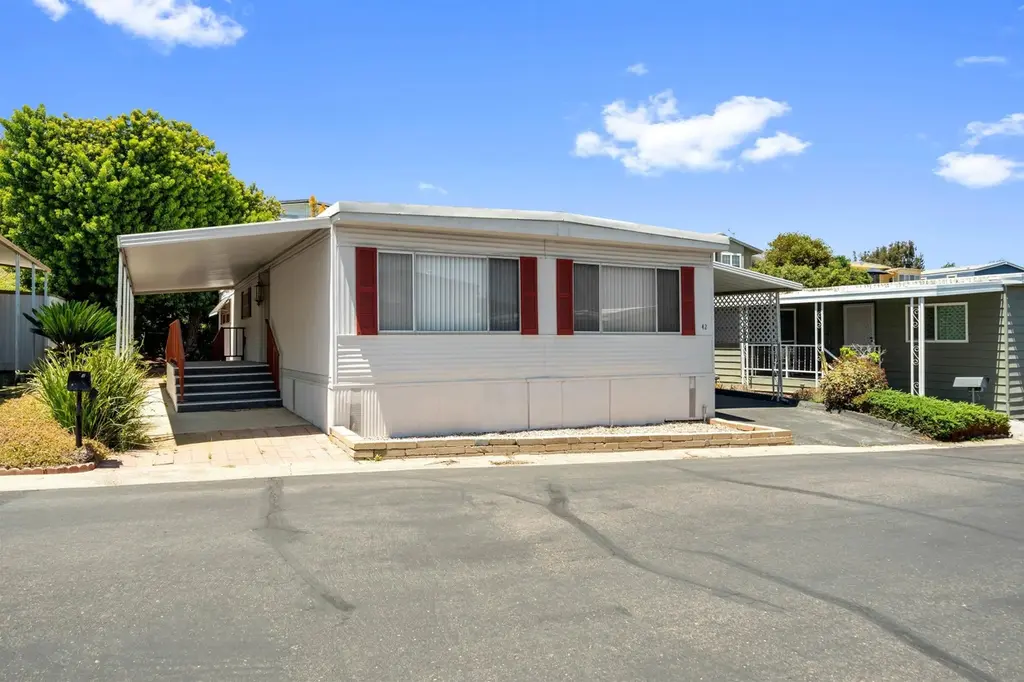
444 N El Camino Real Real Spc 42 · Encinitas, CA
Flood risk 1/10 · Minimal
- FEMA flood zone
- X (unshaded)
- Chance of flooding over 30 yrs
- 0.0%
- Est. flood insurance / yr
- $507 – $1,088
Fire risk 3/10 · Minor
- Est. fire insurance / yr
- $659 – $1,223
Heat risk 4/10 · Minor
- Hot days now (above 87°F)
- 7 days/yr
- Hot days in 30 yrs
- 20 days/yr
Wind risk 1/10 · Minimal
- Chance of severe wind over 30 yrs
- —
Air-quality risk 3/10 · Minor
- Unhealthy air days now
- 4 days/yr
- Unhealthy air days in 30 yrs
- 4 days/yr
Risk factors via First Street. Map © Google.
Why this score? — see what drove the C+ grade
The composite is a weighted blend of 9 inputs, each scored 0–100. Each bar is that input's sub-score; the figure is the points it added to the 100-point composite (weight × sub-score).
- Cash flow +25.1/30.0
- DSCR +8.2/10.0
- ARV discount +7.9/15.0
- Schools +7.1/10.0
- 1% rule +6.2/10.0
- Livability +4.0/5.0
- Rent growth +3.8/5.0
- Condition / age +2.5/5.0
- Appreciation +0.0/10.0
$429,000
🖨 Deal sheet 📄 Offer letter ✓ Due diligence
Listing remarks
Located in the highly desirable land-owned Park Encinitas. This community is truly a gem not to be missed. Large 3 bed 2 full-bath, well maintained home. Large open floor plan with tons of natural light. New Electrical panel, Two large outdoor locking storage units, Refrigerator, laundry washer/dryer included. Move-in ready Senior 55+. Where else can you own a private lot in this idyllic beach town for $450,000. Don't let this opportunity get away.
Key facts
- Private lot
- 2 parking spots
- Community pool
Tags
Property features AI
Finance
- Other: Pet policy includes breed restrictions
- HOA & community: Homeowners association with monthly fee of $275; HOA fee includes water; Community amenities: clubhouse, picnic area, pool, trash; Senior community (Park Encinitas)
Exterior
- Parking: 2 parking spaces
- Utilities: Sewer: Unknown
- Home design: Single-story mobile home; Residential property
- Construction: Composition roof
- Exterior features: Community pool; Shed(s)
Interior
- Kitchen: Dishwasher; Range; Oven; Range hood; Refrigerator
- Bedrooms: Up to 3 bedrooms possible
- Flooring: Linoleum; Vinyl
- Bathrooms: 2 full bathrooms
- Heating & cooling: Forced air heating (natural gas); Central air conditioning
- Interior features: Dishwasher; Dryer; Refrigerator; Washer; Range; Oven; Range hood
- Laundry & utility: Washer; Dryer
Neighborhood map
What this means for you Summary
Snapshot
- This is a 3-bed/2.0-bath manufactured listed at $429k.
Deal economics
- At list price, monthly cash flow is $946 ($11k/yr) — positive.
- The deal already cash-flows at list — no discount required.
- Meets the 1% rule at list price ($5k rent vs $429k).
- Cap rate 8.9% vs local median 1.6% in Encinitas — top-decile yield for the area; either an underpriced asset or a hidden risk that comps aren't pricing in. Stress-test before assuming the spread holds.
Location & tenants
- Location reads 79/100 on livability (#54 in CA, #2,026 nationally) — a middle-class / working-renter tenant base. Strengths: schools A+, amenities A+, commute A+; Watch: health & safety C-, cost of living F.
- San Dieguito Union High (urban): math 72% / reading 79% proficiency, ranked #56 of 1,400 in CA (top 4%) — strong family-tenant draw, lease renewals of 3-5y typical; only 8% free/reduced lunch — higher-income household profile.
- Market conditions: Rents rising fast (+5.4%/yr); 205 active listings in the ZIP; 20 comparable units currently listed for rent nearby; rentals leasing fast (median 2d on market — plan ~1-2 weeks tenant-placement turnaround); high-income renter base; 11,759 units permitted in San Diego County in 2024 (7,244 in 5+ unit buildings).
- This rent runs 36% of the median local income ($159k/yr) — at the standard rent-burdened threshold; future hikes will face affordability resistance.
Forward outlook
- Local home prices are declining (-3.0%/yr); year-one equity from $3k of loan paydown is wiped out by about $13k of value loss. Plan a longer hold.
- San Diego County population projected at +20% by 2050 — long-run rental-demand tailwind backs the buy-and-hold thesis.
- At projected returns (-3.0% appreciation + 5.4% rent growth), your $120k cash investment doubles in ~9 years — after that, you're playing with house money.
Negotiation context
- Only 9 days on market — expect competitive offers; lowballing is unlikely to land.
- 2 sale attempts with the ask held roughly flat each time — persistent listings suggest the price (not the market) is what's stuck; bring a comps-based counter.
- Current owner paid $65k; list at $429k implies a 560% gain — meaningful room to come down on a strong offer.
Questions for the listing agent
- Built in 1971 — when were the roof, HVAC, electrical panel, plumbing, and water heater last replaced?
- What does the HOA fee cover, when was the last increase, and are there any pending special assessments or reserve-fund shortfalls?
- Is there a deadline driving the sale (1031 exchange, divorce, estate, relocation)? That informs how much negotiation room exists.
- Schools are A-rated — typically a magnet for longer-tenancy family renters. What's the average tenant stay here, and is there a school-zone premium baked into asking?
- What's the average days-on-market for RENTAL listings here right now (not sales)? A rising rental-DOM trend means longer vacancies and softer asking-rent achievability than the comps imply.
- What's the recent tenant-quality profile in this submarket — average credit score on applications, eviction rate, late-payment / NSF rate, and stable-employment percentage? A property-management company in the area should have these aggregated.
- How much new for-sale + rental construction is in the pipeline within 1–3 miles? Heavy new supply typically softens prices + rents 12–24 months out; constrained supply supports both.
Investment metrics
- 1% rule
- 1.12% ✓
- Cap rate
- 8.94%
- Cash-on-cash
- 9.45%
- DSCR
- 1.42
- GRM
- 7.4
CMA / ARV
- ARV (on-the-fly)
- $432,768
- Comps found
- 12
Show comp detail 12 sales within ~0.75 mi
| Address | Dist | Beds/Ba | Sqft | Sold | Price | $/sf | Match |
|---|---|---|---|---|---|---|---|
| 444 N El Camino Real #47 | 0.00mi | 2/2.0 (-1) | 1,328 (-1%) | 2mo | $438,500 | $330 | 91 |
| 444 N El Camino Real #119 | 0.00mi | 2/2.0 (-1) | 1,368 (+2%) | 3mo | $650,000 | $475 | 89 |
| 444 N El Camino Real Real Spc 48 | 0.00mi | 3/2.0 | 1,440 (+7%) | 1mo | $665,000 | $462 | 87 |
| 444 El Camino Real N #96 | 0.00mi | 2/2.0 (-1) | 1,368 (+2%) | 7mo | $440,000 | $322 | 86 |
| 444 N El Camino Real Real #26 | 0.00mi | 2/2.0 (-1) | 1,344 (0%) | 14mo | $430,000 | $320 | 84 |
| 444 El Camino Real #2 | 0.00mi | 3/2.0 | 1,512 (+12%) | 1mo | $729,000 | $482 | 78 |
| 350 N El Camino Real Real #50 | 0.13mi | 2/2.0 (-1) | 1,440 (+7%) | 1mo | $228,000 | $158 | 76 |
| 444 N El Camino Real #49 | 0.00mi | 2/2.0 (-1) | 1,400 (+4%) | 18mo | $469,900 | $336 | 73 |
| 350 N El Camino Real Real #18 | 0.13mi | 2/2.0 (-1) | 1,250 (-7%) | 11mo | $180,000 | $144 | 68 |
| 350 N El Camino Real Real Spc 19 | 0.13mi | 2/2.0 (-1) | 1,440 (+7%) | 12mo | $280,000 | $194 | 67 |
| 350 N El Camino Real #22 | 0.13mi | 2/2.0 (-1) | 1,440 (+7%) | 19mo | $191,000 | $133 | 61 |
| 350 N El Camino Real #12 | 0.13mi | 3/3.0 | 1,440 (+7%) | 21mo | $189,000 | $131 | 61 |
Match score weights: distance 35% · size 25% · config 20% · recency 20%. Top-matched comps best support the ARV.
Projected returns pro-forma
-3.0% appreciation · 5.39% rent growth · sell at horizon
- IRR
- 0.5%
- Equity multiple
- 1.02×
- Total profit
- $2,582
- Equity at exit
- $63,965
- IRR
- 12.4%
- Equity multiple
- 2.09×
- Total profit
- $130,875
- Equity at exit
- $37,092
Cash invested: $120,120 (down + closing). Projections, not guarantees.
Landlord ↔ Tenant lean methodology
- Overall (STATE)
- 18 Strongly Tenant-Friendly
- State California
- 18 Strongly Tenant-Friendly · D+13
- County
- — inherits STATE
- City
- — inherits STATE
ZIP-level market 92024
- Rents YoY
- 5.4%
- Active inventory
- 205
- Price-to-rent
- 7.4×
Monthly cashflow live
- Estimated rent
- $4,809 high interval (Pro) →
- Mortgage (P&I)
- −$2,250
- Tax from tax record
- −$150 /mo · $1,795/yr
- Insurance
- −$179
- HOA
- −$275
- Vacancy / Maint / Mgmt
- −$1,010
- Net cashflow
- $946
Break-even live
UW: 25.0% down · 7.5% · 30yr · 1.5% tax · 5.0% vac · 8.0% maint · 8.0% mgmt
Financing live
Cash to close
- Down payment
- $107,250
- Closing costs
- $12,870
- Reserves months
- —
- Total cash needed
- —
Loan-product check · same deal, 3 products live
Conventional
25% down · 7.5% · 30yr
- Down + closing
- —
- Monthly P&I
- —
- Monthly cashflow
- —
- DSCR
- —
- Eligible?
- —
Personal DTI + credit; lowest rate.
DSCR
20% down · 8.5% · 30yr
- Down + closing
- —
- Monthly P&I
- —
- Monthly cashflow
- —
- DSCR
- —
- Eligible?
- —
No personal income docs; deal must DSCR.
Hard money
10% down · 12.0% · 12mo
- Down + closing
- —
- Monthly P&I
- —
- Monthly cashflow
- —
- DSCR
- —
- Eligible?
- —
Short-term bridge; refi at stabilization.
Rent comps 20 comps
| Address | Beds | Baths | Sqft | Rent | $/sqft | DOM | Units | Dist |
|---|---|---|---|---|---|---|---|---|
| 1320 Via Terrassa Encinitas, CA | 1.0–3.0 | 1.0–2.0 | 1002 | $4,427 | $4.42 | 1d | 21 | 0.62mi |
| 1647 Tennis Match Way Encinitas, CA | 3.0 | 2.5 | 1783 | $6,000 | $3.37 | 12d | 1 | 0.69mi |
| 155 Rosebay Dr #45 Encinitas, CA | 2.0 | 1.0 | 925 | $3,000 | $3.24 | 1d | 1 | 0.70mi |
| 1190 Encinitas Blvd Encinitas, CA | 1.0–2.0 | 1.0–2.0 | 799 | $3,100 | $3.88 | 1d | 4 | 0.72mi |
| 117 Rosebay Dr Encinitas, CA | 2.0 | 2.0 | 1000 | $2,900 | $2.90 | 1d | 3 | 0.78mi |
| 820 Encinitas Blvd #202 Encinitas, CA | 2.0 | 1.0 | 1060 | $3,000 | $2.83 | 19d | 1 | 0.81mi |
| 924 Encinitas Blvd Encinitas, CA | 1.0–2.0 | 1.0–2.0 | 800 | $2,945 | $3.68 | 1d | 3 | 0.84mi |
| 760 Encinitas Blvd #103 Encinitas, CA | 2.0 | 1.5 | 1092 | $3,600 | $3.30 | 1d | 1 | 0.85mi |
| 141 Turner Ave Encinitas, CA | 4.0 | 2.0 | 1830 | $6,500 | $3.55 | 1d | 1 | 0.89mi |
| 141 Turner Ave Encinitas, CA | 4.0 | 2.0 | 1830 | $6,500 | $3.55 | 3d | 1 | 0.89mi |
| 1953 Skyknoll Way Encinitas, CA | 3.0 | 3.0 | 1492 | $4,500 | $3.02 | 3d | 1 | 1.03mi |
| 606 Camino De Orchidia Encinitas, CA | 2.0 | 2.5 | 1139 | $9,000 | $7.90 | 1d | 1 | 1.07mi |
| 1101 Catania Ct Unit 202 Encinitas, CA | 2.0 | 2.0 | 1057 | $5,400 | $5.11 | 11d | 1 | 1.08mi |
| 1101 Catania Ct Unit 104 Encinitas, CA | 2.0 | 2.0 | 940 | $5,250 | $5.59 | 1d | 1 | 1.08mi |
| 1103 Catania Ct Unit 104 Encinitas, CA | 2.0 | 2.0 | 940 | $5,500 | $5.85 | 1d | 1 | 1.09mi |
| 211 Chapalita Dr Unit 1048659P Encinitas, CA | 3.0 | 2.0 | 1313 | $7,461 | $5.68 | 11d | 1 | 1.17mi |
| 668 Westlake St Encinitas, CA | 2.0 | 2.5 | 1379 | $4,850 | $3.52 | 1d | 1 | 1.26mi |
| 2033 Red Coach Ln Encinitas, CA | 3.0 | 2.0 | 1014 | $5,250 | $5.18 | 17d | 1 | 1.30mi |
| 608 Silver Berry Pl Encinitas, CA | 3.0 | 2.5 | 1268 | $5,500 | $4.34 | 7d | 1 | 1.34mi |
| 283 Mangano Cir Unit 283 Encinitas, CA | 2.0 | 2.0 | 900 | $3,300 | $3.67 | 4d | 1 | 1.39mi |
HOA detail
- Monthly dues
- $275 · $3,300/yr
- Likely covers
- electric
Listing history 12 events
-
2026-06-18days on market $429,000 Active 9 DOM
-
2026-06-17days on market $429,000 Active 8 DOM
-
2026-06-16days on market $429,000 Active 7 DOM
-
2026-06-15days on market $429,000 Active 6 DOM
-
2026-06-13days on market $429,000 Active 4 DOM
-
2026-06-13days on market $429,000 Active 3 DOM
-
2026-06-10days on market $429,000 Active 1 DOM
-
2026-01-20$429,000 Active
-
2026-01-15historical
-
2025-11-06price $429,000
-
2025-08-03$450,000 Active
-
1998-03-19soldstatus $65,000
ⓘ Source: listings_history table (triggers on properties + properties_extension) + one-shot
backfill from property_details.listing_events for pre-trigger history.
Tax reassessment forecast CA · Resets to sale price
- Current annual tax
- $1,795 · $150/mo
- Projected year-2 tax
- $3,260 · $272/mo
- Expected delta
- +$1,466/yr (+$122/mo · 81.7%)
ⓘ Screening estimate from a state-policy table — verify with the county assessor before closing.
Climate risk First Street
- Flood 1/10 Low FEMA zone X (unshaded) · 0% chance over 30 yrs
- Wildfire 3/10 Moderate
- Heat 4/10 Moderate 7 d/yr ≥87°F today · 20 d/yr by 30 yrs out
- Wind 1/10 Low
- Air quality 3/10 Moderate 4 unhealthy d/yr today · 4 by 30 yrs out
Nearby sold comps map
Loading sold comps map…
Walkable amenities ~0.75 mi
Loading nearby amenities…
Taxation est. · year 1
- Rental income
- $57,708
- − Mortgage interest
- −$24,031
- − Property taxes
- −$1,795
- − Insurance
- −$2,145
- − Repairs & maintenance
- −$4,617
- − Management
- −$4,617
- − HOA
- −$3,300
- − Depreciation
- −$12,480
- Taxable income
- $4,724
- Est. tax owed @ 24.0%
- −$1,134
- After-tax cash flow
- $10,219/yr
For passive investors: Depreciation is non-cash, so a rental often shows a tax loss while cash-flowing — sheltering income. Rental losses are passive: they offset passive income freely, and up to $25,000/yr can offset ordinary (W-2) income if you actively participate and your MAGI is under $100k (phasing out to $0 by $150k); unused losses carry forward. On sale, claimed depreciation is recaptured at up to 25%, and gains may owe capital-gains tax (a 1031 exchange can defer both). Figures are a year-1 estimate at your 24.0% rate — not tax advice; consult a CPA.
Schools (NCES district)
- District
- San Dieguito Union High
- NCES district ID
- 0634380
- Math proficiency
- 72% ▬ 0.00%
- Reading proficiency
- 79% ▼ -1.00%
- Median HH income
- $110,199
- Composite
- 70.63/100
- National rank
- #519
- State rank
- #56 of 1400 in CA
Livability — Encinitas
- Score
- 79/100
- State rank
- #54
- US rank
- #2026
Category grades
Schools grade is shown separately in the Schools card above.
Census & demographics
- Census place
- Encinitas, CA
- County
- San Diego County · 3,178,799 people
- City population
- 61,717
- Metro
- San Diego-Chula Vista-Carlsbad, CA
- Population (ZIP)
- 50,617
- Household income
- $158,507
- Rent vs Own
- Severe rent burden
- 1537.0
Population outlook (San Diego County) Hauer SSP2
- Today (2025)
- 3,678,185 people
- By 2030
- 3,856,546 · +4.8%
- By 2040
- 4,171,407 · +13.4%
- By 2050
- 4,421,607 · +20.2%
- By 2075
- 4,831,599 · +31.4%
- By 2100
- 4,832,502 · +31.4%
Race, ethnicity, and origin ACS 2023
- Neighborhood character
- Predominantly White (75%)
- Race & ethnicity
- White 75% Hispanic / Latino 14% Two or more races 11% Asian 5%
- Hispanic origin (detail)
- Mexican 10%
- Common ancestry
- Italian 4% Romanian 3% Slovak 3%
- Foreign-born
- 12% · Canada, China
- Languages at home
- 84% English-only · Spanish 9% Other Indo-European 2% German/W. Germanic 1%
Political lean MEDSL · San Diego
- 2024 margin
- D (+16.8) · D 56.9% · R 40.1% · Other 2.9%
- 2008→2024 swing
- +6.6pp toward D · 2008: 10.2pp · 2024: 16.8pp
- All cycles
- 2024: D+16.8 2020: D+22.8 2016: D+17.8 2012: D+5.1 2008: D+10.2
Not yet ingested
- Civics
- —
Market trends
- HPI YoY
- ▼ -881.14%
- Current HPI
- 461.5044
- Rent YoY
- ▲ 5.39%
- Metro
- San Diego-Chula Vista-Carlsbad, CA
- State GDP YoY
- ▲ 3.21%
- F500 in state
- 116
Industry mix (Fortune 500 HQ in CA)
| Industry | F500 HQs | Revenue |
|---|---|---|
| Technology | 27 | $1,492B |
|
||
| Financial Services | 3 | $174B |
|
||
| Retail | 3 | $44B |
|
||
| Insurance | 3 | $26B |
|
||
| Media / Entertainment | 2 | $115B |
|
||
| Pharmaceuticals / Biotech | 2 | $62B |
|
||
Price history
+560.0% since first listed5 events — show timeline
- 2026-01-20 Listed $429,000 SDMLS
- 2026-01-15 Listing Removed — SDMLS
- 2025-11-06 Price Changed $429,000 SDMLS
- 2025-08-03 Listed $450,000 SDMLS
- 1998-03-19 Sold (Public Records) $65,000 Public Records
Property tax history
+2.8%/yrLatest (2025): $1,795 · +6.1% YoY. Source: county tax records.
Cash-flow waterfall
monthlySold comps — $/sqft
last 12 mo · ≤1 miLoading sold comps…