 Multi-family
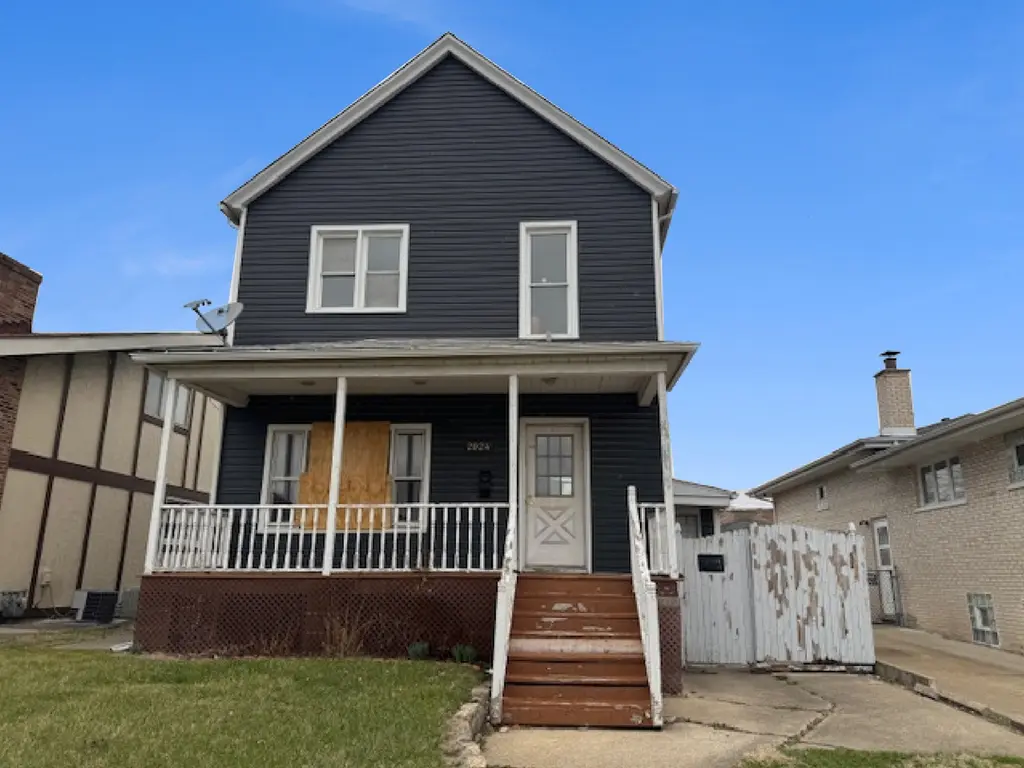
2024 Union St · Blue Island, IL
Flood risk 1/10 · Minimal
- FEMA flood zone
- X (unshaded)
- Chance of flooding over 30 yrs
- 0.0%
- Est. flood insurance / yr
- $473 – $860
Fire risk 1/10 · Minimal
- Est. fire insurance / yr
- $804 – $1,492
Heat risk 3/10 · Minor
- Hot days now (above 101°F)
- 7 days/yr
- Hot days in 30 yrs
- 15 days/yr
Wind risk 2/10 · Minimal
- Chance of severe wind over 30 yrs
- —
Air-quality risk 4/10 · Minor
- Unhealthy air days now
- 4 days/yr
- Unhealthy air days in 30 yrs
- 6 days/yr
Risk factors via First Street. Map © Google.
Why this score? — see what drove the B- grade
The composite is a weighted blend of 9 inputs, each scored 0–100. Each bar is that input's sub-score; the figure is the points it added to the 100-point composite (weight × sub-score).
- Cash flow +30.0/30.0
- 1% rule +10.0/10.0
- DSCR +10.0/10.0
- ARV discount +7.5/15.0
- Livability +3.9/5.0
- Rent growth +2.5/5.0
- Condition / age +2.5/5.0
- Schools +1.6/10.0
- Appreciation +0.0/10.0
$114,950
🖨 Deal sheet 📄 Offer letter ✓ Due diligence
Multi-family units
County records classify this as Multi-Family (2-4 Unit). Listing-text estimate: 1 unit. estimate disagrees with records
Listing remarks MLS
This spacious 2-story home with a charming front porch on a nice size lot. The main level features a sprawling living room and flexible bonus rooms perfect for a home office or additional bedrooms. 2nd floor has additional bedroom and living space. Property also features a full basement and a 2-car garage. Ready for a full rehab to unlock its maximum equity! Seller will not complete any repairs to the subject property, either lender or buyer requested. The property is sold in AS IS condition!
Key facts
- Charming front porch
- In-law arrangement
- Full basement
Tags
Neighborhood map
What this means for you Summary
Snapshot
- This is a 4-bed/2.0-bath multifamily listed at $115k.
Deal economics
- At list price, monthly cash flow is $707 ($8k/yr) — positive.
- The deal already cash-flows at list — no discount required.
- Meets the 1% rule at list price ($2k rent vs $115k).
- Recommended offer: $108k (6.0% below list) — sets the bar for market timing.
- Cap rate 13.7% vs local median 6.5% in Blue Island — top-decile yield for the area; either an underpriced asset or a hidden risk that comps aren't pricing in. Stress-test before assuming the spread holds.
Location & tenants
- Location reads 77/100 on livability (#159 in IL, #2,964 nationally) — a middle-class / working-renter tenant base. Strengths: commute A+, cost of living A+, housing A+; Watch: employment C-, schools F, crime F.
- Chsd 218 (suburban): math 14% / reading 20% proficiency, ranked #454 of 620 in IL (top 73%) — low school quality limits family demand, transient renter base, plan for 1-2y turnover.
- Market conditions: 43 active listings in the ZIP; 6 comparable units currently listed for rent nearby; rentals at typical pace (median 16d on market — plan ~3-4 weeks tenant-placement turnaround); 6,272 units permitted in Cook County in 2024 (4,658 in 5+ unit buildings).
Forward outlook
- Local home prices are declining (-3.0%/yr); year-one equity from $794 of loan paydown is wiped out by about $3k of value loss. Plan a longer hold.
- At projected returns (-3.0% appreciation + 3.0% rent growth), your $32k cash investment doubles in ~5 years — after that, you're playing with house money.
Negotiation context
- It's been on market 84 days — a 6% lower offer ($108k) is reasonable based on typical stale-listing flexibility.
- 2 sale attempts since 2y ago; this cycle's ask has dropped $25k (18%) from the opening price — seller is motivated, your offer sets the floor, not the list.
Risks & watch-outs
- Watch-outs: property tax is 4.1% of price; built in 1893 — expect roof / HVAC / electrical / plumbing capex.
Questions for the listing agent
- It's been on market 84 days. Have you received any prior offers? Is the seller open to a 6% concession, seller financing, or rate buy-down credit?
- Built in 1893 — when were the roof, HVAC, electrical panel, plumbing, and water heater last replaced?
- Property tax is high relative to price — has the assessment been appealed recently, and will the sale trigger a re-assessment?
- Why hasn't it sold? Are there any deal-killer items the seller is aware of (foundation, flood, title, zoning, code violations)?
- Is there a deadline driving the sale (1031 exchange, divorce, estate, relocation)? That informs how much negotiation room exists.
- Schools are F-rated, which usually means shorter tenancies and higher turnover. Who's the typical renter profile here, and what's been the actual vacancy rate?
- Crime grade is F in this area — have there been break-ins, vandalism, or insurance claims at this property in the last 3 years? What carrier currently insures it and at what premium?
- What's the average days-on-market for RENTAL listings here right now (not sales)? A rising rental-DOM trend means longer vacancies and softer asking-rent achievability than the comps imply.
- What's the recent tenant-quality profile in this submarket — average credit score on applications, eviction rate, late-payment / NSF rate, and stable-employment percentage? A property-management company in the area should have these aggregated.
- How much new apartment / multifamily construction is in the pipeline within 1–3 miles? Heavy new supply (>2% of stock underway) typically softens rents 12–24 months out; light construction supports rent growth.
Investment metrics
- 1% rule
- 1.93% ✓
- Cap rate
- 13.68%
- Cash-on-cash
- 26.38%
- DSCR
- 2.17
- GRM
- 4.3
CMA / ARV
- ARV (median comp)
- $241,025
- List price
- $114,950
- Delta
- -52.31%
- Verdict
- UNDERPRICED
- Comps
- 20 within 1.0 mi
Projected returns pro-forma
-3.0% appreciation · 3.0% rent growth · sell at horizon
- IRR
- 20.3%
- Equity multiple
- 1.83×
- Total profit
- $26,619
- Equity at exit
- $17,139
- IRR
- 28.6%
- Equity multiple
- 3.55×
- Total profit
- $81,963
- Equity at exit
- $9,939
Cash invested: $32,186 (down + closing). Projections, not guarantees.
Landlord ↔ Tenant lean methodology
- Overall (STATE)
- 43 Moderately Tenant-Leaning
- State Illinois
- 43 Moderately Tenant-Leaning · D+7
- County
- — inherits STATE
- City
- — inherits STATE
ZIP-level market 60406
- Home prices YoY
- -26.8%
- Active inventory
- 43
- Price-to-rent
- 4.3×
Monthly cashflow live
- Estimated rent
- $2,220 high interval (Pro) →
- Mortgage (P&I)
- −$603
- Tax from tax record
- −$396 /mo · $4,749/yr
- Insurance
- −$48
- HOA
- −$0
- Vacancy / Maint / Mgmt
- −$466
- Net cashflow
- $707
Break-even live
UW: 25.0% down · 7.5% · 30yr · 1.5% tax · 5.0% vac · 8.0% maint · 8.0% mgmt
Financing live
Cash to close
- Down payment
- $28,738
- Closing costs
- $3,448
- Reserves months
- —
- Total cash needed
- —
Loan-product check · same deal, 3 products live
Conventional
25% down · 7.5% · 30yr
- Down + closing
- —
- Monthly P&I
- —
- Monthly cashflow
- —
- DSCR
- —
- Eligible?
- —
Personal DTI + credit; lowest rate.
DSCR
20% down · 8.5% · 30yr
- Down + closing
- —
- Monthly P&I
- —
- Monthly cashflow
- —
- DSCR
- —
- Eligible?
- —
No personal income docs; deal must DSCR.
Hard money
10% down · 12.0% · 12mo
- Down + closing
- —
- Monthly P&I
- —
- Monthly cashflow
- —
- DSCR
- —
- Eligible?
- —
Short-term bridge; refi at stabilization.
Rent comps 6 comps
| Address | Beds | Baths | Sqft | Rent | $/sqft | DOM | Units | Dist |
|---|---|---|---|---|---|---|---|---|
| 13308 Old Western Ave Unit 2 Blue Island, IL | 3.0 | 1.5 | 1350 | $2,200 | $1.63 | 11d | 1 | 0.73mi |
| 13308 Old Western Ave Unit 2 Blue Island, IL | 3.0 | 1.5 | 1350 | $2,200 | $1.63 | 22d | 1 | 0.73mi |
| 2640 Vermont St Unit 1 Blue Island, IL | 3.0 | 1.5 | 1500 | $2,200 | $1.47 | 1d | 1 | 0.78mi |
| 2336 122nd St Unit 2 Blue Island, IL | 3.0 | 1.0 | 1340 | $1,900 | $1.42 | 20d | 1 | 0.98mi |
| 2261 136th St Blue Island, IL | 4.0 | 2.0 | 2230 | $2,500 | $1.12 | 16d | 1 | 1.03mi |
| 12111 S Justine St Chicago, IL | 3.0 | 1.5 | 1800 | $2,400 | $1.33 | 15d | 1 | 1.19mi |
Listing history 21 events
-
2026-06-18days on market $114,950 Active 84 DOM
-
2026-06-17days on market $114,950 Active 83 DOM
-
2026-06-16days on market $114,950 Active 82 DOM
-
2026-06-15days on market $114,950 Active 81 DOM
-
2026-06-13days on market $114,950 Active 79 DOM
-
2026-06-09days on market $114,950 Active 75 DOM
-
2026-06-08days on market $114,950 Active 74 DOM
-
2026-06-07days on market $114,950 Active 73 DOM
-
2026-06-04days on market $114,950 Active 70 DOM
-
2026-06-03days on market $114,950 Active 69 DOM
-
2026-06-02days on market $114,950 Active 68 DOM
-
2026-06-01days on market $114,950 Active 67 DOM
-
2026-05-31days on market $114,950 Active 66 DOM
-
2026-04-24price $124,950 497-char remark
Show marketing remark (497 chars)
This spacious 2-story home with a charming front porch on a nice size lot. The main level features a sprawling living room and flexible bonus rooms perfect for a home office or additional bedrooms. 2nd floor has additional bedroom and living space. Property also features a full basement and a 2-car garage. Ready for a full rehab to unlock its maximum equity! Seller will not complete any repairs to the subject property, either lender or buyer requested. The property is sold in AS IS condition!
-
2026-03-25$139,950 Active 497-char remark
Show marketing remark (497 chars)
This spacious 2-story home with a charming front porch on a nice size lot. The main level features a sprawling living room and flexible bonus rooms perfect for a home office or additional bedrooms. 2nd floor has additional bedroom and living space. Property also features a full basement and a 2-car garage. Ready for a full rehab to unlock its maximum equity! Seller will not complete any repairs to the subject property, either lender or buyer requested. The property is sold in AS IS condition!
-
2024-05-03historical
-
2024-04-26Active
-
2004-01-20soldstatus $145,000
-
1996-05-03soldstatus $115,000
-
1987-05-01soldstatus $49,000
-
1980-11-26soldstatus $45,000
ⓘ Source: listings_history table (triggers on properties + properties_extension) + one-shot
backfill from property_details.listing_events for pre-trigger history.
Tax reassessment forecast IL · Partial reset (capped growth)
- Current annual tax
- $4,749 · $396/mo
- Projected year-2 tax
- $4,749 · $396/mo
- Expected delta
- $0/yr ($0/mo · 0.0%)
ⓘ Screening estimate from a state-policy table — verify with the county assessor before closing.
Climate risk First Street
- Flood 1/10 Low FEMA zone X (unshaded) · 0% chance over 30 yrs
- Wildfire 1/10 Low
- Heat 3/10 Moderate 7 d/yr ≥101°F today · 15 d/yr by 30 yrs out
- Wind 2/10 Low
- Air quality 4/10 Moderate 4 unhealthy d/yr today · 6 by 30 yrs out
Nearby sold comps map
Loading sold comps map…
Walkable amenities ~0.75 mi
Loading nearby amenities…
Taxation est. · year 1
- Rental income
- $26,641
- − Mortgage interest
- −$6,439
- − Property taxes
- −$4,749
- − Insurance
- −$575
- − Repairs & maintenance
- −$2,131
- − Management
- −$2,131
- − Depreciation
- −$3,344
- Taxable income
- $7,272
- Est. tax owed @ 24.0%
- −$1,745
- After-tax cash flow
- $6,744/yr
For passive investors: Depreciation is non-cash, so a rental often shows a tax loss while cash-flowing — sheltering income. Rental losses are passive: they offset passive income freely, and up to $25,000/yr can offset ordinary (W-2) income if you actively participate and your MAGI is under $100k (phasing out to $0 by $150k); unused losses carry forward. On sale, claimed depreciation is recaptured at up to 25%, and gains may owe capital-gains tax (a 1031 exchange can defer both). Figures are a year-1 estimate at your 24.0% rate — not tax advice; consult a CPA.
Schools (NCES district)
- District
- Chsd 218
- NCES district ID
- 1706540
- Math proficiency
- 14% ▼ -4.00%
- Reading proficiency
- 20% ▼ -1.00%
- Median HH income
- $57,166
- Composite
- 16.09/100
- National rank
- #9235
- State rank
- #454 of 620 in IL
Livability — Blue Island
- Score
- 77/100
- State rank
- #159
- US rank
- #2964
Category grades
Schools grade is shown separately in the Schools card above.
Census & demographics
- Census place
- Blue Island, IL
- City population
- 24,887
- Population (ZIP)
- 24,887
Population outlook (Cook County) Hauer SSP2
- Today (2025)
- 5,347,519 people
- By 2030
- 5,357,703 · +0.2%
- By 2040
- 5,324,924 · -0.4%
- By 2050
- 5,230,762 · -2.2%
- By 2075
- 4,785,735 · -10.5%
- By 2100
- 4,188,836 · -21.7%
Race, ethnicity, and origin ACS 2023
- Neighborhood character
- Diverse neighborhood (Simpson 0.65)
- Race & ethnicity
- Hispanic / Latino 44% Black 34% White 19% Two or more races 8%
- Hispanic origin (detail)
- Mexican 39%
- Common ancestry
- Romanian 2% English 1% Iranian 1%
- Foreign-born
- 19% · Canada
- Languages at home
- 65% English-only · Spanish 33% Other Indo-European 1%
Political lean MEDSL · Cook
- 2024 margin
- Solid D (+42.0) · D 70.4% · R 28.4% · Other 1.2%
- 2008→2024 swing
- -11.4pp toward R · 2008: 53.4pp · 2024: 42.0pp
- All cycles
- 2024: D+42.0 2020: D+50.3 2016: D+53.0 2012: D+49.4 2008: D+53.4
Not yet ingested
- Civics
- —
Market trends
- HPI YoY
- ▼ -94.77%
- Current HPI
- 259.492
- Rent YoY
- —
- Metro
- —
- State GDP YoY
- ▲ 1.59%
- F500 in state
- 60
Industry mix (Fortune 500 HQ in IL)
| Industry | F500 HQs | Revenue |
|---|---|---|
| Insurance | 4 | $201B |
|
||
| Consumer Goods | 4 | $87B |
|
||
| Industrial Machinery | 3 | $64B |
|
||
| Healthcare | 2 | $55B |
|
||
| Retail / Pharmacy | 1 | $148B |
|
||
| Agriculture / Food | 1 | $86B |
|
||
Price history
+177.7% since first listed8 events — show timeline
- 2026-04-24 Price Changed $124,950 MRED as Distributed by MLS Grid
- 2026-03-25 Listed $139,950 MRED as Distributed by MLS Grid
- 2024-05-03 Listing Removed — MRED as Distributed by MLS Grid
- 2024-04-26 Listed — MRED as Distributed by MLS Grid
- 2004-01-20 Sold (Public Records) $145,000 Public Records
- 1996-05-03 Sold (Public Records) $115,000 Public Records
- 1987-05-01 Sold (Public Records) $49,000 Public Records
- 1980-11-26 Sold (Public Records) $45,000 Public Records
Property tax history
+0.6%/yrLatest (2023): $4,749 · +2.6% YoY. Source: county tax records.
Cash-flow waterfall
monthlySold comps — $/sqft
last 12 mo · ≤1 miLoading sold comps…