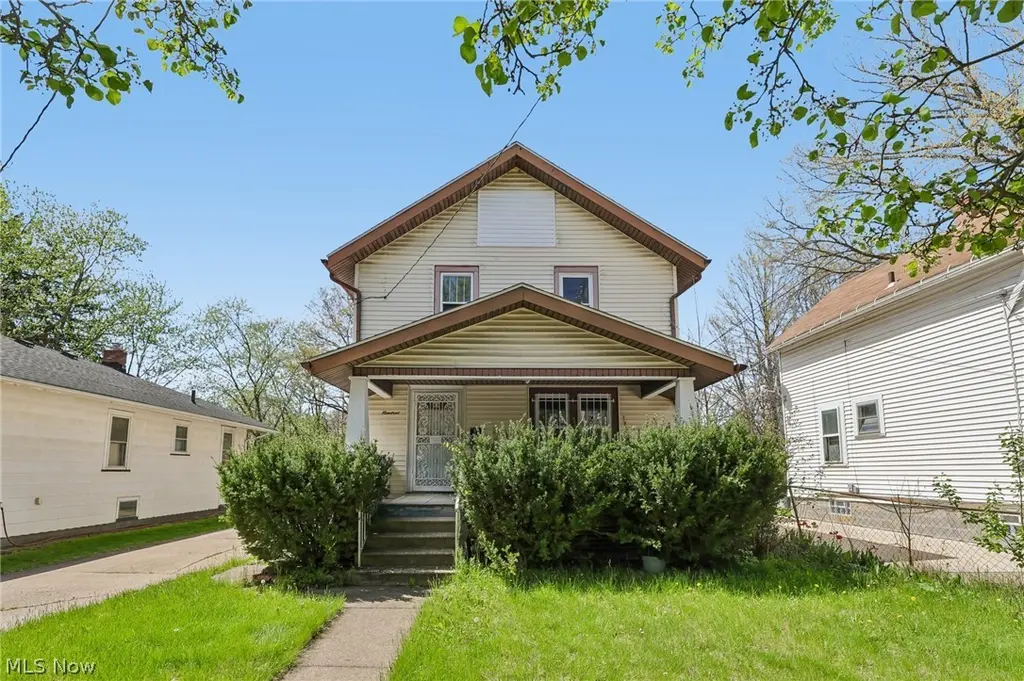
600 Grace Ave · Akron, OH
Flood risk 1/10 · Minimal
- FEMA flood zone
- X (unshaded)
- Chance of flooding over 30 yrs
- 0.0%
- Est. flood insurance / yr
- $473 – $860
Fire risk 1/10 · Minimal
- Est. fire insurance / yr
- $713 – $1,323
Heat risk 3/10 · Minor
- Hot days now (above 97°F)
- 7 days/yr
- Hot days in 30 yrs
- 17 days/yr
Wind risk 1/10 · Minimal
- Chance of severe wind over 30 yrs
- —
Air-quality risk 2/10 · Minimal
- Unhealthy air days now
- 1 days/yr
- Unhealthy air days in 30 yrs
- 2 days/yr
Risk factors via First Street. Map © Google.
Why this score? — see what drove the C grade
The composite is a weighted blend of 9 inputs, each scored 0–100. Each bar is that input's sub-score; the figure is the points it added to the 100-point composite (weight × sub-score).
- Cash flow +29.0/30.0
- DSCR +10.0/10.0
- 1% rule +7.4/10.0
- Livability +4.0/5.0
- Rent growth +2.9/5.0
- Condition / age +2.5/5.0
- Schools +2.1/10.0
- ARV discount +0.0/15.0
- Appreciation +0.0/10.0
$110,000
🖨 Deal sheet 📄 Offer letter ✓ Due diligence
Listing remarks
Fantastic opportunity for homeowners and investors alike! This solid Akron home at 600 Grace Ave offers a functional layout with character throughout. Features include three bedrooms, a detached garage, and a level backyard. The interior has been well cared for, providing a great canvas for your personal touches. Conveniently located near shopping, dining, and public transit. Schedule your private showing today and see the potential for yourself!
Key facts
- 8,729 sq ft lot
- Parking
- Built 1927
Property features AI
Exterior
- Parking: Driveway parking
- Utilities: Public water; Public sewer
- Home design: 2-story home; Above-grade finished area approximately 1,096
- Construction: Block construction; Shingle roof
- Exterior features: Driveway
Interior
- Bedrooms: 1 main-level bedroom
- Bathrooms: 1 full bathroom; 1 half bathroom; 1 main-level bathroom
- Heating & cooling: Central air conditioning; Forced-air gas heating
- Interior features: Partial basement
Neighborhood map
What this means for you Summary
Snapshot
- This is a 4-bed/1.5-bath single-family listed at $110k.
Deal economics
- At list price, monthly cash flow is $375 ($4k/yr) — positive.
- The deal already cash-flows at list — no discount required.
- Meets the 1% rule at list price ($1k rent vs $110k).
- Recommended offer: $107k (3.0% below list) — sets the bar for market timing.
- Cap rate 10.4% vs local median 6.6% in Akron — top-decile yield for the area; either an underpriced asset or a hidden risk that comps aren't pricing in. Stress-test before assuming the spread holds.
Location & tenants
- Location reads 81/100 on livability (#104 in OH, #1,591 nationally) — a professional / high-income tenant draw. Strengths: amenities A+, commute A+, cost of living A+; Watch: crime F, employment F.
- Akron City (urban): math 22% / reading 30% proficiency, ranked #602 of 656 in OH (top 92%) — low school quality limits family demand, transient renter base, plan for 1-2y turnover; 66% free/reduced lunch — lower-income household profile, screen leases tightly.
- Market conditions: Rents rising (+1.6%/yr); 102 active listings in the ZIP; 38 comparable units currently listed for rent nearby; rentals lingering (median 44d on market — plan ~5-8 weeks vacancy on turnover, expect pricing pressure); 58% of comp listings sitting > 30 days — soft ceiling on asking rent; lower-income renter base — watch delinquency; 1,114 units permitted in Summit County in 2024 (397 in 5+ unit buildings).
- This rent runs 40% of the median local income ($41k/yr) — at the standard rent-burdened threshold; future hikes will face affordability resistance.
Forward outlook
- Local home prices are declining (-3.0%/yr); year-one equity from $761 of loan paydown is wiped out by about $3k of value loss. Plan a longer hold.
- Summit County population projected to shrink 6% by 2050 — rents likely to lag national; underwrite the cash flow, not the appreciation.
- At projected returns (-3.0% appreciation + 1.6% rent growth), your $31k cash investment doubles in ~10 years — after that, you're playing with house money.
Negotiation context
- It's been on market 46 days — a 3% lower offer ($107k) is reasonable based on typical stale-listing flexibility.
Risks & watch-outs
- Watch-outs: built in 1927 — expect roof / HVAC / electrical / plumbing capex.
Questions for the listing agent
- It's been on market 46 days. Have you received any prior offers? Is the seller open to a 3% concession, seller financing, or rate buy-down credit?
- Built in 1927 — when were the roof, HVAC, electrical panel, plumbing, and water heater last replaced?
- Is there a deadline driving the sale (1031 exchange, divorce, estate, relocation)? That informs how much negotiation room exists.
- Crime grade is F in this area — have there been break-ins, vandalism, or insurance claims at this property in the last 3 years? What carrier currently insures it and at what premium?
- What's the average days-on-market for RENTAL listings here right now (not sales)? A rising rental-DOM trend means longer vacancies and softer asking-rent achievability than the comps imply.
- What's the recent tenant-quality profile in this submarket — average credit score on applications, eviction rate, late-payment / NSF rate, and stable-employment percentage? A property-management company in the area should have these aggregated.
- How much new for-sale + rental construction is in the pipeline within 1–3 miles? Heavy new supply typically softens prices + rents 12–24 months out; constrained supply supports both.
Investment metrics
- 1% rule
- 1.24% ✓
- Cap rate
- 10.38%
- Cash-on-cash
- 14.60%
- DSCR
- 1.65
- GRM
- 6.7
CMA / ARV
- ARV (median comp)
- $81,637
- List price
- $110,000
- Delta
- 34.74%
- Verdict
- OVERPRICED
- Comps
- 20 within 1.0 mi
Show comp detail 12 sales within ~0.75 mi
| Address | Dist | Beds/Ba | Sqft | Sold | Price | $/sf | Match |
|---|---|---|---|---|---|---|---|
| 923 Lawton St | 0.17mi | 3/1.0 (-1) | 1,008 (-8%) | 8mo | $78,000 | $77 | 65 |
| 1037 Hardesty Blvd | 0.62mi | 3/1.0 (-1) | 1,109 (+1%) | 1mo | $98,000 | $88 | 61 |
| 404 Noah Ave | 0.36mi | 3/1.0 (-1) | 1,192 (+9%) | 1mo | $77,500 | $65 | 60 |
| 912 Peckham St | 0.40mi | 3/1.0 (-1) | 1,044 (-5%) | 11mo | $115,000 | $110 | 57 |
| 379 Noble Ave | 0.38mi | 3/1.0 (-1) | 1,224 (+12%) | 2mo | $90,000 | $74 | 54 |
| 493 Bacon Ave | 0.31mi | 3/1.5 (-1) | 972 (-11%) | 10mo | $85,000 | $87 | 53 |
| 1040 Hardesty Blvd | 0.65mi | 3/1.5 (-1) | 1,080 (-2%) | 11mo | $135,000 | $125 | 53 |
| 1055 Whittier Ave | 0.69mi | 3/1.0 (-1) | 1,095 (-0%) | 12mo | $72,500 | $66 | 51 |
| 761 Glendora Ave | 0.51mi | 3/1.0 (-1) | 1,210 (+10%) | 3mo | $60,000 | $50 | 50 |
| 575 Fernwood Dr | 0.30mi | 3/1.0 (-1) | 1,248 (+14%) | 8mo | $101,750 | $82 | 49 |
| 650 Easter Ave | 0.58mi | 3/1.0 (-1) | 1,179 (+8%) | 7mo | $50,000 | $42 | 47 |
| 1073 Hartford Ave | 0.66mi | 3/1.0 (-1) | 1,008 (-8%) | 9mo | $140,000 | $139 | 42 |
Match score weights: distance 35% · size 25% · config 20% · recency 20%. Top-matched comps best support the ARV.
Projected returns pro-forma
-3.0% appreciation · 1.65% rent growth · sell at horizon
- IRR
- 3.6%
- Equity multiple
- 1.14×
- Total profit
- $4,202
- Equity at exit
- $16,401
- IRR
- 11.9%
- Equity multiple
- 1.88×
- Total profit
- $27,039
- Equity at exit
- $9,511
Cash invested: $30,800 (down + closing). Projections, not guarantees.
Landlord ↔ Tenant lean methodology
- Overall (STATE)
- 73 Landlord-Friendly
- State Ohio
- 73 Landlord-Friendly · R+6
- County
- — inherits STATE
- City
- — inherits STATE
ZIP-level market 44320
- Rents YoY
- 1.6%
- Active inventory
- 102
- Price-to-rent
- 6.7×
Monthly cashflow live
- Estimated rent
- $1,362 high interval (Pro) →
- Mortgage (P&I)
- −$577
- Tax from tax record
- −$78 /mo · $940/yr
- Insurance
- −$46
- HOA
- −$0
- Vacancy / Maint / Mgmt
- −$286
- Net cashflow
- $375
Break-even live
UW: 25.0% down · 7.5% · 30yr · 1.5% tax · 5.0% vac · 8.0% maint · 8.0% mgmt
Financing live
Cash to close
- Down payment
- $27,500
- Closing costs
- $3,300
- Reserves months
- —
- Total cash needed
- —
Loan-product check · same deal, 3 products live
Conventional
25% down · 7.5% · 30yr
- Down + closing
- —
- Monthly P&I
- —
- Monthly cashflow
- —
- DSCR
- —
- Eligible?
- —
Personal DTI + credit; lowest rate.
DSCR
20% down · 8.5% · 30yr
- Down + closing
- —
- Monthly P&I
- —
- Monthly cashflow
- —
- DSCR
- —
- Eligible?
- —
No personal income docs; deal must DSCR.
Hard money
10% down · 12.0% · 12mo
- Down + closing
- —
- Monthly P&I
- —
- Monthly cashflow
- —
- DSCR
- —
- Eligible?
- —
Short-term bridge; refi at stabilization.
Rent comps 38 comps
| Address | Beds | Baths | Sqft | Rent | $/sqft | DOM | Units | Dist |
|---|---|---|---|---|---|---|---|---|
| 575 Noble Ave Akron, OH | 3.0 | 1.0 | 1300 | $1,350 | $1.04 | 14d | 1 | 0.09mi |
| 844 Lawton St Akron, OH | 4.0 | 2.0 | 1240 | $1,175 | $0.95 | 44d | 1 | 0.18mi |
| 961 Lawton St Akron, OH | 3.0 | 1.0 | 1144 | $1,450 | $1.27 | 14d | 1 | 0.24mi |
| 637 Storer Ave Akron, OH | 3.0 | 1.5 | 1322 | $1,250 | $0.95 | 14d | 1 | 0.30mi |
| 730 Noble Ave Akron, OH | 3.0 | 1.0 | 1092 | $1,200 | $1.10 | 23d | 1 | 0.33mi |
| 677 Crossings Ln Akron, OH | 3.0 | 2.5 | 1440 | $1,950 | $1.35 | 23d | 1 | 0.36mi |
| 924 Hamlin St Akron, OH | 3.0 | 1.0 | 1106 | $1,300 | $1.18 | 44d | 1 | 0.43mi |
| 321 Grace Ave Akron, OH | 3.0 | 2.0 | 1484 | $1,175 | $0.79 | 14d | 1 | 0.47mi |
| 918 Bye St Akron, OH | 3.0 | 1.0 | 1248 | $1,200 | $0.96 | 44d | 1 | 0.49mi |
| 295 Noble Ave Akron, OH | 3.0 | 2.5 | 1488 | $1,600 | $1.08 | 44d | 1 | 0.53mi |
| 1040 Mercer Ave Akron, OH | 3.0 | 1.0 | 850 | $1,400 | $1.65 | 21d | 1 | 0.55mi |
| 1092 Peerless Ave Akron, OH | 3.0 | 1.0 | 998 | $1,200 | $1.20 | 44d | 1 | 0.63mi |
| 378 Trigonia Dr Akron, OH | 3.0 | 1.5 | 1090 | $1,200 | $1.10 | 44d | 1 | 0.67mi |
| 601 Glendora Ave Akron, OH | 3.0 | 1.0 | 1310 | $1,200 | $0.92 | 44d | 1 | 0.70mi |
| 1090 Hartford Ave Akron, OH | 4.0 | 1.0 | 1328 | $1,125 | $0.85 | 44d | 1 | 0.73mi |
| 445 S Maple St Akron, OH | 3.0 | 1.5 | 1041 | $1,240 | $1.19 | 44d | 7 | 0.76mi |
| 991 Diana Ave Akron, OH | 3.0 | 2.0 | 1264 | $1,325 | $1.05 | 44d | 1 | 0.80mi |
| 783 Leonard St Akron, OH | 3.0 | 1.0 | 1040 | $1,250 | $1.20 | 44d | 1 | 0.85mi |
| 202 Westwood Ave Akron, OH | 3.0 | 1.0 | 1344 | $1,250 | $0.93 | 14d | 1 | 0.91mi |
| 627 Crosby St Unit B Akron, OH | 4.0 | 1.0 | 1200 | $875 | $0.73 | 44d | 1 | 0.93mi |
| 152 S Balch St Akron, OH | 3.0 | 1.5 | 1000 | $1,195 | $1.20 | 44d | 1 | 0.98mi |
| 1142 Jefferson Ave Unit 2 Akron, OH | 3.0 | 1.0 | 1200 | $1,150 | $0.96 | 44d | 1 | 0.99mi |
| 1161 Seward Ave Akron, OH | 3.0 | 1.5 | 1000 | $1,200 | $1.20 | 14d | 1 | 1.06mi |
| 900 W Market St Akron, OH | 2.0–3.0 | 1.5–2.0 | 1880 | $2,340 | $1.24 | 23d | 6 | 1.09mi |
| 1331 Thurston St Unit 1326 Akron, OH | 3.0 | 1.0 | 900 | $925 | $1.03 | 44d | 1 | 1.10mi |
| 1326 Thurston St Unit 1326 Akron, OH | 3.0 | 1.0 | 900 | $925 | $1.03 | 23d | 1 | 1.10mi |
| 1328 Thurston St Unit 1328 Akron, OH | 3.0 | 1.0 | 900 | $925 | $1.03 | 23d | 1 | 1.11mi |
| 1494 Diagonal Rd Akron, OH | 3.0 | 1.0 | 1064 | $1,495 | $1.41 | 44d | 1 | 1.15mi |
| 80 N Portage Path Akron, OH | 2.0–3.0 | 2.0 | 1462 | $1,720 | $1.18 | 44d | 1 | 1.22mi |
| 685 Longview Ave Akron, OH | 3.0 | 1.0 | 1100 | $1,150 | $1.05 | 44d | 1 | 1.28mi |
| 39 N Balch St Akron, OH | 4.0 | 1.0 | 1000 | $995 | $0.99 | 44d | 1 | 1.29mi |
| 1313 Manchester Rd Akron, OH | 3.0 | 1.0 | 1221 | $1,200 | $0.98 | 21d | 1 | 1.31mi |
| 1161 La Croix Ave Akron, OH | 3.0 | 1.0 | 1452 | $1,200 | $0.83 | 23d | 1 | 1.35mi |
| 1047 Yukon Ave Akron, OH | 3.0 | 1.0 | 966 | $995 | $1.03 | 21d | 1 | 1.39mi |
| 783 Boulevard St Akron, OH | 4.0 | 1.0 | 1440 | $999 | $0.69 | 23d | 1 | 1.44mi |
| 207 Crosby St Akron, OH | 4.0 | 1.0 | 1200 | $1,395 | $1.16 | 44d | 1 | 1.45mi |
| 1032 Andrew St Akron, OH | 3.0 | 1.0 | 960 | $1,097 | $1.14 | 44d | 1 | 1.49mi |
| 218 Twin Oaks Rd Unit 222-16 Akron, OH | 3.0 | 2.0 | 1400 | $1,500 | $1.07 | 44d | 1 | 1.50mi |
Listing history 11 events
-
2026-06-10status $110,000 Pending 46 DOM
-
2026-06-09days on market $110,000 Active 46 DOM
-
2026-06-08days on market $110,000 Active 45 DOM
-
2026-06-07days on market $110,000 Active 44 DOM
-
2026-06-05days on market $110,000 Active 41 DOM
-
2026-06-03days on market $110,000 Active 40 DOM
-
2026-06-02days on market $110,000 Active 39 DOM
-
2026-06-01days on market $110,000 Active 38 DOM
-
2026-05-31days on market $110,000 Active 37 DOM
-
2026-05-31days on market $110,000 Active 36 DOM
-
2026-04-23$120,000 Active 450-char remark
ⓘ Source: listings_history table (triggers on properties + properties_extension) + one-shot
backfill from property_details.listing_events for pre-trigger history.
Tax reassessment forecast OH · Partial reset (capped growth)
- Current annual tax
- $940 · $78/mo
- Projected year-2 tax
- $1,328 · $111/mo
- Expected delta
- +$388/yr (+$32/mo · 41.3%)
ⓘ Screening estimate from a state-policy table — verify with the county assessor before closing.
Climate risk First Street
- Flood 1/10 Low FEMA zone X (unshaded) · 0% chance over 30 yrs
- Wildfire 1/10 Low
- Heat 3/10 Moderate 7 d/yr ≥97°F today · 17 d/yr by 30 yrs out
- Wind 1/10 Low
- Air quality 2/10 Low 1 unhealthy d/yr today · 2 by 30 yrs out
Nearby sold comps map
Loading sold comps map…
Walkable amenities ~0.75 mi
Loading nearby amenities…
Taxation est. · year 1
- Rental income
- $16,340
- − Mortgage interest
- −$6,162
- − Property taxes
- −$940
- − Insurance
- −$550
- − Repairs & maintenance
- −$1,307
- − Management
- −$1,307
- − Depreciation
- −$3,200
- Taxable income
- $2,874
- Est. tax owed @ 24.0%
- −$690
- After-tax cash flow
- $3,807/yr
For passive investors: Depreciation is non-cash, so a rental often shows a tax loss while cash-flowing — sheltering income. Rental losses are passive: they offset passive income freely, and up to $25,000/yr can offset ordinary (W-2) income if you actively participate and your MAGI is under $100k (phasing out to $0 by $150k); unused losses carry forward. On sale, claimed depreciation is recaptured at up to 25%, and gains may owe capital-gains tax (a 1031 exchange can defer both). Figures are a year-1 estimate at your 24.0% rate — not tax advice; consult a CPA.
Schools (NCES district)
- District
- Akron City
- NCES district ID
- 3904348
- Math proficiency
- 22% ▼ -17.00%
- Reading proficiency
- 30% ▼ -12.00%
- Median HH income
- $33,811
- Composite
- 21.31/100
- National rank
- #8383
- State rank
- #602 of 656 in OH
Livability — Akron
- Score
- 81/100
- State rank
- #104
- US rank
- #1591
Category grades
Schools grade is shown separately in the Schools card above.
Census & demographics
- Census place
- Akron, OH
- County
- Summit County · 440,783 people
- City population
- 174,375
- Metro
- Akron, OH
- Population (ZIP)
- 17,690
- Household income
- $41,241
- Rent vs Own
- Severe rent burden
- 1316.0
Population outlook (Summit County) Hauer SSP2
- Today (2025)
- 546,583 people
- By 2030
- 544,028 · -0.5%
- By 2040
- 531,363 · -2.8%
- By 2050
- 514,923 · -5.8%
- By 2075
- 481,765 · -11.9%
- By 2100
- 432,265 · -20.9%
Race, ethnicity, and origin ACS 2023
- Neighborhood character
- Majority Black (63%)
- Race & ethnicity
- Black 63% White 27% Two or more races 7% Hispanic / Latino 4%
- Common ancestry
- Romanian 2% Italian 1% Scotch-Irish 1%
- Foreign-born
- 2% · Canada
- Languages at home
- 97% English-only · Spanish 1% Other Indo-European 1%
Political lean MEDSL · Summit
- 2024 margin
- Lean D (+7.0) · D 53.0% · R 46.0%
- 2008→2024 swing
- -9.6pp toward R · 2008: 16.6pp · 2024: 7.0pp
- All cycles
- 2024: D+7.0 2020: D+9.6 2016: D+8.2 2012: D+14.8 2008: D+16.6
Not yet ingested
- Civics
- —
Market trends
- HPI YoY
- ▼ -117.69%
- Current HPI
- 122.9888
- Rent YoY
- ▲ 1.65%
- Metro
- Akron, OH
- State GDP YoY
- ▲ 1.98%
- F500 in state
- 48
Industry mix (Fortune 500 HQ in OH)
| Industry | F500 HQs | Revenue |
|---|---|---|
| Insurance | 3 | $145B |
|
||
| Industrial Machinery | 3 | $49B |
|
||
| Financial Services | 3 | $24B |
|
||
| Consumer Goods | 2 | $93B |
|
||
| Aerospace / Defense | 2 | $47B |
|
||
| Utilities | 2 | $33B |
|
||
Price history
-8.3% since first listed3 events — show timeline
- 2026-06-09 Pending — MLSNOW
- 2026-05-22 Price Changed $110,000 MLSNOW
- 2026-04-23 Listed $120,000 MLSNOW
Property tax history
+7.6%/yrLatest (2025): $940 · -14.8% YoY. Source: county tax records.
Cash-flow waterfall
monthlySold comps — $/sqft
last 12 mo · ≤1 miLoading sold comps…