1610 N Dalary Pt · Lecanto, FL
Flood risk 1/10 · Minimal
- FEMA flood zone
- X (unshaded)
- Chance of flooding over 30 yrs
- 0.0%
- Est. flood insurance / yr
- $507 – $1,088
Fire risk 4/10 · Minor
- Est. fire insurance / yr
- $947 – $1,759
Heat risk 10/10 · Severe
- Hot days now (above 108°F)
- 7 days/yr
- Hot days in 30 yrs
- 25 days/yr
Wind risk 9/10 · Severe
- Chance of severe wind over 30 yrs
- 99.0%
Air-quality risk 1/10 · Minimal
- Unhealthy air days now
- 0 days/yr
- Unhealthy air days in 30 yrs
- 0 days/yr
Risk factors via First Street. Map © Google.
Why this score? — see what drove the D grade
The composite is a weighted blend of 9 inputs, each scored 0–100. Each bar is that input's sub-score; the figure is the points it added to the 100-point composite (weight × sub-score).
- Cash flow +12.7/30.0
- ARV discount +7.5/15.0
- 1% rule +5.9/10.0
- Schools +4.1/10.0
- DSCR +3.8/10.0
- Livability +3.2/5.0
- Rent growth +2.5/5.0
- Condition / age +2.5/5.0
- Appreciation +0.0/10.0
$185,000
🖨 Deal sheet (PDF) 📄 Offer letter ✓ Due diligence
Listing remarks
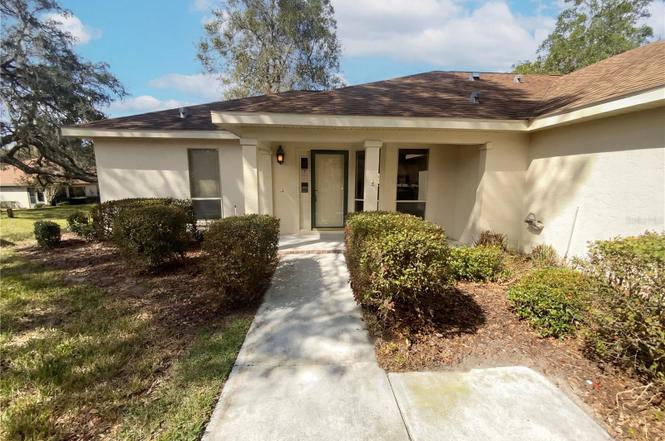
Welcome to 1610 N Dalary Pt, a home that has been thoughtfully updated for modern living. The recent partial flooring replacement adds a fresh and contemporary feel to the property, enhancing its overall appeal. The primary bedroom is a true retreat, boasting a spacious walk-in closet that provides ample storage for your wardrobe. The primary bathroom is a haven of relaxation, featuring double sinks for added convenience and ease during your morning routine. Step outside to a covered patio in the back yard, perfect for entertaining or simply enjoying a quiet moment. This home is a perfect blend of style and functionality, waiting for you to make it your own. Included 100-Day Home Warranty w
Key facts
- Double sinks
- $370 HOA
- Garage
Tags
Property features AI
Finance
- Other: Total acreage: less than 1/4 acre (approx. 0.09 acres); Living area about 1,288 sq. ft.; Community pool
- Financial info: Lease restrictions apply
- HOA & community: HOA managed by Parklane Real Estate Services; Master association: Meadowcrest; Monthly HOA fee of $370.39; includes pool, trash, and other services; Association approval required; Pets allowed (large weight limit)
Exterior
- Parking: Driveway; Attached garage (1 car)
- Security: Owned security system
- Utilities: Public water; Public sewer; Electricity available; Water available
- Home design: Residential townhouse; One story; Faces east
- Construction: Stucco construction; Shingle roof; Slab foundation; Built as ARBOR COURT (building name)
- Exterior features: Other exterior features; Concrete road access
Interior
- Kitchen: Dishwasher; Microwave; Electric water heater; Other appliance(s)
- Bedrooms: 2 bedrooms
- Flooring: Carpet; Laminate; Tile
- Bathrooms: 2 full bathrooms
- Heating & cooling: Central heating; No central cooling
- Interior features: Ceiling fans; Eat-in kitchen; Security system (owned)
- Laundry & utility: Laundry in garage
Neighborhood map
What this means for you Summary
Snapshot
- This is a 2-bed/2.0-bath condo listed at $185k.
Deal economics
- At list price, monthly cash flow is $-20 ($-244/yr) — negative.
- To cash-flow at today's rent, offer at most $181k (1.9% below list).
- Meets the 1% rule at list price ($2k rent vs $185k).
- Recommended offer: $168k (9.0% below list) — sets the bar for market timing.
Location & tenants
- Location reads 64/100 on livability (#680 in FL) — a middle-class / working-renter tenant base. Strengths: cost of living A+, housing A, crime B; Watch: health & safety C-, employment D, amenities F.
- Citrus (rural): math 49% / reading 50% proficiency, ranked #44 of 73 in FL (top 60%) — families likely to look elsewhere, expect single-tenant / working-renter base with shorter leases.
- Zoned schools: Rock Crusher Elementary School (math 70% / reading 56%, grade B, #582 of 2,144 statewide, top 28%, 665 students, 68% FRL); Crystal River Middle School (math 49% / reading 47%, grade C-, #286 of 571 statewide, top 50%, 900 students, 64% FRL); Crystal River High School (math 31% / reading 44%, grade F, #336 of 667 statewide, top 51%, 1,249 students, 56% FRL).
- Market conditions: 327 active listings in the ZIP; 5 comparable units currently listed for rent nearby; rentals at typical pace (median 23d on market — plan ~3-4 weeks tenant-placement turnaround); 2,443 units permitted in Citrus County in 2024 (0 in 5+ unit buildings).
Forward outlook
- Local home prices are declining (-3.0%/yr); year-one equity from $1k of loan paydown is wiped out by about $6k of value loss. Plan a longer hold.
- Citrus County population projected to shrink 10% by 2050 — rents likely to lag national; underwrite the cash flow, not the appreciation.
Negotiation context
- It's been on market 108 days — a 9% lower offer ($168k) is reasonable based on typical stale-listing flexibility.
- 2 sale attempts since 2y ago; this cycle's ask has dropped $17k (8%) from the opening price — seller is motivated, your offer sets the floor, not the list.
Risks & watch-outs
- Climate carrying-cost: severe wind risk, 99% chance of damaging wind over 30y; extreme-heat days projected 7→25/yr by 2055 (HVAC capex compounding) — expect insurance premiums to compound above CPI over the hold.
Questions for the listing agent
- What do current leases actually rent for vs. the listed asking? Can we see a recent rent roll and the last 12 months of T-12 income?
- It's been on market 108 days. Have you received any prior offers? Is the seller open to a 9% concession, seller financing, or rate buy-down credit?
- What does the HOA fee cover, when was the last increase, and are there any pending special assessments or reserve-fund shortfalls?
- Any open or pending special assessments — roof, HVAC, plumbing, elevator, façade? What's the per-unit balance and payoff schedule, and is the seller paying it off at close or rolling it to the buyer?
- Why hasn't it sold? Are there any deal-killer items the seller is aware of (foundation, flood, title, zoning, code violations)?
- Is there a deadline driving the sale (1031 exchange, divorce, estate, relocation)? That informs how much negotiation room exists.
- Schools are D-rated, which usually means shorter tenancies and higher turnover. Who's the typical renter profile here, and what's been the actual vacancy rate?
- The area grade is low — what's the realistic commute time and amenity access for the typical tenant pool here? Any planned neighborhood developments (good or bad) we should know about?
- What's the average days-on-market for RENTAL listings here right now (not sales)? A rising rental-DOM trend means longer vacancies and softer asking-rent achievability than the comps imply.
- What's the recent tenant-quality profile in this submarket — average credit score on applications, eviction rate, late-payment / NSF rate, and stable-employment percentage? A property-management company in the area should have these aggregated.
- How much new apartment / multifamily construction is in the pipeline within 1–3 miles? Heavy new supply (>2% of stock underway) typically softens rents 12–24 months out; light construction supports rent growth.
Investment metrics
- 1% rule
- 1.09% ✓
- Cap rate
- 6.16%
- Cash-on-cash
- -0.47%
- DSCR
- 0.98
- GRM
- 7.7
CMA / ARV
No comps found within radius.
Projected returns pro-forma
-3.0% appreciation · 3.0% rent growth · sell at horizon
- IRR
- -16.9%
- Equity multiple
- 0.40×
- Total profit
- $-31,042
- Equity at exit
- $27,584
- IRR
- -8.5%
- Equity multiple
- 0.46×
- Total profit
- $-27,752
- Equity at exit
- $15,995
Cash invested: $51,800 (down + closing). Projections, not guarantees.
Landlord ↔ Tenant lean methodology
- Overall (STATE)
- 87 Strongly Landlord-Friendly
- State Florida
- 87 Strongly Landlord-Friendly · R+3
- County
- — inherits STATE
- City
- — inherits STATE
ZIP-level market 34429
- Home prices YoY
- -17.8%
- Active inventory
- 327
- Price-to-rent
- 7.7×
Monthly cashflow live
- Estimated rent
- $2,011 high interval (Pro) →
- Mortgage (P&I)
- −$970
- Tax from tax record
- −$192 /mo · $2,301/yr
- Insurance
- −$77
- HOA
- −$370
- Vacancy / Maint / Mgmt
- −$422
- Net cashflow
- $-20
Break-even live
Sensitivity live
| Price | -10% $84 | -5% $32 | +0% $-20 | +5% $-73 | +10% $-125 |
|---|---|---|---|---|---|
| Rent | -10% $-179 | -5% $-100 | +0% $-20 | +5% $59 | +10% $138 |
| Rate | -1.0pp $73 | -0.5pp $27 | base $-20 | +0.5pp $-68 | +1.0pp $-117 |
UW: 25.0% down · 7.5% · 30yr · 1.5% tax · 5.0% vac · 8.0% maint · 8.0% mgmt
Financing live
Cash to close
- Down payment
- $46,250
- Closing costs
- $5,550
- Reserves months
- —
- Total cash needed
- —
Loan-product check · same deal, 3 products live
Conventional
25% down · 7.5% · 30yr
- Down + closing
- —
- Monthly P&I
- —
- Monthly cashflow
- —
- DSCR
- —
- Eligible?
- —
Personal DTI + credit; lowest rate.
DSCR
20% down · 8.5% · 30yr
- Down + closing
- —
- Monthly P&I
- —
- Monthly cashflow
- —
- DSCR
- —
- Eligible?
- —
No personal income docs; deal must DSCR.
Hard money
10% down · 12.0% · 12mo
- Down + closing
- —
- Monthly P&I
- —
- Monthly cashflow
- —
- DSCR
- —
- Eligible?
- —
Short-term bridge; refi at stabilization.
Rent comps 5 comps
| Address | Beds | Baths | Sqft | Rent | $/sqft | DOM | Units | Dist |
|---|---|---|---|---|---|---|---|---|
| 6084 W Fairhaven Ct Crystal River, FL | 2.0 | 2.0 | 1545 | $2,200 | $1.42 | 22d | 1 | 0.19mi |
| 5926 W Poplar Springs Cir Unit 2101 Crystal River, FL | 3.0 | 2.0 | 1200 | $1,895 | $1.58 | 22d | 1 | 0.32mi |
| 6384 W Flanders Ln Crystal River, FL | 3.0 | 2.0 | 1800 | $2,250 | $1.25 | 22d | 1 | 0.71mi |
| 1136 N Tiger Pt Unit 1136 Lecanto, FL | 3.0 | 1.5 | 1000 | $1,495 | $1.50 | 22d | 1 | 0.75mi |
| 1165 N Commerce Ter Lecanto, FL | 3.0 | 2.5 | 1697 | $1,800 | $1.06 | 22d | 1 | 0.87mi |
HOA detail condo
- Monthly dues
- $370 · $4,440/yr
- Assessments
- None detected in remarks — confirm with the listing agent.
Listing history 29 events
-
2026-06-21days on market $185,000 Active 108 DOM
-
2026-06-19days on market $185,000 Active 106 DOM
-
2026-06-18days on market $185,000 Active 105 DOM
-
2026-06-17days on market $185,000 Active 104 DOM
-
2026-06-16days on market $185,000 Active 103 DOM
-
2026-06-15days on market $185,000 Active 102 DOM
-
2026-06-14days on market $185,000 Active 100 DOM
-
2026-06-13days on market $185,000 Active 99 DOM
-
2026-06-09days on market $185,000 Active 96 DOM
-
2026-06-08days on market $185,000 Active 95 DOM
-
2026-06-03days on market $185,000 Active 90 DOM
-
2026-06-02days on market $185,000 Active 89 DOM
-
2026-06-01days on market $185,000 Active 88 DOM
-
2026-05-31days on market $185,000 Active 87 DOM
-
2026-05-30days on market $185,000 Active 86 DOM
-
2026-05-21price $185,000
-
2026-05-07price $190,000
-
2026-04-16price $195,000
-
2026-03-26price $198,000
-
2026-03-05$202,000 Active
-
2026-02-26soldstatus $177,100
-
2025-06-25price $180,000
-
2025-04-15price $205,000
-
2025-02-08historical
-
2024-11-06price $239,000
-
2024-11-05price $239,000
-
2024-08-21$249,000 Active
-
2001-06-01soldstatus $75,000
-
1987-10-01soldstatus $68,900
ⓘ Source: listings_history table (triggers on properties + properties_extension) + one-shot
backfill from property_details.listing_events for pre-trigger history.
Tax reassessment forecast FL · Resets to sale price
- Current annual tax
- $2,301 · $192/mo
- Projected year-2 tax
- $2,301 · $192/mo
- Expected delta
- $0/yr ($0/mo · 0.0%)
ⓘ Screening estimate from a state-policy table — verify with the county assessor before closing.
Climate risk First Street
- Flood 1/10 Low FEMA zone X (unshaded) · 0% chance over 30 yrs
- Wildfire 4/10 Moderate
- Heat 10/10 Extreme 7 d/yr ≥108°F today · 25 d/yr by 30 yrs out
- Wind 9/10 Extreme 99% chance of damaging wind over 30 yrs
- Air quality 1/10 Low 0 unhealthy d/yr today · 0 by 30 yrs out
Nearby sold comps map
Loading sold comps map…
Walkable amenities ~0.75 mi
Loading nearby amenities…
Taxation est. · year 1
- Rental income
- $24,131
- − Mortgage interest
- −$10,363
- − Property taxes
- −$2,301
- − Insurance
- −$925
- − Repairs & maintenance
- −$1,930
- − Management
- −$1,930
- − HOA
- −$4,440
- − Depreciation
- −$5,382
- Taxable loss
- −$3,141
- Est. tax savings @ 24.0%
- +$754
- After-tax cash flow
- $509/yr
For passive investors: Depreciation is non-cash, so a rental often shows a tax loss while cash-flowing — sheltering income. Rental losses are passive: they offset passive income freely, and up to $25,000/yr can offset ordinary (W-2) income if you actively participate and your MAGI is under $100k (phasing out to $0 by $150k); unused losses carry forward. On sale, claimed depreciation is recaptured at up to 25%, and gains may owe capital-gains tax (a 1031 exchange can defer both). Figures are a year-1 estimate at your 24.0% rate — not tax advice; consult a CPA.
Schools (NCES district)
- District
- Citrus
- NCES district ID
- 1200270
- Math proficiency
- 49% ▼ -10.00%
- Reading proficiency
- 50% ▼ -6.00%
- Median HH income
- $38,618
- Composite
- 41.28/100
- National rank
- #3519
- State rank
- #44 of 73 in FL
Livability — Lecanto
- Score
- 64/100
- State rank
- #680
- US rank
- #14112
Category grades
Schools grade is shown separately in the Schools card above.
Census & demographics
- City population
- 13,377
- Population (ZIP)
- 9,494
Population outlook (Citrus County) Hauer SSP2
- Today (2025)
- 138,622 people
- By 2030
- 136,886 · -1.3%
- By 2040
- 132,009 · -4.8%
- By 2050
- 125,196 · -9.7%
- By 2075
- 108,570 · -21.7%
- By 2100
- 84,454 · -39.1%
Race, ethnicity, and origin ACS 2023
- Neighborhood character
- Predominantly White (88%)
- Race & ethnicity
- White 88% Black 5% Hispanic / Latino 4% Two or more races 3%
- Common ancestry
- Italian 7% Slovak 2% Lithuanian 2%
- Foreign-born
- 4% · Canada
- Languages at home
- 97% English-only · Spanish 1% Tagalog/Filipino 1%
Political lean MEDSL · Citrus
- 2024 margin
- Solid R (+45.9) · D 26.8% · R 72.6%
- 2008→2024 swing
- -29.8pp toward R · 2008: -16.1pp · 2024: -45.9pp
- All cycles
- 2024: R+45.9 2020: R+41.0 2016: R+39.7 2012: R+21.9 2008: R+16.1
Not yet ingested
- Civics
- —
Market trends
- HPI YoY
- ▼ -58.92%
- Current HPI
- 271.3171
- Rent YoY
- —
- Metro
- —
- State GDP YoY
- ▲ 3.28%
- F500 in state
- 36
Industry mix (Fortune 500 HQ in FL)
| Industry | F500 HQs | Revenue |
|---|---|---|
| Industrial Technology | 2 | $29B |
|
||
| Insurance | 2 | $17B |
|
||
| Retail | 1 | $60B |
|
||
| Technology Distribution | 1 | $58B |
|
||
| Homebuilding | 1 | $35B |
|
||
| Technology Manufacturing | 1 | $35B |
|
||
Price history
+168.5% since first listed14 events — show timeline
- 2026-05-21 Price Changed $185,000 Stellar MLS as Distributed by MLS Grid
- 2026-05-07 Price Changed $190,000 Stellar MLS as Distributed by MLS Grid
- 2026-04-16 Price Changed $195,000 Stellar MLS as Distributed by MLS Grid
- 2026-03-26 Price Changed $198,000 Stellar MLS as Distributed by MLS Grid
- 2026-03-05 Listed $202,000 Stellar MLS as Distributed by MLS Grid
- 2026-02-26 Sold (Public Records) $177,100 Public Records
- 2025-06-25 Price Changed $180,000 RACC
- 2025-04-15 Price Changed $205,000 RACC
- 2025-02-08 Listing Removed — Stellar MLS as Distributed by MLS Grid
- 2024-11-06 Price Changed $239,000 Stellar MLS as Distributed by MLS Grid
- 2024-11-05 Price Changed $239,000 RACC
- 2024-08-21 Listed $249,000 Stellar MLS as Distributed by MLS Grid
- 2001-06-01 Sold (Public Records) $75,000 Public Records
- 1987-10-01 Sold (Public Records) $68,900 Public Records
Property tax history
+13.3%/yrLatest (2025): $2,301 · +2.4% YoY. Source: county tax records.
Cash-flow waterfall
monthlySold comps — $/sqft
last 12 mo · ≤1 miLoading sold comps…