 Triplex
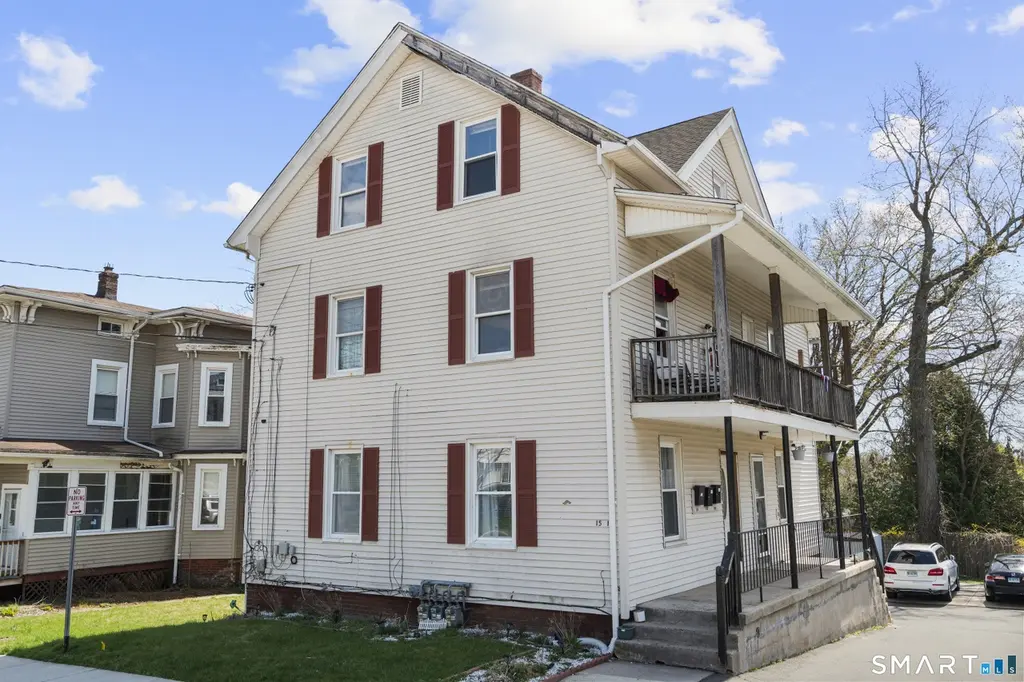
15 Jubilee St · New Britain, CT
Flood risk No data
- FEMA flood zone
- —
- Chance of flooding over 30 yrs
- —
- Est. flood insurance / yr
- —
Fire risk No data
- Est. fire insurance / yr
- —
Heat risk No data
- Hot days now (above threshold)
- —
- Hot days in 30 yrs
- —
Wind risk No data
- Chance of severe wind over 30 yrs
- —
Air-quality risk No data
- Unhealthy air days now
- —
- Unhealthy air days in 30 yrs
- —
Risk factors via First Street. Map © Google.
Why this score? — see what drove the C grade
The composite is a weighted blend of 9 inputs, each scored 0–100. Each bar is that input's sub-score; the figure is the points it added to the 100-point composite (weight × sub-score).
- Cash flow +23.2/30.0
- Appreciation +10.0/10.0
- DSCR +7.4/10.0
- 1% rule +6.1/10.0
- Livability +3.7/5.0
- Condition / age +2.5/5.0
- Rent growth +2.4/5.0
- Schools +1.0/10.0
- ARV discount +0.0/15.0
$445,000
🖨 Deal sheet 📄 Offer letter ✓ Due diligence
Multi-family units
County records classify this as Multi-Family (2-4 Unit). Listing-text estimate: 3 units. confirmed
Listing remarks MLS
UPDATED AND VERY CLEAN THREE FAMILY FEATURING THREE BEDROOMS ON FIRST AND SECOND FLOOR. ONE BEDROOM ON THIRD FLOOR. ALL FLOORS RENTED. BRAND NEW ROOF AND GUTTERS. VINYL SIDING.DEEP FENCED YARD. A MUST SEE
Key facts
- 5,227 sq ft lot
- 5 parking spots
- Built 1900
Property features AI
Exterior
- Parking: Private paved driveway; Off-street parking; Paved surfaces; Total of 5 parking spaces
- Utilities: Public water connected; Public sewer (in street); Natural gas hot water
- Home design: Multi-family property (3-family); Multi-family for sale; Pale yellow exterior
- Construction: Built with frame construction; Concrete foundation; Asphalt shingle roof; Vinyl siding
- Exterior features: Sidewalk; Awnings; Porch; Gutters; Exterior lighting; Level lot
Interior
- Bedrooms: 7 bedrooms
- Bathrooms: 3 full bathrooms
- Heating & cooling: Wall unit heating; Wall unit cooling
- Interior features: 13 total rooms; Partial basement
Neighborhood map
What this means for you Summary
Snapshot
- This is a 2×3bd/1.0ba + 1×1bd/1.0ba units multifamily listed at $445k.
Deal economics
- At list price, monthly cash flow is $802 ($10k/yr) — positive. Per door: $267/mo.
- The deal already cash-flows at list — no discount required.
- Meets the 1% rule at list price ($5k rent vs $445k).
- Recommended offer: $432k (3.0% below list) — sets the bar for market timing.
- Cap rate 8.5% vs local median 4.4% in New Britain — top-decile yield for the area; either an underpriced asset or a hidden risk that comps aren't pricing in. Stress-test before assuming the spread holds.
Location & tenants
- Location reads 74/100 on livability (#67 in CT, #4,936 nationally) — a middle-class / working-renter tenant base. Strengths: health & safety A+, cost of living A, housing A; Watch: crime D, employment D, schools F.
- New Britain School District (suburban): math 6% / reading 17% proficiency, ranked #153 of 153 in CT (top 100%) — low school quality limits family demand, transient renter base, plan for 1-2y turnover; 71% free/reduced lunch — lower-income household profile, screen leases tightly.
- Market conditions: Rents soft (-0.6%/yr); 63 active listings in the ZIP; 1,867 units permitted in Capitol Planning Region in 2024 (1,399 in 5+ unit buildings).
- At $4,932/mo this rent would consume 116% of the median local household income ($51k/yr) (locally 2100% of renters already pay >50% of income on rent) — very limited rent-growth headroom before tenants either downsize or default.
Forward outlook
- In year one you build about $48k of equity ($3k loan paydown + $44k appreciation (10.0% local appreciation)).
- At projected returns (10.0% appreciation + 0.0% rent growth), your $125k cash investment doubles in ~3 years — after that, you're playing with house money.
- By year 2, paydown + projected appreciation supports a ~$76k cash-out refi (75% LTV) — recoverable capital for the next deal without selling this one.
Negotiation context
- It's been on market 42 days — a 3% lower offer ($432k) is reasonable based on typical stale-listing flexibility.
- 6 sale attempts since 24y ago with the ask held roughly flat each time — persistent listings suggest the price (not the market) is what's stuck; bring a comps-based counter.
- Current owner paid $260k; list at $445k implies a 71% gain — meaningful room to come down on a strong offer.
Risks & watch-outs
- Watch-outs: built in 1900 — expect roof / HVAC / electrical / plumbing capex.
Questions for the listing agent
- It's been on market 42 days. Have you received any prior offers? Is the seller open to a 3% concession, seller financing, or rate buy-down credit?
- Can we see the unit-by-unit rent roll, current vacancy, and any below-market leases? What's the average tenancy length?
- What capital expenditures (roof, boiler, parking lot, exteriors) have been made in the last 5 years, and what's planned in the next 2?
- Built in 1900 — when were the roof, HVAC, electrical panel, plumbing, and water heater last replaced?
- Is there a deadline driving the sale (1031 exchange, divorce, estate, relocation)? That informs how much negotiation room exists.
- Schools are F-rated, which usually means shorter tenancies and higher turnover. Who's the typical renter profile here, and what's been the actual vacancy rate?
- Crime grade is D in this area — have there been break-ins, vandalism, or insurance claims at this property in the last 3 years? What carrier currently insures it and at what premium?
- What's the average days-on-market for RENTAL listings here right now (not sales)? A rising rental-DOM trend means longer vacancies and softer asking-rent achievability than the comps imply.
- What's the recent tenant-quality profile in this submarket — average credit score on applications, eviction rate, late-payment / NSF rate, and stable-employment percentage? A property-management company in the area should have these aggregated.
- How much new apartment / multifamily construction is in the pipeline within 1–3 miles? Heavy new supply (>2% of stock underway) typically softens rents 12–24 months out; light construction supports rent growth.
Investment metrics
- 1% rule
- 1.11% ✓
- Cap rate
- 8.46%
- Cash-on-cash
- 7.73%
- DSCR
- 1.34
- GRM
- 7.5
CMA / ARV
- ARV (median comp)
- $373,694
- List price
- $445,000
- Delta
- 19.08%
- Verdict
- OVERPRICED
- Comps
- 20 within 1.0 mi
Show comp detail 12 sales within ~0.75 mi
| Address | Dist | Beds/Ba | Sqft | Sold | Price | $/sf | Match |
|---|---|---|---|---|---|---|---|
| 11 Dwight Ct | 0.26mi | 6/3.0 (-1) | 2,210 (-2%) | 3mo | $290,000 | $131 | 77 |
| 144 Dwight St | 0.12mi | 6/3.0 (-1) | 2,033 (-10%) | 5mo | $340,000 | $167 | 68 |
| 408 East St | 0.30mi | 6/4.0 (-1) | 2,231 (-1%) | 9mo | $440,000 | $197 | 68 |
| 115 Belden St | 0.23mi | 6/2.0 (-1) | 2,326 (+3%) | 15mo | $700,000 | $301 | 63 |
| 163 Fairview St | 0.22mi | 6/2.5 (-1) | 2,480 (+10%) | 10mo | $400,000 | $161 | 58 |
| 23 Edward St | 0.41mi | 6/3.0 (-1) | 2,482 (+10%) | 4mo | $360,000 | $145 | 56 |
| 241 Belden St | 0.43mi | 6/2.0 (-1) | 2,332 (+3%) | 13mo | $436,000 | $187 | 55 |
| 137 Newington Ave | 0.36mi | 8/2.0 (+1) | 2,120 (-6%) | 13mo | $365,000 | $172 | 53 |
| 104 Dwight St | 0.19mi | 6/3.0 (-1) | 2,596 (+15%) | 14mo | $425,000 | $164 | 49 |
| 106 Judd Ave | 0.62mi | 6/2.0 (-1) | 2,184 (-3%) | 14mo | $225,000 | $103 | 46 |
| 5 Whitman St | 0.47mi | 6/2.0 (-1) | 2,540 (+12%) | 10mo | $452,000 | $178 | 40 |
| 45 Union St | 0.73mi | 6/2.0 (-1) | 2,060 (-9%) | 12mo | $280,000 | $136 | 32 |
Match score weights: distance 35% · size 25% · config 20% · recency 20%. Top-matched comps best support the ARV.
Projected returns pro-forma
10.0% appreciation · 0.0% rent growth · sell at horizon
- IRR
- 28.7%
- Equity multiple
- 3.24×
- Total profit
- $279,086
- Equity at exit
- $400,891
- IRR
- 24.1%
- Equity multiple
- 7.07×
- Total profit
- $755,972
- Equity at exit
- $864,537
Cash invested: $124,600 (down + closing). Projections, not guarantees.
Landlord ↔ Tenant lean methodology
- Overall (STATE)
- 27 Tenant-Leaning
- State Connecticut
- 27 Tenant-Leaning · D+7
- County
- — inherits STATE
- City
- — inherits STATE
ZIP-level market 06051
- Home prices YoY
- 9.0%
- Rents YoY
- -0.6%
- Active inventory
- 63
- Price-to-rent
- 21.4×
Monthly cashflow live
- Estimated rent
- $4,932 high interval (Pro) →
- Mortgage (P&I)
- −$2,334
- Tax from tax record
- −$575 /mo · $6,900/yr
- Insurance
- −$185
- HOA
- −$0
- Vacancy / Maint / Mgmt
- −$1,036
- Net cashflow
- $802
Break-even live
3-unit breakdown (identical units grouped — click to expand)
| Units | Beds | Baths | Est. rent |
|---|---|---|---|
| 2× units | 3 | 1 | $3,458 |
| #1 | 3 | 1 | $1,729 |
| #2 | 3 | 1 | $1,729 |
| 1× unit | 1 | 1 | $1,473 |
| Total (3 units) | $4,932 | ||
UW: 25.0% down · 7.5% · 30yr · 1.5% tax · 5.0% vac · 8.0% maint · 8.0% mgmt
Financing live
Cash to close
- Down payment
- $111,250
- Closing costs
- $13,350
- Reserves months
- —
- Total cash needed
- —
Loan-product check · same deal, 3 products live
Conventional
25% down · 7.5% · 30yr
- Down + closing
- —
- Monthly P&I
- —
- Monthly cashflow
- —
- DSCR
- —
- Eligible?
- —
Personal DTI + credit; lowest rate.
DSCR
20% down · 8.5% · 30yr
- Down + closing
- —
- Monthly P&I
- —
- Monthly cashflow
- —
- DSCR
- —
- Eligible?
- —
No personal income docs; deal must DSCR.
Hard money
10% down · 12.0% · 12mo
- Down + closing
- —
- Monthly P&I
- —
- Monthly cashflow
- —
- DSCR
- —
- Eligible?
- —
Short-term bridge; refi at stabilization.
Listing history 27 events
-
2026-06-13statusdays on market $445,000 Under Contract 42 DOM
-
2026-06-10days on market $445,000 Active 41 DOM
-
2026-06-09days on market $445,000 Active 40 DOM
-
2026-06-08days on market $445,000 Active 39 DOM
-
2026-06-07days on market $445,000 Active 38 DOM
-
2026-06-05days on market $445,000 Active 35 DOM
-
2026-06-03days on market $445,000 Active 34 DOM
-
2026-06-02days on market $445,000 Active 33 DOM
-
2026-06-01days on market $445,000 Active 32 DOM
-
2026-05-31days on market $445,000 Active 31 DOM
-
2026-05-01$445,000 Active 1045-char remark
-
2026-04-25historical $445,000 1045-char remark
-
2026-01-22historical
-
2026-01-21status Active
-
2025-11-06status Under Contract
-
2025-10-17$420,000 Active
-
2021-11-01soldstatus $260,000
-
2021-08-17soldstatus $260,000 Closed
Show marketing remark (205 chars)
UPDATED AND VERY CLEAN THREE FAMILY FEATURING THREE BEDROOMS ON FIRST AND SECOND FLOOR. ONE BEDROOM ON THIRD FLOOR. ALL FLOORS RENTED. BRAND NEW ROOF AND GUTTERS. VINYL SIDING.DEEP FENCED YARD. A MUST SEE
-
2021-05-30historical
Show marketing remark (205 chars)
UPDATED AND VERY CLEAN THREE FAMILY FEATURING THREE BEDROOMS ON FIRST AND SECOND FLOOR. ONE BEDROOM ON THIRD FLOOR. ALL FLOORS RENTED. BRAND NEW ROOF AND GUTTERS. VINYL SIDING.DEEP FENCED YARD. A MUST SEE
-
2021-05-22historical Under Contract - Continue to Show
Show marketing remark (205 chars)
UPDATED AND VERY CLEAN THREE FAMILY FEATURING THREE BEDROOMS ON FIRST AND SECOND FLOOR. ONE BEDROOM ON THIRD FLOOR. ALL FLOORS RENTED. BRAND NEW ROOF AND GUTTERS. VINYL SIDING.DEEP FENCED YARD. A MUST SEE
-
2020-11-06price $259,900
Show marketing remark (205 chars)
UPDATED AND VERY CLEAN THREE FAMILY FEATURING THREE BEDROOMS ON FIRST AND SECOND FLOOR. ONE BEDROOM ON THIRD FLOOR. ALL FLOORS RENTED. BRAND NEW ROOF AND GUTTERS. VINYL SIDING.DEEP FENCED YARD. A MUST SEE
-
2020-10-20$269,900 Active
Show marketing remark (205 chars)
UPDATED AND VERY CLEAN THREE FAMILY FEATURING THREE BEDROOMS ON FIRST AND SECOND FLOOR. ONE BEDROOM ON THIRD FLOOR. ALL FLOORS RENTED. BRAND NEW ROOF AND GUTTERS. VINYL SIDING.DEEP FENCED YARD. A MUST SEE
-
2005-07-25soldstatus $196,000
-
2005-04-13$189,900
-
2003-04-08soldstatus $108,000
-
2003-04-06soldstatus $108,000
-
2002-10-09$118,000
ⓘ Source: listings_history table (triggers on properties + properties_extension) + one-shot
backfill from property_details.listing_events for pre-trigger history.
Tax reassessment forecast CT · Partial reset (capped growth)
- Current annual tax
- $6,900 · $575/mo
- Projected year-2 tax
- $8,212 · $684/mo
- Expected delta
- +$1,312/yr (+$109/mo · 19.0%)
ⓘ Screening estimate from a state-policy table — verify with the county assessor before closing.
Nearby sold comps map
Loading sold comps map…
Walkable amenities ~0.75 mi
Loading nearby amenities…
Taxation est. · year 1
- Rental income
- $59,184
- − Mortgage interest
- −$24,927
- − Property taxes
- −$6,900
- − Insurance
- −$2,225
- − Repairs & maintenance
- −$4,735
- − Management
- −$4,735
- − Depreciation
- −$12,945
- Taxable income
- $2,717
- Est. tax owed @ 24.0%
- −$652
- After-tax cash flow
- $8,975/yr
For passive investors: Depreciation is non-cash, so a rental often shows a tax loss while cash-flowing — sheltering income. Rental losses are passive: they offset passive income freely, and up to $25,000/yr can offset ordinary (W-2) income if you actively participate and your MAGI is under $100k (phasing out to $0 by $150k); unused losses carry forward. On sale, claimed depreciation is recaptured at up to 25%, and gains may owe capital-gains tax (a 1031 exchange can defer both). Figures are a year-1 estimate at your 24.0% rate — not tax advice; consult a CPA.
Schools (NCES district)
- District
- New Britain School District
- NCES district ID
- 0902670
- Math proficiency
- 6% ▼ -6.00%
- Reading proficiency
- 17% ▼ -5.00%
- Median HH income
- $40,827
- Composite
- 9.95/100
- National rank
- #9816
- State rank
- #153 of 153 in CT
Livability — New Britain
- Score
- 74/100
- State rank
- #67
- US rank
- #4936
Category grades
Schools grade is shown separately in the Schools card above.
Census & demographics
- Census place
- New Britain, CT
- County
- Hartford County · 754,208 people
- City population
- 66,322
- Metro
- Hartford-East Hartford-Middletown, CT
- Population (ZIP)
- 29,548
- Household income
- $51,022
- Rent vs Own
- Severe rent burden
- 2100.0
Population outlook (Capitol County) Hauer SSP2
- By 2040
- 1,063,519
Race, ethnicity, and origin ACS 2023
- Neighborhood character
- Diverse neighborhood (Simpson 0.63)
- Race & ethnicity
- Hispanic / Latino 52% White 30% Two or more races 17% Black 11% Asian 2%
- Hispanic origin (detail)
- Mexican 2% Puerto Rican 40% Dominican 4%
- Common ancestry
- Romanian 7% Lithuanian 6% Slovak 1%
- Foreign-born
- 15% · Canada, Jamaica
- Languages at home
- 51% English-only · Spanish 39% Russian/Polish/Slavic 6% Arabic 3%
Political lean MEDSL · Capitol
- 2024 margin
- Strong D (+21.9) · D 60.1% · R 38.2% · Other 1.7%
- All cycles
- 2024: D+21.9
Not yet ingested
- Civics
- —
Market trends
- HPI YoY
- ▲ 31.52%
- Current HPI
- 382.7816
- Rent YoY
- ▼ -0.58%
- Metro
- Hartford-East Hartford-Middletown, CT
- State GDP YoY
- ▲ 1.06%
- F500 in state
- 38
Industry mix (Fortune 500 HQ in CT)
| Industry | F500 HQs | Revenue |
|---|---|---|
| Industrial Machinery | 4 | $38B |
|
||
| Insurance | 3 | $71B |
|
||
| Financial Services | 2 | $25B |
|
||
| Transportation / Logistics | 2 | $18B |
|
||
| Healthcare | 1 | $247B |
|
||
| Telecommunications | 1 | $55B |
|
||
Price history
+277.1% since first listed18 events — show timeline
- 2026-06-12 Pending — Smart MLS
- 2026-05-01 Listed $445,000 Smart MLS
- 2026-04-25 Coming Soon $445,000 Smart MLS
- 2026-01-22 Listing Removed — Smart MLS
- 2026-01-21 Relisted — Smart MLS
- 2025-11-06 Pending — Smart MLS
- 2025-10-17 Listed $420,000 Smart MLS
- 2021-11-01 Sold (Public Records) $260,000 Public Records
- 2021-08-17 Sold (MLS) $260,000 Smart MLS
- 2021-05-30 Listing Removed — Smart MLS
- 2021-05-22 Contingent — Smart MLS
- 2020-11-06 Price Changed $259,900 Smart MLS
- 2020-10-20 Listed $269,900 Smart MLS
- 2005-07-25 Sold (MLS) $196,000 Smart MLS
- 2005-04-13 Listed $189,900 Smart MLS
- 2003-04-08 Sold (Public Records) $108,000 Public Records
- 2003-04-06 Sold (MLS) $108,000 Smart MLS
- 2002-10-09 Listed $118,000 Smart MLS
Property tax history
+3.6%/yrLatest (2025): $6,900 · +2.3% YoY. Source: county tax records.
Cash-flow waterfall
monthlySold comps — $/sqft
last 12 mo · ≤1 miLoading sold comps…