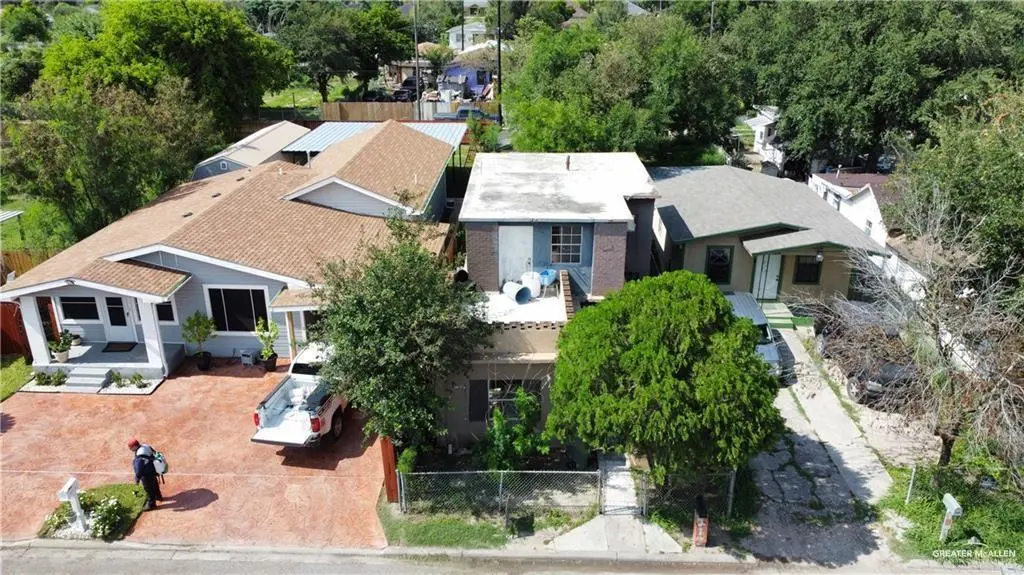
212 E 1st St · San Juan, TX
Flood risk 6/10 · Moderate
- FEMA flood zone
- —
- Chance of flooding over 30 yrs
- 0.72%
- Est. flood insurance / yr
- —
Fire risk 3/10 · Minor
- Est. fire insurance / yr
- $1,222 – $2,270
Heat risk 9/10 · Severe
- Hot days now (above 111°F)
- 7 days/yr
- Hot days in 30 yrs
- 23 days/yr
Wind risk 8/10 · Major
- Chance of severe wind over 30 yrs
- 99.0%
Air-quality risk 3/10 · Minor
- Unhealthy air days now
- 1 days/yr
- Unhealthy air days in 30 yrs
- 4 days/yr
Risk factors via First Street. Map © Google.
Why this score? — see what drove the B- grade
The composite is a weighted blend of 9 inputs, each scored 0–100. Each bar is that input's sub-score; the figure is the points it added to the 100-point composite (weight × sub-score).
- Cash flow +30.0/30.0
- 1% rule +10.0/10.0
- DSCR +10.0/10.0
- ARV discount +7.5/15.0
- Livability +3.6/5.0
- Rent growth +2.5/5.0
- Condition / age +2.5/5.0
- Schools +2.0/10.0
- Appreciation +0.0/10.0
$85,000
🖨 Deal sheet 📄 Offer letter ✓ Due diligence
Listing remarks MLS
This two-story home in San Juan, Texas, offers a spacious 1,299 sq. ft. living area situated on a 3,500 sq. ft. lot, conveniently located near the Basilica of San Juan. With three bedrooms and one bathroom, this property is in need of repairs but presents a fantastic opportunity for renovation and expansion. The ample space for expansion makes it an ideal investment for those looking to create their dream home or next investment venture in a prime location in San Juan, Texas.
Key facts
- Spacious living area
- 3,497 sq ft lot
- Built 1974
Tags
Neighborhood map
What this means for you Summary
Snapshot
- This is a 4-bed/1.0-bath single-family listed at $85k.
Deal economics
- At list price, monthly cash flow is $549 ($7k/yr) — positive.
- The deal already cash-flows at list — no discount required.
- Meets the 1% rule at list price ($2k rent vs $85k).
- Recommended offer: $75k (12.0% below list) — sets the bar for market timing.
- Cap rate 14.0% vs local median 3.4% in San Juan — top-decile yield for the area; either an underpriced asset or a hidden risk that comps aren't pricing in. Stress-test before assuming the spread holds.
Location & tenants
- Location reads 71/100 on livability (#294 in TX) — a middle-class / working-renter tenant base. Strengths: cost of living A+, housing A+, health & safety A+; Watch: schools D, amenities F, commute F.
- Pharr-San Juan-Alamo ISD (suburban): math 18% / reading 30% proficiency, ranked #740 of 826 in TX (top 90%) — low school quality limits family demand, transient renter base, plan for 1-2y turnover; 72% free/reduced lunch — lower-income household profile, screen leases tightly.
- Market conditions: 362 active listings in the ZIP; 12 comparable units currently listed for rent nearby; rentals lingering (median 44d on market — plan ~5-8 weeks vacancy on turnover, expect pricing pressure); 58% of comp listings sitting > 30 days — soft ceiling on asking rent; 7,378 units permitted in Hidalgo County in 2024 (641 in 5+ unit buildings).
Forward outlook
- Local home prices are declining (-3.0%/yr); year-one equity from $588 of loan paydown is wiped out by about $3k of value loss. Plan a longer hold.
- Hidalgo County population projected at +28% by 2050 — long-run rental-demand tailwind backs the buy-and-hold thesis.
- At projected returns (-3.0% appreciation + 3.0% rent growth), your $24k cash investment doubles in ~5 years — after that, you're playing with house money.
Negotiation context
- It's been on market 150 days — a 12% lower offer ($75k) is reasonable based on typical stale-listing flexibility.
- 3 sale attempts since 2y ago with the ask held roughly flat each time — persistent listings suggest the price (not the market) is what's stuck; bring a comps-based counter.
Risks & watch-outs
- Climate carrying-cost: major flood risk; severe wind risk, 99% chance of damaging wind over 30y; extreme-heat days projected 7→23/yr by 2055 (HVAC capex compounding) — expect insurance premiums to compound above CPI over the hold.
Questions for the listing agent
- It's been on market 150 days. Have you received any prior offers? Is the seller open to a 12% concession, seller financing, or rate buy-down credit?
- Built in 1974 — when were the roof, HVAC, electrical panel, plumbing, and water heater last replaced?
- Why hasn't it sold? Are there any deal-killer items the seller is aware of (foundation, flood, title, zoning, code violations)?
- Is there a deadline driving the sale (1031 exchange, divorce, estate, relocation)? That informs how much negotiation room exists.
- Schools are D-rated, which usually means shorter tenancies and higher turnover. Who's the typical renter profile here, and what's been the actual vacancy rate?
- What's the average days-on-market for RENTAL listings here right now (not sales)? A rising rental-DOM trend means longer vacancies and softer asking-rent achievability than the comps imply.
- What's the recent tenant-quality profile in this submarket — average credit score on applications, eviction rate, late-payment / NSF rate, and stable-employment percentage? A property-management company in the area should have these aggregated.
- How much new for-sale + rental construction is in the pipeline within 1–3 miles? Heavy new supply typically softens prices + rents 12–24 months out; constrained supply supports both.
Investment metrics
- 1% rule
- 1.77% ✓
- Cap rate
- 14.05%
- Cash-on-cash
- 27.69%
- DSCR
- 2.23
- GRM
- 4.7
CMA / ARV
- ARV (median comp)
- $211,846
- List price
- $85,000
- Delta
- -59.88%
- Verdict
- UNDERPRICED
- Comps
- 20 within 1.0 mi
Show comp detail 12 sales within ~0.75 mi
| Address | Dist | Beds/Ba | Sqft | Sold | Price | $/sf | Match |
|---|---|---|---|---|---|---|---|
| 309 E 1st St | 0.12mi | 3/2.0 (-1) | 1,167 (-10%) | 3mo | $185,000 | $159 | 66 |
| 415 Liza St | 0.33mi | 4/2.0 | 1,350 (+4%) | 12mo | $239,900 | $178 | 64 |
| 409 Liza St | 0.33mi | 3/2.0 (-1) | 1,310 (+1%) | 14mo | $226,000 | $173 | 63 |
| 412 Zapata St | 0.34mi | 3/2.0 (-1) | 1,390 (+7%) | 1mo | $225,000 | $162 | 62 |
| 132 E Ciro Dr | 0.67mi | 3/2.0 (-1) | 1,301 (+0%) | 7mo | $193,500 | $149 | 53 |
| 406 Zapata St | 0.31mi | 3/2.0 (-1) | 1,450 (+12%) | 8mo | $239,000 | $165 | 51 |
| 306 W 3rd St | 0.38mi | 3/2.0 (-1) | 1,134 (-13%) | 10mo | $134,900 | $119 | 44 |
| 410 W Seventh St | 0.68mi | 3/2.0 (-1) | 1,370 (+6%) | 8mo | $187,000 | $136 | 43 |
| 605 Ebony St | 0.69mi | 3/1.5 (-1) | 1,168 (-10%) | 8mo | $72,000 | $62 | 38 |
| 406 Liza St | 0.33mi | 3/2.5 (-1) | 1,490 (+15%) | 16mo | $249,999 | $168 | 36 |
| 314 E 10th St | 0.69mi | 3/2.0 (-1) | 1,424 (+10%) | 9mo | $265,000 | $186 | 36 |
| 600 Palmetto St | 0.49mi | 3/2.0 (-1) | 1,472 (+13%) | 12mo | $170,000 | $115 | 36 |
Match score weights: distance 35% · size 25% · config 20% · recency 20%. Top-matched comps best support the ARV.
Projected returns pro-forma
-3.0% appreciation · 3.0% rent growth · sell at horizon
- IRR
- 21.8%
- Equity multiple
- 1.89×
- Total profit
- $21,263
- Equity at exit
- $12,674
- IRR
- 29.9%
- Equity multiple
- 3.68×
- Total profit
- $63,784
- Equity at exit
- $7,349
Cash invested: $23,800 (down + closing). Projections, not guarantees.
Landlord ↔ Tenant lean methodology
- Overall (STATE)
- 87 Strongly Landlord-Friendly
- State Texas
- 87 Strongly Landlord-Friendly · R+5
- County
- — inherits STATE
- City
- — inherits STATE
ZIP-level market 78589
- Home prices YoY
- -12.1%
- Active inventory
- 362
- Price-to-rent
- 4.7×
Monthly cashflow live
- Estimated rent
- $1,506 high interval (Pro) →
- Mortgage (P&I)
- −$446
- Tax from tax record
- −$159 /mo · $1,910/yr
- Insurance
- −$35
- HOA
- −$0
- Vacancy / Maint / Mgmt
- −$316
- Net cashflow
- $549
Break-even live
UW: 25.0% down · 7.5% · 30yr · 1.5% tax · 5.0% vac · 8.0% maint · 8.0% mgmt
Financing live
Cash to close
- Down payment
- $21,250
- Closing costs
- $2,550
- Reserves months
- —
- Total cash needed
- —
Loan-product check · same deal, 3 products live
Conventional
25% down · 7.5% · 30yr
- Down + closing
- —
- Monthly P&I
- —
- Monthly cashflow
- —
- DSCR
- —
- Eligible?
- —
Personal DTI + credit; lowest rate.
DSCR
20% down · 8.5% · 30yr
- Down + closing
- —
- Monthly P&I
- —
- Monthly cashflow
- —
- DSCR
- —
- Eligible?
- —
No personal income docs; deal must DSCR.
Hard money
10% down · 12.0% · 12mo
- Down + closing
- —
- Monthly P&I
- —
- Monthly cashflow
- —
- DSCR
- —
- Eligible?
- —
Short-term bridge; refi at stabilization.
Rent comps 12 comps
| Address | Beds | Baths | Sqft | Rent | $/sqft | DOM | Units | Dist |
|---|---|---|---|---|---|---|---|---|
| 204 E Gomez Dr San Juan, TX | 3.0 | 1.5 | 1464 | $1,650 | $1.13 | 14d | 1 | 0.54mi |
| 311 W 8th St San Juan, TX | 3.0 | 2.0 | 1839 | $1,390 | $0.76 | 43d | 1 | 0.66mi |
| 1109 Del Monte Dr San Juan, TX | 3.0 | 2.0 | 989 | $1,300 | $1.31 | 43d | 1 | 0.74mi |
| 404 Rafael Dr Unit 4 San Juan, TX | 3.0 | 2.0 | 1044 | $1,270 | $1.22 | 23d | 1 | 0.90mi |
| 405 Rafael Dr Apt 2 San Juan, TX | 3.0 | 2.0 | 1200 | $1,250 | $1.04 | 43d | 1 | 0.94mi |
| 1709 Calle Tulipan San Juan, TX | 3.0 | 2.0 | 1841 | $1,750 | $0.95 | 43d | 1 | 1.01mi |
| 1400 State Ave San Juan, TX | 4.0 | 3.5 | 1750 | $1,950 | $1.11 | 19d | 1 | 1.10mi |
| 1306 Adela Dr San Juan, TX | 3.0 | 2.0 | 1278 | $1,500 | $1.17 | 14d | 1 | 1.14mi |
| 1410 State Ave San Juan, TX | 3.0 | 2.0 | 1000 | $1,350 | $1.35 | 43d | 1 | 1.15mi |
| 418 Chula Vista Dr San Juan, TX | 3.0 | 2.0 | 1382 | $1,600 | $1.16 | 43d | 1 | 1.20mi |
| 808 E Evans Ave Pharr, TX | 3.0 | 2.0 | 1093 | $1,400 | $1.28 | 43d | 1 | 1.32mi |
| 207 E Garfield St San Juan, TX | 4.0 | 3.0 | 1818 | $1,900 | $1.05 | 14d | 1 | 1.46mi |
Listing history 22 events
-
2026-06-18days on market $85,000 Active 150 DOM
-
2026-06-17days on market $85,000 Active 149 DOM
-
2026-06-16days on market $85,000 Active 148 DOM
-
2026-06-15days on market $85,000 Active 147 DOM
-
2026-06-14days on market $85,000 Active 145 DOM
-
2026-06-13days on market $85,000 Active 144 DOM
-
2026-06-10days on market $85,000 Active 142 DOM
-
2026-06-09days on market $85,000 Active 141 DOM
-
2026-06-08days on market $85,000 Active 140 DOM
-
2026-06-07days on market $85,000 Active 139 DOM
-
2026-06-03days on market $85,000 Active 135 DOM
-
2026-06-02days on market $85,000 Active 134 DOM
-
2026-06-01days on market $85,000 Active 133 DOM
-
2026-05-31days on market $85,000 Active 132 DOM
-
2026-05-31days on market $85,000 Active 131 DOM
-
2026-01-19$85,000 Active 480-char remark
Show marketing remark (480 chars)
This two-story home in San Juan, Texas, offers a spacious 1,299 sq. ft. living area situated on a 3,500 sq. ft. lot, conveniently located near the Basilica of San Juan. With three bedrooms and one bathroom, this property is in need of repairs but presents a fantastic opportunity for renovation and expansion. The ample space for expansion makes it an ideal investment for those looking to create their dream home or next investment venture in a prime location in San Juan, Texas.
-
2025-08-19price $90,000
-
2024-11-20$99,999 Active
-
2024-11-05price $99,999
-
2024-06-27$100,000 Active
-
2006-10-16soldstatus
-
1996-01-05soldstatus
ⓘ Source: listings_history table (triggers on properties + properties_extension) + one-shot
backfill from property_details.listing_events for pre-trigger history.
Tax reassessment forecast TX · Resets to sale price
- Current annual tax
- $1,910 · $159/mo
- Projected year-2 tax
- $1,910 · $159/mo
- Expected delta
- $0/yr ($0/mo · 0.0%)
ⓘ Screening estimate from a state-policy table — verify with the county assessor before closing.
Climate risk First Street
- Flood 6/10 Major 72% chance over 30 yrs
- Wildfire 3/10 Moderate
- Heat 9/10 Extreme 7 d/yr ≥111°F today · 23 d/yr by 30 yrs out
- Wind 8/10 Severe 99% chance of damaging wind over 30 yrs
- Air quality 3/10 Moderate 1 unhealthy d/yr today · 4 by 30 yrs out
Nearby sold comps map
Loading sold comps map…
Walkable amenities ~0.75 mi
Loading nearby amenities…
Taxation est. · year 1
- Rental income
- $18,069
- − Mortgage interest
- −$4,761
- − Property taxes
- −$1,910
- − Insurance
- −$425
- − Repairs & maintenance
- −$1,446
- − Management
- −$1,446
- − Depreciation
- −$2,473
- Taxable income
- $5,609
- Est. tax owed @ 24.0%
- −$1,346
- After-tax cash flow
- $5,245/yr
For passive investors: Depreciation is non-cash, so a rental often shows a tax loss while cash-flowing — sheltering income. Rental losses are passive: they offset passive income freely, and up to $25,000/yr can offset ordinary (W-2) income if you actively participate and your MAGI is under $100k (phasing out to $0 by $150k); unused losses carry forward. On sale, claimed depreciation is recaptured at up to 25%, and gains may owe capital-gains tax (a 1031 exchange can defer both). Figures are a year-1 estimate at your 24.0% rate — not tax advice; consult a CPA.
Schools (NCES district)
- District
- Pharr-San Juan-Alamo ISD
- NCES district ID
- 4834860
- Math proficiency
- 18% ▼ -34.00%
- Reading proficiency
- 30% ▼ -11.00%
- Median HH income
- $33,757
- Composite
- 19.63/100
- National rank
- #8744
- State rank
- #740 of 826 in TX
Livability — San Juan
- Score
- 71/100
- State rank
- #294
- US rank
- #6725
Category grades
Schools grade is shown separately in the Schools card above.
Census & demographics
- Census place
- San Juan, TX
- Population (ZIP)
- 39,958
Population outlook (Hidalgo County) Hauer SSP2
- Today (2025)
- 955,232 people
- By 2030
- 1,009,774 · +5.7%
- By 2040
- 1,120,332 · +17.3%
- By 2050
- 1,225,036 · +28.2%
- By 2075
- 1,439,189 · +50.7%
- By 2100
- 1,533,429 · +60.5%
Race, ethnicity, and origin ACS 2023
- Neighborhood character
- Predominantly Hispanic (97%)
- Race & ethnicity
- Hispanic / Latino 97% Two or more races 43% White 3%
- Hispanic origin (detail)
- Mexican 94%
- Foreign-born
- 26% · Canada
- Languages at home
- 18% English-only · Spanish 82%
Political lean MEDSL · Hidalgo
- 2024 margin
- Toss-up / Even · D 48.1% · R 51.0%
- 2008→2024 swing
- -41.6pp toward R · 2008: 38.7pp · 2024: -2.9pp
- All cycles
- 2024: R+2.9 2020: D+17.1 2016: D+40.5 2012: D+41.8 2008: D+38.7
Not yet ingested
- Civics
- —
Market trends
- HPI YoY
- ▼ -32.82%
- Current HPI
- 239.3829
- Rent YoY
- —
- Metro
- —
- State GDP YoY
- ▲ 3.95%
- F500 in state
- 110
Industry mix (Fortune 500 HQ in TX)
| Industry | F500 HQs | Revenue |
|---|---|---|
| Energy | 16 | $1,198B |
|
||
| Technology | 5 | $198B |
|
||
| Engineering / Construction | 4 | $72B |
|
||
| Energy Services | 3 | $60B |
|
||
| Utilities | 3 | $41B |
|
||
| Healthcare | 2 | $330B |
|
||
Price history
-15.0% since first listed7 events — show timeline
- 2026-01-19 Listed $85,000 MCALLENMLS
- 2025-08-19 Price Changed $90,000 MCALLENMLS
- 2024-11-20 Listed $99,999 MCALLENMLS
- 2024-11-05 Price Changed $99,999 MCALLENMLS
- 2024-06-27 Listed $100,000 MCALLENMLS
- 2006-10-16 Sold (Public Records) — Public Records
- 1996-01-05 Sold (Public Records) — Public Records
Property tax history
+5.2%/yrLatest (2025): $1,910 · +19.8% YoY. Source: county tax records.
Cash-flow waterfall
monthlySold comps — $/sqft
last 12 mo · ≤1 miLoading sold comps…