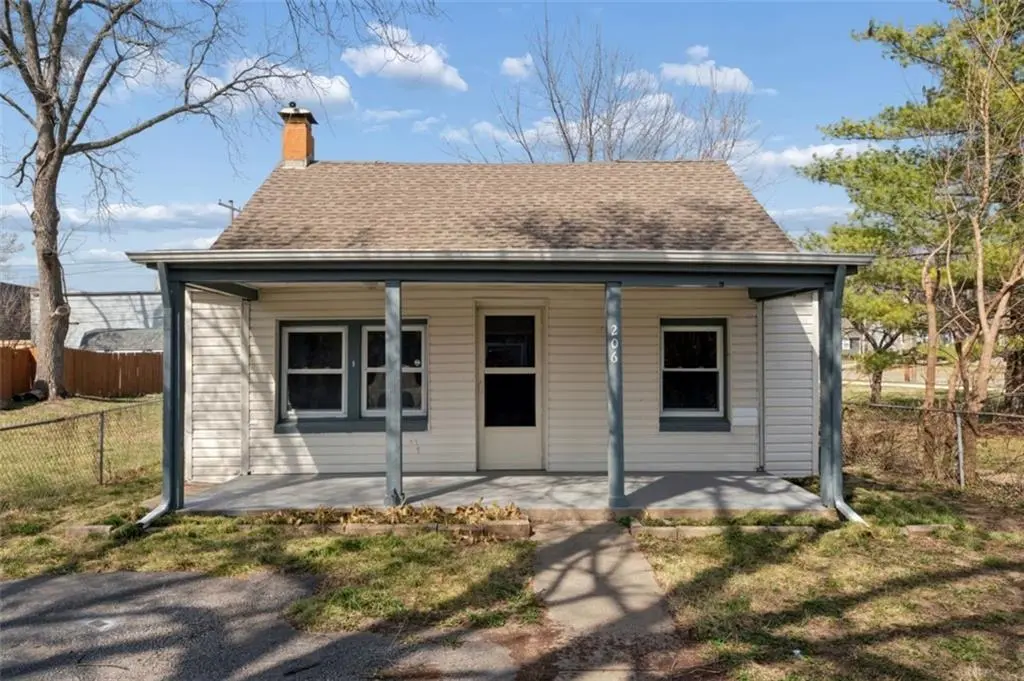
206 W 81st St · Kansas City, MO
Flood risk 3/10 · Minor
- FEMA flood zone
- X (unshaded)
- Chance of flooding over 30 yrs
- 0.2%
- Est. flood insurance / yr
- $507 – $1,088
Fire risk 1/10 · Minimal
- Est. fire insurance / yr
- $1,054 – $1,958
Heat risk 4/10 · Minor
- Hot days now (above 107°F)
- 7 days/yr
- Hot days in 30 yrs
- 17 days/yr
Wind risk 2/10 · Minimal
- Chance of severe wind over 30 yrs
- —
Air-quality risk 3/10 · Minor
- Unhealthy air days now
- 2 days/yr
- Unhealthy air days in 30 yrs
- 4 days/yr
Risk factors via First Street. Map © Google.
Why this score? — see what drove the D grade
The composite is a weighted blend of 9 inputs, each scored 0–100. Each bar is that input's sub-score; the figure is the points it added to the 100-point composite (weight × sub-score).
- ARV discount +13.3/15.0
- Cash flow +10.7/30.0
- Livability +3.9/5.0
- Rent growth +3.6/5.0
- DSCR +3.1/10.0
- Condition / age +2.5/5.0
- 1% rule +2.4/10.0
- Schools +1.5/10.0
- Appreciation +0.0/10.0
$215,000
🖨 Deal sheet 📄 Offer letter ✓ Due diligence
Listing remarks MLS
Charming and updated 3 bedroom, 2 bathroom home in the heart of Waldo! This home features a functional layout with fresh neutral finishes, updated flooring, and great natural light throughout. The kitchen offers modern cabinetry, sleek countertops, and a clean subway tile backsplash. Both bathrooms have been refreshed with contemporary finishes, including a beautifully tiled shower. Bonus sunroom provides additional living space perfect for a second living area, office, or playroom. Enjoy the covered front porch along with a manageable yard and off-street parking. Convenient location close to shopping, dining, and major highways.
Key facts
- Modern cabinetry
- Bonus sunroom
- Functional layout
Tags
Neighborhood map
What this means for you Summary
Snapshot
- This is a 2-bed/1.0-bath single-family listed at $215k.
Deal economics
- At list price, monthly cash flow is $-101 ($-1k/yr) — negative.
- To cash-flow at today's rent, offer at most $197k (8.3% below list).
- To meet the 1% rule (rent ≥ 1% of price), the offer needs to be $160k (25.8% below list).
- Recommended offer: $160k (25.8% below list) — sets the bar for 1% rule.
- Cap rate 5.7% vs local median 3.9% in Kansas City — top-decile yield for the area; either an underpriced asset or a hidden risk that comps aren't pricing in. Stress-test before assuming the spread holds.
Location & tenants
- Location reads 78/100 on livability (#28 in MO, #2,671 nationally) — a middle-class / working-renter tenant base. Strengths: amenities A+, commute A+, cost of living A+; Watch: schools C-, crime F.
- Kansas City 33 (urban): math 12% / reading 24% proficiency, ranked #308 of 324 in MO (top 95%) — low school quality limits family demand, transient renter base, plan for 1-2y turnover; 75% free/reduced lunch — lower-income household profile, screen leases tightly.
- Market conditions: Rents rising fast (+4.6%/yr); 174 active listings in the ZIP; 32 comparable units currently listed for rent nearby; rentals at typical pace (median 16d on market — plan ~3-4 weeks tenant-placement turnaround); solid renter incomes; 4,002 units permitted in Jackson County in 2024 (2,271 in 5+ unit buildings).
Forward outlook
- Local home prices are declining (-3.0%/yr); year-one equity from $1k of loan paydown is wiped out by about $6k of value loss. Plan a longer hold.
- Jackson County population projected at +4% by 2050 — modest demand growth; plan on rents tracking national, not racing it.
Negotiation context
- It's been on market 72 days — a 6% lower offer ($202k) is reasonable based on typical stale-listing flexibility.
- 3 sale attempts since 18y ago; this cycle's ask has dropped $35k (14%) from the opening price — seller is motivated, your offer sets the floor, not the list.
Risks & watch-outs
- Watch-outs: built in 1946 — expect roof / HVAC / electrical / plumbing capex.
Questions for the listing agent
- What do current leases actually rent for vs. the listed asking? Can we see a recent rent roll and the last 12 months of T-12 income?
- It's been on market 72 days. Have you received any prior offers? Is the seller open to a 26% concession, seller financing, or rate buy-down credit?
- Built in 1946 — when were the roof, HVAC, electrical panel, plumbing, and water heater last replaced?
- Why hasn't it sold? Are there any deal-killer items the seller is aware of (foundation, flood, title, zoning, code violations)?
- Is there a deadline driving the sale (1031 exchange, divorce, estate, relocation)? That informs how much negotiation room exists.
- Crime grade is F in this area — have there been break-ins, vandalism, or insurance claims at this property in the last 3 years? What carrier currently insures it and at what premium?
- The area grade is low — what's the realistic commute time and amenity access for the typical tenant pool here? Any planned neighborhood developments (good or bad) we should know about?
- What's the average days-on-market for RENTAL listings here right now (not sales)? A rising rental-DOM trend means longer vacancies and softer asking-rent achievability than the comps imply.
- What's the recent tenant-quality profile in this submarket — average credit score on applications, eviction rate, late-payment / NSF rate, and stable-employment percentage? A property-management company in the area should have these aggregated.
- How much new for-sale + rental construction is in the pipeline within 1–3 miles? Heavy new supply typically softens prices + rents 12–24 months out; constrained supply supports both.
Investment metrics
- 1% rule
- 0.74% ✗
- Cap rate
- 5.73%
- Cash-on-cash
- -2.01%
- DSCR
- 0.91
- GRM
- 11.2
CMA / ARV
- ARV (median comp)
- $246,564
- List price
- $215,000
- Delta
- -12.80%
- Verdict
- UNDERPRICED
- Comps
- 20 within 1.0 mi
Show comp detail 12 sales within ~0.75 mi
| Address | Dist | Beds/Ba | Sqft | Sold | Price | $/sf | Match |
|---|---|---|---|---|---|---|---|
| 10 W 82nd Ter | 0.22mi | 3/2.0 (+1) | 983 (-6%) | 0mo | $260,000 | $264 | 71 |
| 106 W 81st St | 0.05mi | 3/1.0 (+1) | 1,190 (+14%) | 2mo | $245,000 | $206 | 67 |
| 8006 Jarboe St | 0.57mi | 2/1.0 | 1,004 (-4%) | 1mo | $315,000 | $314 | 66 |
| 7846 Summit St | 0.44mi | 3/2.0 (+1) | 1,062 (+2%) | 3mo | $329,000 | $310 | 65 |
| 7824 Jefferson St | 0.43mi | 3/1.0 (+1) | 991 (-5%) | 2mo | $275,000 | $277 | 65 |
| 707 W 86th St | 0.73mi | 2/1.0 | 1,040 (-0%) | 1mo | $255,000 | $245 | 64 |
| 7918 Ward Parkway Plz | 0.65mi | 2/1.0 | 1,001 (-4%) | 0mo | $265,000 | $265 | 63 |
| 601 W 84th Ter | 0.51mi | 2/1.0 | 1,120 (+7%) | 2mo | $240,000 | $214 | 62 |
| 701 W 86th St | 0.71mi | 2/1.0 | 985 (-6%) | 1mo | $265,000 | $269 | 57 |
| 8020 Mercier St | 0.71mi | 3/1.0 (+1) | 1,005 (-4%) | 1mo | $229,000 | $228 | 55 |
| 7905 Belleview Ave | 0.52mi | 3/2.0 (+1) | 1,137 (+9%) | 1mo | $299,000 | $263 | 51 |
| 8357 Locust St | 0.63mi | 3/1.0 (+1) | 936 (-10%) | 0mo | $265,000 | $283 | 48 |
Match score weights: distance 35% · size 25% · config 20% · recency 20%. Top-matched comps best support the ARV.
Projected returns pro-forma
-3.0% appreciation · 4.57% rent growth · sell at horizon
- IRR
- -18.1%
- Equity multiple
- 0.36×
- Total profit
- $-38,743
- Equity at exit
- $32,057
- IRR
- -7.8%
- Equity multiple
- 0.48×
- Total profit
- $-31,361
- Equity at exit
- $18,589
Cash invested: $60,200 (down + closing). Projections, not guarantees.
Landlord ↔ Tenant lean methodology
- Overall (STATE)
- 81 Strongly Landlord-Friendly
- State Missouri
- 81 Strongly Landlord-Friendly · R+10
- County
- — inherits STATE
- City
- — inherits STATE
ZIP-level market 64114
- Rents YoY
- 4.6%
- Active inventory
- 174
- Price-to-rent
- 11.2×
Monthly cashflow live
- Estimated rent
- $1,595 high interval (Pro) →
- Mortgage (P&I)
- −$1,127
- Tax from tax record
- −$144 /mo · $1,728/yr
- Insurance
- −$90
- HOA
- −$0
- Vacancy / Maint / Mgmt
- −$335
- Net cashflow
- $-101
Break-even live
UW: 25.0% down · 7.5% · 30yr · 1.5% tax · 5.0% vac · 8.0% maint · 8.0% mgmt
Financing live
Cash to close
- Down payment
- $53,750
- Closing costs
- $6,450
- Reserves months
- —
- Total cash needed
- —
Loan-product check · same deal, 3 products live
Conventional
25% down · 7.5% · 30yr
- Down + closing
- —
- Monthly P&I
- —
- Monthly cashflow
- —
- DSCR
- —
- Eligible?
- —
Personal DTI + credit; lowest rate.
DSCR
20% down · 8.5% · 30yr
- Down + closing
- —
- Monthly P&I
- —
- Monthly cashflow
- —
- DSCR
- —
- Eligible?
- —
No personal income docs; deal must DSCR.
Hard money
10% down · 12.0% · 12mo
- Down + closing
- —
- Monthly P&I
- —
- Monthly cashflow
- —
- DSCR
- —
- Eligible?
- —
Short-term bridge; refi at stabilization.
Rent comps 32 comps
| Address | Beds | Baths | Sqft | Rent | $/sqft | DOM | Units | Dist |
|---|---|---|---|---|---|---|---|---|
| 119 W 79th Ter Kansas City, MO | 3.0 | 2.0 | 1312 | $2,205 | $1.68 | 1d | 1 | 0.14mi |
| 7919 Jefferson St Kansas City, MO | 3.0 | 1.0 | 1388 | $1,950 | $1.40 | 14d | 1 | 0.29mi |
| 8104 McGee St Kansas City, MO | 2.0 | 1.0 | 1100 | $1,350 | $1.23 | 23d | 1 | 0.33mi |
| 320 E 79th Ter Kansas City, MO | 3.0 | 1.0 | 1100 | $1,700 | $1.55 | 43d | 1 | 0.43mi |
| 8419 Pennsylvania Ave Kansas City, MO | 3.0 | 1.0 | 1200 | $1,650 | $1.38 | 14d | 1 | 0.52mi |
| 803 W 84th St Kansas City, MO | 2.0 | 1.0 | 950 | $1,095 | $1.15 | 19d | 1 | 0.56mi |
| 8410 Summit St Kansas City, MO | 2.0 | 1.0 | 768 | $1,375 | $1.79 | 16d | 1 | 0.57mi |
| 7524 Baltimore Ave Kansas City, MO | 2.0 | 1.0 | 1000 | $1,300 | $1.30 | 16d | 1 | 0.65mi |
| 7605 Locust St Kansas City, MO | 2.0 | 1.0 | 744 | $1,325 | $1.78 | 7d | 1 | 0.73mi |
| 421 W 87 Pl Kansas City, MO | 3.0 | 1.0 | 1056 | $1,195 | $1.13 | 16d | 1 | 0.77mi |
| 8700 Wornall Rd Kansas City, MO | 1.0–3.0 | 1.0 | 836 | $995 | $1.19 | 14d | 3 | 0.78mi |
| 8101 Campbell St Kansas City, MO | 2.0 | 1.0 | 820 | $888 | $1.08 | 1d | 1 | 0.80mi |
| 8704 Wornall Rd Unit B Kansas City, MO | 2.0 | 1.0 | 820 | $995 | $1.21 | 16d | 1 | 0.80mi |
| 7425 Pennsylvania Ave Kansas City, MO | 3.0 | 2.0 | 1000 | $1,695 | $1.70 | 7d | 1 | 0.81mi |
| 8150 Troost Ave Unit 53 Kansas City, MO | 2.0 | 1.0 | 900 | $1,200 | $1.33 | 43d | 1 | 0.85mi |
| 8208 Troost Ave Kansas City, MO | 1.0–2.0 | 1.0 | 761 | $1,395 | $1.83 | 7d | 2 | 0.86mi |
| 8208 Troost Ave Unit 8218-3 Kansas City, MO | 2.0 | 1.0 | 750 | $1,345 | $1.79 | 43d | 1 | 0.86mi |
| 8222 Troost Ave Unit 8222-1 Kansas City, MO | 2.0 | 1.0 | 825 | $1,400 | $1.70 | 14d | 1 | 0.90mi |
| 7610 Terrace St Kansas City, MO | 2.0 | 1.0 | 1000 | $1,525 | $1.52 | 43d | 1 | 0.91mi |
| 7544 Terrace St Unit 7544TER Kansas City, MO | 2.0 | 1.0 | 1000 | $1,525 | $1.52 | 43d | 1 | 0.94mi |
| 8701 Chestnut Cir Kansas City, MO | 1.0–2.0 | 1.0–2.0 | 925 | $1,115 | $1.21 | 1d | 15 | 0.96mi |
| 7528 Terrace St Unit 7528TER Kansas City, MO | 2.0 | 1.0 | 1000 | $1,525 | $1.52 | 43d | 1 | 0.97mi |
| 2311 W 79th St Prairie Village, KS | 2.0 | 1.0 | 1050 | $2,300 | $2.19 | 12d | 1 | 1.07mi |
| 7131 Main St Kansas City, MO | 1.0 | 1.0 | 850 | $1,250 | $1.47 | 4d | 1 | 1.15mi |
| 8660 State Line Rd Leawood, KS | 1.0–3.0 | 1.0–2.5 | 1156 | $2,530 | $2.19 | 1d | 17 | 1.17mi |
| 7543 Booth Dr Prairie Village, KS | 3.0 | 2.0 | 1360 | $2,445 | $1.80 | 23d | 1 | 1.19mi |
| 8226 Flora Ave Kansas City, MO | 2.0 | 1.0 | 862 | $1,200 | $1.39 | 3d | 1 | 1.22mi |
| 2504 W 76th St Prairie Village, KS | 3.0 | 1.0 | 950 | $1,900 | $2.00 | 17d | 1 | 1.25mi |
| 202 E Gregory Blvd Kansas City, MO | 1.0 | 1.0 | 600 | $1,149 | $1.92 | 2d | 2 | 1.26mi |
| 316 E Gregory Blvd Unit 3W Kansas City, MO | 1.0 | 1.0 | 700 | $1,149 | $1.64 | 16d | 1 | 1.27mi |
| 7632 Rainbow Dr Prairie Village, KS | 3.0 | 1.0 | 1139 | $1,900 | $1.67 | 23d | 1 | 1.31mi |
| 408 E 92nd St Kansas City, MO | 3.0 | 1.0 | 1274 | $1,595 | $1.25 | 4d | 1 | 1.46mi |
Listing history 24 events
-
2026-06-18days on market $215,000 Active 72 DOM
-
2026-06-17days on market $215,000 Active 71 DOM
-
2026-06-16days on market $215,000 Active 70 DOM
-
2026-06-15days on market $215,000 Active 69 DOM
-
2026-06-13days on market $215,000 Active 67 DOM
-
2026-06-09days on market $215,000 Active 63 DOM
-
2026-06-08days on market $215,000 Active 62 DOM
-
2026-06-07days on market $215,000 Active 61 DOM
-
2026-06-05days on market $215,000 Active 58 DOM
-
2026-06-03days on market $215,000 Active 57 DOM
-
2026-06-02days on market $215,000 Active 56 DOM
-
2026-06-01days on market $215,000 Active 55 DOM
-
2026-06-01price $215,000 Active 54 DOM
-
2026-05-31days on market $235,000 Active 54 DOM
-
2026-05-06price $235,000 637-char remark
Show marketing remark (637 chars)
Charming and updated 3 bedroom, 2 bathroom home in the heart of Waldo! This home features a functional layout with fresh neutral finishes, updated flooring, and great natural light throughout. The kitchen offers modern cabinetry, sleek countertops, and a clean subway tile backsplash. Both bathrooms have been refreshed with contemporary finishes, including a beautifully tiled shower. Bonus sunroom provides additional living space perfect for a second living area, office, or playroom. Enjoy the covered front porch along with a manageable yard and off-street parking. Convenient location close to shopping, dining, and major highways.
-
2026-04-07$249,999 Active 637-char remark
Show marketing remark (637 chars)
Charming and updated 3 bedroom, 2 bathroom home in the heart of Waldo! This home features a functional layout with fresh neutral finishes, updated flooring, and great natural light throughout. The kitchen offers modern cabinetry, sleek countertops, and a clean subway tile backsplash. Both bathrooms have been refreshed with contemporary finishes, including a beautifully tiled shower. Bonus sunroom provides additional living space perfect for a second living area, office, or playroom. Enjoy the covered front porch along with a manageable yard and off-street parking. Convenient location close to shopping, dining, and major highways.
-
2022-07-02price $1,350
-
2016-04-22soldstatus
-
2015-05-26historical
-
2015-03-23$88,000
-
2009-01-22soldstatus
-
2009-01-16soldstatus
-
2008-09-08$65,000
-
1989-09-15soldstatus
ⓘ Source: listings_history table (triggers on properties + properties_extension) + one-shot
backfill from property_details.listing_events for pre-trigger history.
Tax reassessment forecast MO · Resets to sale price
- Current annual tax
- $1,728 · $144/mo
- Projected year-2 tax
- $2,086 · $174/mo
- Expected delta
- +$357/yr (+$30/mo · 20.7%)
ⓘ Screening estimate from a state-policy table — verify with the county assessor before closing.
Climate risk First Street
- Flood 3/10 Moderate FEMA zone X (unshaded) · 20% chance over 30 yrs
- Wildfire 1/10 Low
- Heat 4/10 Moderate 7 d/yr ≥107°F today · 17 d/yr by 30 yrs out
- Wind 2/10 Low
- Air quality 3/10 Moderate 2 unhealthy d/yr today · 4 by 30 yrs out
Nearby sold comps map
Loading sold comps map…
Walkable amenities ~0.75 mi
Loading nearby amenities…
Taxation est. · year 1
- Rental income
- $19,146
- − Mortgage interest
- −$12,043
- − Property taxes
- −$1,728
- − Insurance
- −$1,075
- − Repairs & maintenance
- −$1,532
- − Management
- −$1,532
- − Depreciation
- −$6,255
- Taxable loss
- −$5,019
- Est. tax savings @ 24.0%
- +$1,205
- After-tax cash flow
- $-3/yr
For passive investors: Depreciation is non-cash, so a rental often shows a tax loss while cash-flowing — sheltering income. Rental losses are passive: they offset passive income freely, and up to $25,000/yr can offset ordinary (W-2) income if you actively participate and your MAGI is under $100k (phasing out to $0 by $150k); unused losses carry forward. On sale, claimed depreciation is recaptured at up to 25%, and gains may owe capital-gains tax (a 1031 exchange can defer both). Figures are a year-1 estimate at your 24.0% rate — not tax advice; consult a CPA.
Schools (NCES district)
- District
- Kansas City 33
- NCES district ID
- 2916400
- Math proficiency
- 12% ▼ -8.00%
- Reading proficiency
- 24% ▬ 0.00%
- Median HH income
- $35,227
- Composite
- 14.8/100
- National rank
- #9387
- State rank
- #308 of 324 in MO
Livability — Kansas City
- Score
- 78/100
- State rank
- #28
- US rank
- #2671
Category grades
Schools grade is shown separately in the Schools card above.
Census & demographics
- Census place
- Kansas City, MO
- County
- Jackson County · 687,798 people
- City population
- 439,467
- Metro
- Kansas City, MO-KS
- Population (ZIP)
- 24,229
- Household income
- $81,275
- Rent vs Own
- Severe rent burden
- 851.0
Population outlook (Jackson County) Hauer SSP2
- Today (2025)
- 719,589 people
- By 2030
- 731,456 · +1.6%
- By 2040
- 746,689 · +3.8%
- By 2050
- 749,289 · +4.1%
- By 2075
- 736,227 · +2.3%
- By 2100
- 668,210 · -7.1%
Race, ethnicity, and origin ACS 2023
- Neighborhood character
- Predominantly White (75%)
- Race & ethnicity
- White 75% Black 11% Two or more races 8% Hispanic / Latino 7% Asian 3%
- Hispanic origin (detail)
- Mexican 5%
- Common ancestry
- Lithuanian 3% Italian 3% Romanian 2%
- Foreign-born
- 4% · Canada
- Languages at home
- 93% English-only · Spanish 3% Other Indo-European 2%
Political lean MEDSL · Jackson
- 2024 margin
- D (+19.3) · D 58.9% · R 39.5% · Other 1.6%
- 2008→2024 swing
- -6.1pp toward R · 2008: 25.4pp · 2024: 19.3pp
- All cycles
- 2024: D+19.3 2020: D+22.0 2016: D+16.6 2012: D+19.0 2008: D+25.4
Not yet ingested
- Civics
- —
Market trends
- HPI YoY
- ▼ -311.24%
- Current HPI
- 280.5587
- Rent YoY
- ▲ 4.57%
- Metro
- Kansas City, MO-KS
- State GDP YoY
- ▲ 1.84%
- F500 in state
- 20
Industry mix (Fortune 500 HQ in MO)
| Industry | F500 HQs | Revenue |
|---|---|---|
| Healthcare | 1 | $163B |
|
||
| Insurance | 1 | $21B |
|
||
| Industrial Technology | 1 | $17B |
|
||
| Retail | 1 | $16B |
|
||
| Industrial Distribution | 1 | $10B |
|
||
| Utilities | 1 | $9B |
|
||
Price history
+261.5% since first listed10 events — show timeline
- 2026-05-06 Price Changed $235,000 Heartland MLS as Distributed by MLS Grid
- 2026-04-07 Listed $249,999 Heartland MLS as Distributed by MLS Grid
- 2022-07-02 Price Changed $1,350 RENT.
- 2016-04-22 Sold (Public Records) — Public Records
- 2015-05-26 Listing Removed — Heartland MLS as Distributed by MLS Grid
- 2015-03-23 Listed $88,000 Heartland MLS as Distributed by MLS Grid
- 2009-01-22 Sold (Public Records) — Public Records
- 2009-01-16 Sold (MLS) — Heartland MLS as Distributed by MLS Grid
- 2008-09-08 Listed $65,000 Heartland MLS as Distributed by MLS Grid
- 1989-09-15 Sold (Public Records) — Public Records
Property tax history
+6.9%/yrLatest (2025): $1,728 · -12.4% YoY. Source: county tax records.
Cash-flow waterfall
monthlySold comps — $/sqft
last 12 mo · ≤1 miLoading sold comps…