335 5th St NE · Fayette, AL
Flood risk 1/10 · Minimal
- FEMA flood zone
- X (unshaded)
- Chance of flooding over 30 yrs
- 0.0%
- Est. flood insurance / yr
- $473 – $860
Fire risk 3/10 · Minor
- Est. fire insurance / yr
- $916 – $1,700
Heat risk 6/10 · Moderate
- Hot days now (above 108°F)
- 7 days/yr
- Hot days in 30 yrs
- 19 days/yr
Wind risk 6/10 · Moderate
- Chance of severe wind over 30 yrs
- 27.0%
Air-quality risk 2/10 · Minimal
- Unhealthy air days now
- 1 days/yr
- Unhealthy air days in 30 yrs
- 2 days/yr
Risk factors via First Street. Map © Google.
Why this score? — see what drove the B+ grade
The composite is a weighted blend of 9 inputs, each scored 0–100. Each bar is that input's sub-score; the figure is the points it added to the 100-point composite (weight × sub-score).
- Cash flow +30.0/30.0
- ARV discount +15.0/15.0
- 1% rule +10.0/10.0
- DSCR +10.0/10.0
- Livability +3.2/5.0
- Rent growth +2.5/5.0
- Schools +2.5/10.0
- Condition / age +2.5/5.0
- Appreciation +0.0/10.0
$52,000
🖨 Deal sheet 📄 Offer letter ✓ Due diligence
Listing remarks MLS
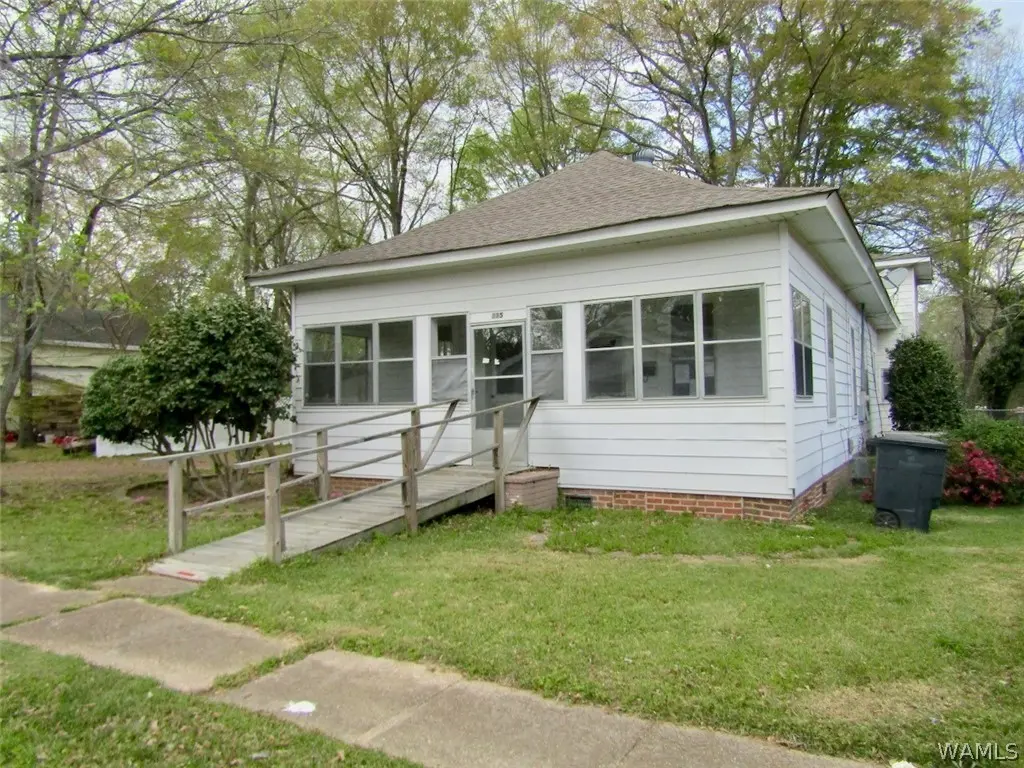
This roomy 4-bedroom, 2-full bathroom home has an enclosed porch, storage shed, and some wooded privacy. Inside, there is hardwood flooring, a formal dining room, and more. The kitchen has ample cabinets and counter space, and the home offers lots of room for extra storage. The basement offers additional rooms and storage. Right of redemption may apply. Case 011-691377. Property is Owned by the US Dept. of HUD. Insurability is "UI", Subject to Appraisal. The seller makes no representations or warranties as to the property condition. HUD Homes are sold “As-Is”. Equal Housing Opportunity. The seller may contribute up to 3% for buyer’s closing costs, upon buyer request. Lead-based paint notices to be included in the contract. Contact your agent today to schedule a showing.
Key facts
- Hardwood flooring
- Ample cabinets
- Wooded privacy
Tags
Neighborhood map
What this means for you Summary
Snapshot
- This is a 4-bed/2.0-bath single-family listed at $52k.
Deal economics
- At list price, monthly cash flow is $771 ($9k/yr) — positive.
- The deal already cash-flows at list — no discount required.
- Meets the 1% rule at list price ($1k rent vs $52k).
- Recommended offer: $49k (6.0% below list) — sets the bar for market timing.
- Cap rate 24.1% vs local median 6.0% in Fayette — top-decile yield for the area; either an underpriced asset or a hidden risk that comps aren't pricing in. Stress-test before assuming the spread holds.
Location & tenants
- Location reads 64/100 on livability (#158 in AL) — a middle-class / working-renter tenant base. Strengths: cost of living A+, housing A+, crime A-; Watch: schools D, health & safety D, amenities F.
- Fayette County (rural): math 17% / reading 44% proficiency, ranked #71 of 129 in AL (top 55%) — families likely to look elsewhere, expect single-tenant / working-renter base with shorter leases.
- Market conditions: 61 active listings in the ZIP.
Forward outlook
- Local home prices are declining (-3.0%/yr); year-one equity from $360 of loan paydown is wiped out by about $2k of value loss. Plan a longer hold.
- Fayette County population projected at -21% by 2050 — secular population decline; favor cash flow + early exit over multi-decade hold.
- At projected returns (-3.0% appreciation + 3.0% rent growth), your $15k cash investment doubles in ~2 years — after that, you're playing with house money.
Negotiation context
- It's been on market 66 days — a 6% lower offer ($49k) is reasonable based on typical stale-listing flexibility.
Risks & watch-outs
- Watch-outs: built in 1920 — expect roof / HVAC / electrical / plumbing capex.
- Climate carrying-cost: major wind risk, 27% chance of damaging wind over 30y; extreme-heat days projected 7→19/yr by 2055 (HVAC capex compounding) — expect insurance premiums to compound above CPI over the hold.
Questions for the listing agent
- It's been on market 66 days. Have you received any prior offers? Is the seller open to a 6% concession, seller financing, or rate buy-down credit?
- Built in 1920 — when were the roof, HVAC, electrical panel, plumbing, and water heater last replaced?
- Why hasn't it sold? Are there any deal-killer items the seller is aware of (foundation, flood, title, zoning, code violations)?
- Is there a deadline driving the sale (1031 exchange, divorce, estate, relocation)? That informs how much negotiation room exists.
- Schools are D-rated, which usually means shorter tenancies and higher turnover. Who's the typical renter profile here, and what's been the actual vacancy rate?
- What's the average days-on-market for RENTAL listings here right now (not sales)? A rising rental-DOM trend means longer vacancies and softer asking-rent achievability than the comps imply.
- What's the recent tenant-quality profile in this submarket — average credit score on applications, eviction rate, late-payment / NSF rate, and stable-employment percentage? A property-management company in the area should have these aggregated.
- How much new for-sale + rental construction is in the pipeline within 1–3 miles? Heavy new supply typically softens prices + rents 12–24 months out; constrained supply supports both.
Investment metrics
- 1% rule
- 2.73% ✓
- Cap rate
- 24.08%
- Cash-on-cash
- 63.54%
- DSCR
- 3.83
- GRM
- 3.1
CMA / ARV
- ARV (median comp)
- $99,561
- List price
- $52,000
- Delta
- -47.77%
- Verdict
- UNDERPRICED
- Comps
- 20 within 1.0 mi
Show comp detail 7 sales within ~0.75 mi
| Address | Dist | Beds/Ba | Sqft | Sold | Price | $/sf | Match |
|---|---|---|---|---|---|---|---|
| 626 3rd Ave Way NE | 0.08mi | 3/1.0 (-1) | 1,976 (+2%) | 8mo | $25,000 | $13 | 76 |
| 316 2nd Ave NW | 0.39mi | 4/2.0 | 2,032 (+5%) | 5mo | $46,000 | $23 | 69 |
| 231 6th St NW | 0.32mi | 4/2.0 | 1,740 (-10%) | 5mo | $15,000 | $9 | 65 |
| 308 Columbus St | 0.56mi | 4/2.0 | 1,796 (-7%) | 6mo | $89,900 | $50 | 57 |
| 525 Temple Ave N | 0.23mi | 3/2.0 (-1) | 1,804 (-6%) | 21mo | $170,000 | $94 | 56 |
| 424 2nd Ave SE | 0.67mi | 3/2.0 (-1) | 2,076 (+8%) | 7mo | $28,400 | $14 | 45 |
| 221 3rd Ct SW | 0.69mi | 3/1.0 (-1) | 1,777 (-8%) | 10mo | $118,000 | $66 | 37 |
Match score weights: distance 35% · size 25% · config 20% · recency 20%. Top-matched comps best support the ARV.
Projected returns pro-forma
-3.0% appreciation · 3.0% rent growth · sell at horizon
- IRR
- 62.6%
- Equity multiple
- 3.79×
- Total profit
- $40,692
- Equity at exit
- $7,753
- IRR
- 67.1%
- Equity multiple
- 7.78×
- Total profit
- $98,725
- Equity at exit
- $4,496
Cash invested: $14,560 (down + closing). Projections, not guarantees.
Landlord ↔ Tenant lean methodology
- Overall (STATE)
- 90 Strongly Landlord-Friendly
- State Alabama
- 90 Strongly Landlord-Friendly · R+15
- County
- — inherits STATE
- City
- — inherits STATE
ZIP-level market 35555
- Home prices YoY
- -18.1%
- Active inventory
- 61
- Price-to-rent
- 3.1×
Monthly cashflow live
- Estimated rent
- $1,419 medium interval (Pro) →
- Mortgage (P&I)
- −$273
- Tax from tax record
- −$56 /mo · $669/yr
- Insurance
- −$22
- HOA
- −$0
- Vacancy / Maint / Mgmt
- −$298
- Net cashflow
- $771
Break-even live
UW: 25.0% down · 7.5% · 30yr · 1.5% tax · 5.0% vac · 8.0% maint · 8.0% mgmt
Financing live
Cash to close
- Down payment
- $13,000
- Closing costs
- $1,560
- Reserves months
- —
- Total cash needed
- —
Loan-product check · same deal, 3 products live
Conventional
25% down · 7.5% · 30yr
- Down + closing
- —
- Monthly P&I
- —
- Monthly cashflow
- —
- DSCR
- —
- Eligible?
- —
Personal DTI + credit; lowest rate.
DSCR
20% down · 8.5% · 30yr
- Down + closing
- —
- Monthly P&I
- —
- Monthly cashflow
- —
- DSCR
- —
- Eligible?
- —
No personal income docs; deal must DSCR.
Hard money
10% down · 12.0% · 12mo
- Down + closing
- —
- Monthly P&I
- —
- Monthly cashflow
- —
- DSCR
- —
- Eligible?
- —
Short-term bridge; refi at stabilization.
Listing history 18 events
-
2026-06-19days on market $52,000 Active 66 DOM
-
2026-06-18days on market $52,000 Active 65 DOM
-
2026-06-17days on market $52,000 Active 64 DOM
-
2026-06-16days on market $52,000 Active 63 DOM
-
2026-06-15days on market $52,000 Active 62 DOM
-
2026-06-14days on market $52,000 Active 60 DOM
-
2026-06-12days on market $52,000 Active 59 DOM
-
2026-06-09days on market $52,000 Active 56 DOM
-
2026-06-08days on market $52,000 Active 55 DOM
-
2026-06-07days on market $52,000 Active 54 DOM
-
2026-06-07days on market $52,000 Active 53 DOM
-
2026-06-04days on market $52,000 Active 50 DOM
-
2026-06-02pricedays on market $52,000 Active 49 DOM
-
2026-06-01days on market $69,000 Active 48 DOM
-
2026-05-31days on market $69,000 Active 47 DOM
-
2026-05-31days on market $69,000 Active 46 DOM
-
2026-04-14$69,000 Active 809-char remark
Show marketing remark (809 chars)
This roomy 4-bedroom, 2-full bathroom home has an enclosed porch, storage shed, and some wooded privacy. Inside, there is hardwood flooring, a formal dining room, and more. The kitchen has ample cabinets and counter space, and the home offers lots of room for extra storage. The basement offers additional rooms and storage. Right of redemption may apply. Case 011-691377. Property is Owned by the US Dept. of HUD. Insurability is "UI", Subject to Appraisal. The seller makes no representations or warranties as to the property condition. HUD Homes are sold “As-Is”. Equal Housing Opportunity. The seller may contribute up to 3% for buyer’s closing costs, upon buyer request. Lead-based paint notices to be included in the contract. Contact your agent today to schedule a showing.
-
2026-03-18soldstatus $73,030
ⓘ Source: listings_history table (triggers on properties + properties_extension) + one-shot
backfill from property_details.listing_events for pre-trigger history.
Tax reassessment forecast AL · Resets to sale price
- Current annual tax
- $669 · $56/mo
- Projected year-2 tax
- $669 · $56/mo
- Expected delta
- $0/yr ($0/mo · 0.0%)
ⓘ Screening estimate from a state-policy table — verify with the county assessor before closing.
Climate risk First Street
- Flood 1/10 Low FEMA zone X (unshaded) · 0% chance over 30 yrs
- Wildfire 3/10 Moderate
- Heat 6/10 Major 7 d/yr ≥108°F today · 19 d/yr by 30 yrs out
- Wind 6/10 Major 27% chance of damaging wind over 30 yrs
- Air quality 2/10 Low 1 unhealthy d/yr today · 2 by 30 yrs out
Nearby sold comps map
Loading sold comps map…
Walkable amenities ~0.75 mi
Loading nearby amenities…
Taxation est. · year 1
- Rental income
- $17,029
- − Mortgage interest
- −$2,913
- − Property taxes
- −$669
- − Insurance
- −$260
- − Repairs & maintenance
- −$1,362
- − Management
- −$1,362
- − Depreciation
- −$1,513
- Taxable income
- $8,950
- Est. tax owed @ 24.0%
- −$2,148
- After-tax cash flow
- $7,104/yr
For passive investors: Depreciation is non-cash, so a rental often shows a tax loss while cash-flowing — sheltering income. Rental losses are passive: they offset passive income freely, and up to $25,000/yr can offset ordinary (W-2) income if you actively participate and your MAGI is under $100k (phasing out to $0 by $150k); unused losses carry forward. On sale, claimed depreciation is recaptured at up to 25%, and gains may owe capital-gains tax (a 1031 exchange can defer both). Figures are a year-1 estimate at your 24.0% rate — not tax advice; consult a CPA.
Schools (NCES district)
- District
- Fayette County
- NCES district ID
- 0101470
- Math proficiency
- 17% ▼ -25.00%
- Reading proficiency
- 44% ▼ -1.00%
- Median HH income
- $34,767
- Composite
- 25.06/100
- National rank
- #7540
- State rank
- #71 of 129 in AL
Livability — Fayette
- Score
- 64/100
- State rank
- #158
- US rank
- #14298
Category grades
Schools grade is shown separately in the Schools card above.
Census & demographics
- Census place
- Fayette, AL
- Population (ZIP)
- 9,689
Population outlook (Fayette County) Hauer SSP2
- Today (2025)
- 15,631 people
- By 2030
- 14,975 · -4.2%
- By 2040
- 13,604 · -13.0%
- By 2050
- 12,302 · -21.3%
- By 2075
- 9,599 · -38.6%
- By 2100
- 7,282 · -53.4%
Race, ethnicity, and origin ACS 2023
- Neighborhood character
- Predominantly White (78%)
- Race & ethnicity
- White 78% Black 19% Two or more races 3%
- Common ancestry
- Slovak 1% Italian 1% Lithuanian 1%
- Foreign-born
- 1% · Canada
Political lean MEDSL · Fayette
- 2024 margin
- Solid R (+72.0) · D 13.7% · R 85.7%
- 2008→2024 swing
- -23.1pp toward R · 2008: -48.9pp · 2024: -72.0pp
- All cycles
- 2024: R+72.0 2020: R+67.4 2016: R+65.2 2012: R+53.5 2008: R+48.9
Not yet ingested
- Civics
- —
Market trends
- HPI YoY
- ▼ -42.04%
- Current HPI
- 190.5031
- Rent YoY
- —
- Metro
- —
- State GDP YoY
- ▲ 2.94%
- F500 in state
- 4
Industry mix (Fortune 500 HQ in AL)
| Industry | F500 HQs | Revenue |
|---|---|---|
| Financial Services | 1 | $8B |
|
||
| Healthcare | 1 | $5B |
|
||
Price history
-5.5% since first listed2 events — show timeline
- 2026-04-14 Listed $69,000 WAMLS
- 2026-03-18 Sold (Public Records) $73,030 Public Records
Property tax history
+14.1%/yrLatest (2025): $669 · +0.0% YoY. Source: county tax records.
Cash-flow waterfall
monthlySold comps — $/sqft
last 12 mo · ≤1 miLoading sold comps…