 Multi-family
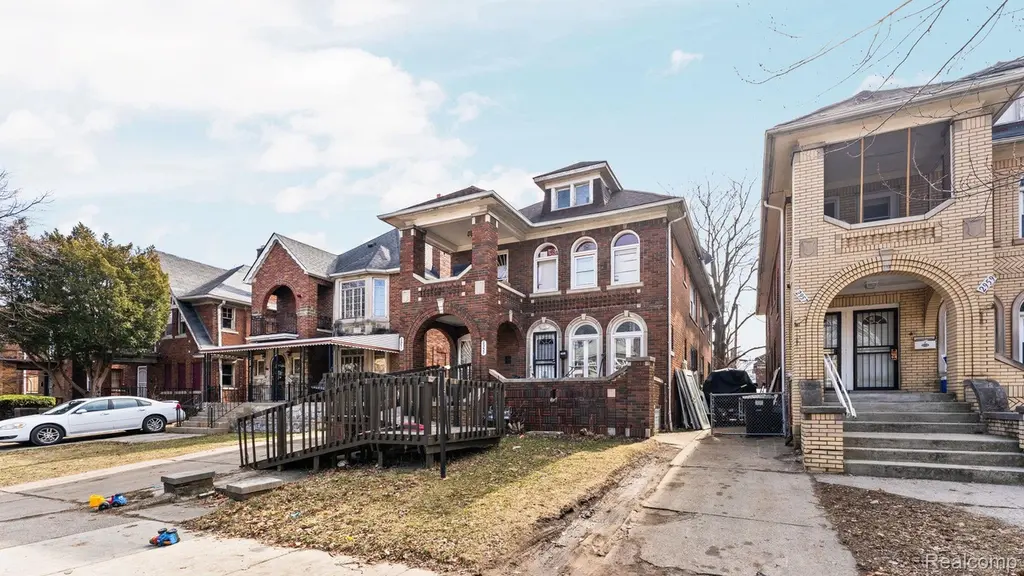
2951 Leslie St · Detroit, MI
Flood risk 1/10 · Minimal
- FEMA flood zone
- X (unshaded)
- Chance of flooding over 30 yrs
- 0.0%
- Est. flood insurance / yr
- $473 – $860
Fire risk 1/10 · Minimal
- Est. fire insurance / yr
- $784 – $1,456
Heat risk 3/10 · Minor
- Hot days now (above 97°F)
- 7 days/yr
- Hot days in 30 yrs
- 15 days/yr
Wind risk 2/10 · Minimal
- Chance of severe wind over 30 yrs
- —
Air-quality risk 4/10 · Minor
- Unhealthy air days now
- 4 days/yr
- Unhealthy air days in 30 yrs
- 6 days/yr
Risk factors via First Street. Map © Google.
Why this score? — see what drove the C+ grade
The composite is a weighted blend of 9 inputs, each scored 0–100. Each bar is that input's sub-score; the figure is the points it added to the 100-point composite (weight × sub-score).
- Cash flow +26.3/30.0
- ARV discount +11.4/15.0
- DSCR +9.0/10.0
- 1% rule +7.0/10.0
- Rent growth +4.0/5.0
- Livability +3.7/5.0
- Schools +1.3/10.0
- Condition / age +1.0/5.0
- Appreciation +0.0/10.0
$175,000
🖨 Deal sheet (PDF) 📄 Offer letter ✓ Due diligence
Multi-family units
County records classify this as Multi-Family (2-4 Unit). Listing-text estimate: 1 unit. estimate disagrees with records
Listing remarks MLS
Prime multifamily investment opportunity located in Detroit’s historic and rapidly stabilizing Dexter Linwood neighborhood, an area rich in cultural history, architectural character, and now experiencing a meaningful wave of reinvestment. This classic brick multifamily property offers spacious units, strong rental demand, and significant upside as surrounding development continues to gain momentum. Known for its early 20th century duplexes and apartment buildings, Dexter Linwood has long been a hub of Detroit’s residential density and community life. Today, that legacy housing stock is being revitalized through both public initiatives and private investment, making it an increasingly attractive target for investors seeking value and appreciation. A transformative investment is bringing new retail pop-ups, facade improvements, public art, and a redesigned streetscape to nearby Dexter Avenue, enhancing walkability and economic activity. Property is 1 of 11 in a portfolio being sold all within the Downtown Area. Buy 1 or as many as you would like. MLS#s for the other 10 properties: 20261015005, 20261015035, 20261015052, 20261015057, 20261015576, 20261015577, 20261015578, 20261015583, 20261015586, 20261015683
Key facts
- Strong rental demand
- Private investment
- Public initiatives
Tags
Neighborhood map
What this means for you Summary
Snapshot
- This is a 6-bed/2.0-bath multifamily listed at $175k. Condition is rated poor.
Deal economics
- At list price, monthly cash flow is $454 ($5k/yr) — positive.
- The deal already cash-flows at list — no discount required.
- Meets the 1% rule at list price ($2k rent vs $175k).
- Recommended offer: $164k (6.0% below list) — sets the bar for market timing.
Location & tenants
- Location reads 73/100 on livability (#218 in MI) — a middle-class / working-renter tenant base. Strengths: amenities A+, commute A+, cost of living A+; Watch: crime F, employment F.
- Detroit Public Schools Community District (urban): math 10% / reading 24% proficiency, ranked #499 of 540 in MI (top 92%) — low school quality limits family demand, transient renter base, plan for 1-2y turnover; 90% free/reduced lunch — lower-income household profile, screen leases tightly.
- Zoned schools: Durfee Elementarymiddle School (593 students, 91% FRL); Central High School (math 24% / reading 24%, grade F, #481 of 713 statewide, top 81%, 353 students, 89% FRL) — zoned schools at 90% FRL track the district average.
- Market conditions: Rents rising fast (+6.1%/yr); 350 active listings in the ZIP; 4 comparable units currently listed for rent nearby; rentals at typical pace (median 17d on market — plan ~3-4 weeks tenant-placement turnaround); lower-income renter base — watch delinquency; 2,639 units permitted in Wayne County in 2024 (1,216 in 5+ unit buildings).
- At $2,106/mo this rent would consume 76% of the median local household income ($33k/yr) (locally 2172% of renters already pay >50% of income on rent) — very limited rent-growth headroom before tenants either downsize or default.
Forward outlook
- Local home prices are declining (-3.0%/yr); year-one equity from $1k of loan paydown is wiped out by about $5k of value loss. Plan a longer hold.
- Wayne County population projected at -17% by 2050 — secular population decline; favor cash flow + early exit over multi-decade hold.
- At projected returns (-3.0% appreciation + 6.1% rent growth), your $49k cash investment doubles in ~8 years — after that, you're playing with house money.
Negotiation context
- It's been on market 67 days — a 6% lower offer ($164k) is reasonable based on typical stale-listing flexibility.
- 9 sale attempts since 12y ago; this cycle's ask has dropped $25k (12%) from the opening price — seller is motivated, your offer sets the floor, not the list.
Risks & watch-outs
- Watch-outs: built in 1926 — expect roof / HVAC / electrical / plumbing capex.
Questions for the listing agent
- It's been on market 67 days. Have you received any prior offers? Is the seller open to a 6% concession, seller financing, or rate buy-down credit?
- Have any recent inspections been done? Can we get a copy of the seller's disclosures and any deferred-maintenance estimates?
- Built in 1926 — when were the roof, HVAC, electrical panel, plumbing, and water heater last replaced?
- Why hasn't it sold? Are there any deal-killer items the seller is aware of (foundation, flood, title, zoning, code violations)?
- Is there a deadline driving the sale (1031 exchange, divorce, estate, relocation)? That informs how much negotiation room exists.
- Schools are F-rated, which usually means shorter tenancies and higher turnover. Who's the typical renter profile here, and what's been the actual vacancy rate?
- Crime grade is F in this area — have there been break-ins, vandalism, or insurance claims at this property in the last 3 years? What carrier currently insures it and at what premium?
- What's the average days-on-market for RENTAL listings here right now (not sales)? A rising rental-DOM trend means longer vacancies and softer asking-rent achievability than the comps imply.
- What's the recent tenant-quality profile in this submarket — average credit score on applications, eviction rate, late-payment / NSF rate, and stable-employment percentage? A property-management company in the area should have these aggregated.
- How much new apartment / multifamily construction is in the pipeline within 1–3 miles? Heavy new supply (>2% of stock underway) typically softens rents 12–24 months out; light construction supports rent growth.
Investment metrics
- 1% rule
- 1.20% ✓
- Cap rate
- 9.41%
- Cash-on-cash
- 11.13%
- DSCR
- 1.50
- GRM
- 6.9
CMA / ARV
- ARV (median comp)
- $191,528
- List price
- $175,000
- Delta
- -8.63%
- Verdict
- FAIR
- Comps
- 20 within 1.0 mi
Show comp detail 12 sales within ~0.75 mi
| Address | Dist | Beds/Ba | Sqft | Sold | Price | $/sf | Match |
|---|---|---|---|---|---|---|---|
| 3230 Fullerton St | 0.15mi | 6/2.0 | 2,950 (+5%) | 3mo | $65,000 | $22 | 82 |
| 2716 Elmhurst St | 0.35mi | 6/2.0 | 2,750 (-2%) | 1mo | $225,000 | $82 | 80 |
| 2952 Elmhurst St | 0.35mi | 6/2.5 | 2,950 (+5%) | 2mo | $65,000 | $22 | 71 |
| 3740 Tyler St | 0.41mi | 6/2.0 | 2,600 (-7%) | 2mo | $159,500 | $61 | 68 |
| 3729 W Grand St | 0.53mi | 6/2.0 | 2,704 (-3%) | 3mo | $120,000 | $44 | 67 |
| 3741 Tyler St | 0.40mi | 6/2.5 | 2,600 (-7%) | 2mo | $15,000 | $6 | 66 |
| 4002 W Buena Vista St | 0.48mi | 6/2.0 | 3,007 (+7%) | 1mo | $179,000 | $60 | 64 |
| 2936 W Grand St | 0.44mi | 6/2.0 | 2,600 (-7%) | 4mo | $30,000 | $12 | 64 |
| 3782 Tyler St | 0.44mi | 6/2.0 | 2,600 (-7%) | 4mo | $97,500 | $38 | 64 |
| 4088 Tyler St | 0.58mi | 6/3.0 | 2,690 (-4%) | 1mo | $83,600 | $31 | 61 |
| 2931 Tuxedo St | 0.44mi | 6/2.0 | 2,510 (-10%) | 3mo | $50,000 | $20 | 60 |
| 4324 W Buena Vista St | 0.70mi | 6/3.0 | 2,700 (-4%) | 1mo | $148,000 | $55 | 57 |
Match score weights: distance 35% · size 25% · config 20% · recency 20%. Top-matched comps best support the ARV.
Projected returns pro-forma
-3.0% appreciation · 6.14% rent growth · sell at horizon
- IRR
- 3.8%
- Equity multiple
- 1.15×
- Total profit
- $7,484
- Equity at exit
- $26,093
- IRR
- 16.1%
- Equity multiple
- 2.51×
- Total profit
- $73,959
- Equity at exit
- $15,131
Cash invested: $49,000 (down + closing). Projections, not guarantees.
Landlord ↔ Tenant lean methodology
- Overall (STATE)
- 62 Landlord-Friendly
- State Michigan
- 62 Landlord-Friendly · EVEN
- County
- — inherits STATE
- City
- — inherits STATE
ZIP-level market 48238
- Home prices YoY
- -14.4%
- Rents YoY
- 6.1%
- Active inventory
- 350
- Price-to-rent
- 6.9×
Monthly cashflow live
- Estimated rent
- $2,106 medium interval (Pro) →
- Mortgage (P&I)
- −$918
- Tax est. 1.5%
- −$219 /mo · $2,625/yr
- Insurance
- −$73
- HOA
- −$0
- Vacancy / Maint / Mgmt
- −$442
- Net cashflow
- $454
Break-even live
Sensitivity live
| Price | -10% $575 | -5% $515 | +0% $454 | +5% $394 | +10% $334 |
|---|---|---|---|---|---|
| Rent | -10% $288 | -5% $371 | +0% $454 | +5% $538 | +10% $621 |
| Rate | -1.0pp $543 | -0.5pp $499 | base $454 | +0.5pp $409 | +1.0pp $363 |
UW: 25.0% down · 7.5% · 30yr · 1.5% tax · 5.0% vac · 8.0% maint · 8.0% mgmt
Financing live
Cash to close
- Down payment
- $43,750
- Closing costs
- $5,250
- Reserves months
- —
- Total cash needed
- —
Loan-product check · same deal, 3 products live
Conventional
25% down · 7.5% · 30yr
- Down + closing
- —
- Monthly P&I
- —
- Monthly cashflow
- —
- DSCR
- —
- Eligible?
- —
Personal DTI + credit; lowest rate.
DSCR
20% down · 8.5% · 30yr
- Down + closing
- —
- Monthly P&I
- —
- Monthly cashflow
- —
- DSCR
- —
- Eligible?
- —
No personal income docs; deal must DSCR.
Hard money
10% down · 12.0% · 12mo
- Down + closing
- —
- Monthly P&I
- —
- Monthly cashflow
- —
- DSCR
- —
- Eligible?
- —
Short-term bridge; refi at stabilization.
Rent comps 4 comps
| Address | Beds | Baths | Sqft | Rent | $/sqft | DOM | Units | Dist |
|---|---|---|---|---|---|---|---|---|
| 13225 Santa Rosa Dr Detroit, MI | 5.0 | 2.0 | 2100 | $1,700 | $0.81 | 7d | 1 | 0.98mi |
| 1699 Glynn Ct Detroit, MI | 5.0 | 3.5 | 2542 | $2,500 | $0.98 | 24d | 1 | 1.14mi |
| 8951 La Salle Blvd Detroit, MI | 5.0 | 2.5 | 2440 | $2,500 | $1.02 | 17d | 1 | 1.37mi |
| 2509 Gladstone St Unit NA Detroit, MI | 6.0 | 3.0 | 3008 | $2,000 | $0.66 | 12d | 1 | 1.48mi |
Listing history 29 events
-
2026-06-21days on market $175,000 Active 67 DOM
-
2026-06-18days on market $175,000 Active 64 DOM
-
2026-06-17days on market $175,000 Active 63 DOM
-
2026-06-15days on market $175,000 Active 61 DOM
-
2026-06-13days on market $175,000 Active 59 DOM
-
2026-06-13days on market $175,000 Active 58 DOM
-
2026-06-09days on market $175,000 Active 55 DOM
-
2026-06-08days on market $175,000 Active 54 DOM
-
2026-06-07days on market $175,000 Active 53 DOM
-
2026-06-04days on market $175,000 Active 50 DOM
-
2026-06-03days on market $175,000 Active 49 DOM
-
2026-06-02days on market $175,000 Active 48 DOM
-
2026-06-01days on market $175,000 Active 47 DOM
-
2026-05-31days on market $175,000 Active 46 DOM
-
2026-04-15$200,000 Active 1236-char remark
Show marketing remark (1224 chars)
Prime multifamily investment opportunity located in Detroit's historic and rapidly stabilizing Dexter Linwood neighborhood, an area rich in cultural history, architectural character, and now experiencing a meaningful wave of reinvestment. This classic brick multifamily property offers spacious units, strong rental demand, and significant upside as surrounding development continues to gain momentum. Known for its early 20th century duplexes and apartment buildings, Dexter Linwood has long been a hub of Detroit's residential density and community life. Today, that legacy housing stock is being revitalized through both public initiatives and private investment, making it an increasingly attractive target for investors seeking value and appreciation. A transformative investment is bringing new retail pop-ups, facade improvements, public art, and a redesigned streetscape to nearby Dexter Avenue, enhancing walkability and economic activity. Property is 1 of 11 in a portfolio being sold all within the Downtown Area. Buy 1 or as many as you would like. MLS#s for the other 10 properties: 20261015005, 20261015035, 20261015052, 20261015057, 20261015576, 20261015577, 20261015578, 20261015583, 20261015586, 20261015683
-
2026-04-15$200,000 Active 1224-char remark
Show marketing remark (1224 chars)
Prime multifamily investment opportunity located in Detroit's historic and rapidly stabilizing Dexter Linwood neighborhood, an area rich in cultural history, architectural character, and now experiencing a meaningful wave of reinvestment. This classic brick multifamily property offers spacious units, strong rental demand, and significant upside as surrounding development continues to gain momentum. Known for its early 20th century duplexes and apartment buildings, Dexter Linwood has long been a hub of Detroit's residential density and community life. Today, that legacy housing stock is being revitalized through both public initiatives and private investment, making it an increasingly attractive target for investors seeking value and appreciation. A transformative investment is bringing new retail pop-ups, facade improvements, public art, and a redesigned streetscape to nearby Dexter Avenue, enhancing walkability and economic activity. Property is 1 of 11 in a portfolio being sold all within the Downtown Area. Buy 1 or as many as you would like. MLS#s for the other 10 properties: 20261015005, 20261015035, 20261015052, 20261015057, 20261015576, 20261015577, 20261015578, 20261015583, 20261015586, 20261015683
-
2026-03-17$200,000 Active
-
2026-03-17$200,000 Active
-
2026-02-16historical
-
2026-02-16historical
-
2025-10-06$199,900 Active
-
2025-10-06$199,900 Active
-
2024-12-17status Pending
-
2023-05-26status Pending
-
2023-05-26status Pending
-
2023-05-16$44,900 Active
-
2023-05-16$44,900 Active
-
2014-03-20historical
-
2014-01-10$35,900
ⓘ Source: listings_history table (triggers on properties + properties_extension) + one-shot
backfill from property_details.listing_events for pre-trigger history.
Climate risk First Street
- Flood 1/10 Low FEMA zone X (unshaded) · 0% chance over 30 yrs
- Wildfire 1/10 Low
- Heat 3/10 Moderate 7 d/yr ≥97°F today · 15 d/yr by 30 yrs out
- Wind 2/10 Low
- Air quality 4/10 Moderate 4 unhealthy d/yr today · 6 by 30 yrs out
Nearby sold comps map
Loading sold comps map…
Walkable amenities ~0.75 mi
Loading nearby amenities…
Taxation est. · year 1
- Rental income
- $25,274
- − Mortgage interest
- −$9,803
- − Property taxes
- −$2,625
- − Insurance
- −$875
- − Repairs & maintenance
- −$2,022
- − Management
- −$2,022
- − Depreciation
- −$5,091
- Taxable income
- $2,836
- Est. tax owed @ 24.0%
- −$681
- After-tax cash flow
- $4,773/yr
For passive investors: Depreciation is non-cash, so a rental often shows a tax loss while cash-flowing — sheltering income. Rental losses are passive: they offset passive income freely, and up to $25,000/yr can offset ordinary (W-2) income if you actively participate and your MAGI is under $100k (phasing out to $0 by $150k); unused losses carry forward. On sale, claimed depreciation is recaptured at up to 25%, and gains may owe capital-gains tax (a 1031 exchange can defer both). Figures are a year-1 estimate at your 24.0% rate — not tax advice; consult a CPA.
Condition & rehab AI · 7 photos
This multi-family property requires extensive repairs and maintenance to improve its condition and increase its value.
Repairs flagged
- Major Kitchen cabinets — Dirty and cluttered
- Major Bathroom cabinets — Cluttered with personal items
- Major Exterior landscaping — Overgrown lawn and debris
- Major Flooring — Dirty and worn
Value-add opportunities
- Both Deep cleaning and decluttering — Improves both resale and rental value
- Both Landscaping and curb appeal — Enhances curb appeal and rental value
- Both Painting interior walls — Enhances interior aesthetics and rental value
Renovation cost estimate screening
| Repair item | Severity | Est. cost |
|---|---|---|
| Kitchen cabinets · Dirty and cluttered | Major | $15,000–50,000 |
| Bathroom cabinets · Cluttered with personal items | Major | $15,000–50,000 |
| Exterior landscaping · Overgrown lawn and debris | Major | $15,000–50,000 |
| Flooring · Dirty and worn | Major | $15,000–50,000 |
| Total estimated repair cost · 4 items | $60,000–200,000 |
Value-add ROI direction
- Both Deep cleaning and decluttering — Improves both resale and rental value ↑
- Both Landscaping and curb appeal — Enhances curb appeal and rental value ↑
- Both Painting interior walls — Enhances interior aesthetics and rental value ↑
ⓘ Cost ranges are severity-bucket heuristics (US national rule-of-thumb). Get contractor quotes + a written scope before underwriting a rehab budget.
Schools (NCES district)
- District
- Detroit Public Schools Community District
- NCES district ID
- 2601103
- Math proficiency
- 10% ▼ -2.00%
- Reading proficiency
- 24% ▲ 6.00%
- Median HH income
- $25,815
- Composite
- 13.06/100
- National rank
- #9564
- State rank
- #499 of 540 in MI
Livability — Detroit
- Score
- 73/100
- State rank
- #218
- US rank
- #5427
Category grades
Schools grade is shown separately in the Schools card above.
Census & demographics
- Census place
- Detroit, MI
- County
- Wayne County · 1,562,939 people
- City population
- 572,865
- Metro
- Detroit-Warren-Dearborn, MI
- Population (ZIP)
- 24,731
- Household income
- $33,315
- Rent vs Own
- Severe rent burden
- 2172.0
Population outlook (Wayne County) Hauer SSP2
- Today (2025)
- 1,675,273 people
- By 2030
- 1,620,300 · -3.3%
- By 2040
- 1,502,341 · -10.3%
- By 2050
- 1,384,039 · -17.4%
- By 2075
- 1,124,592 · -32.9%
- By 2100
- 881,193 · -47.4%
Race, ethnicity, and origin ACS 2023
- Neighborhood character
- Predominantly Black (94%)
- Race & ethnicity
- Black 94% Two or more races 3% White 1%
- Foreign-born
- 1%
Political lean MEDSL · Wayne
- 2024 margin
- Strong D (+29.0) · D 62.7% · R 33.7% · Other 3.6%
- 2008→2024 swing
- -20.5pp toward R · 2008: 49.5pp · 2024: 29.0pp
- All cycles
- 2024: D+29.0 2020: D+38.1 2016: D+37.3 2012: D+46.9 2008: D+49.5
Not yet ingested
- Civics
- —
Market trends
- HPI YoY
- ▼ -31.96%
- Current HPI
- 189.6227
- Rent YoY
- ▲ 6.14%
- Metro
- Detroit-Warren-Dearborn, MI
- State GDP YoY
- ▲ 1.37%
- F500 in state
- 28
Industry mix (Fortune 500 HQ in MI)
| Industry | F500 HQs | Revenue |
|---|---|---|
| Automotive Parts | 3 | $48B |
|
||
| Automotive | 2 | $372B |
|
||
| Chemicals | 1 | $45B |
|
||
| Automotive Retail | 1 | $29B |
|
||
| Healthcare / Medical Devices | 1 | $23B |
|
||
| Automotive Technology | 1 | $20B |
|
||
Price history
+457.1% since first listed15 events — show timeline
- 2026-04-15 Listed $200,000 REALCOMP
- 2026-04-15 Listed $200,000 MiRealSource-MiMLS
- 2026-03-17 Listed $200,000 REALCOMP
- 2026-03-17 Listed $200,000 MiRealSource-MiMLS
- 2026-02-16 Listing Removed — REALCOMP
- 2026-02-16 Listing Removed — MiRealSource-MiMLS
- 2025-10-06 Listed $199,900 REALCOMP
- 2025-10-06 Listed $199,900 MiRealSource-MiMLS
- 2024-12-17 Pending — REALCOMP
- 2023-05-26 Pending — MiRealSource-MiMLS
- 2023-05-26 Pending — REALCOMP
- 2023-05-16 Listed $44,900 MiRealSource-MiMLS
- 2023-05-16 Listed $44,900 REALCOMP
- 2014-03-20 Listing Removed — MiRealSource-MiMLS
- 2014-01-10 Listed $35,900 MiRealSource-MiMLS
Cash-flow waterfall
monthlySold comps — $/sqft
last 12 mo · ≤1 miLoading sold comps…