 5-Plex
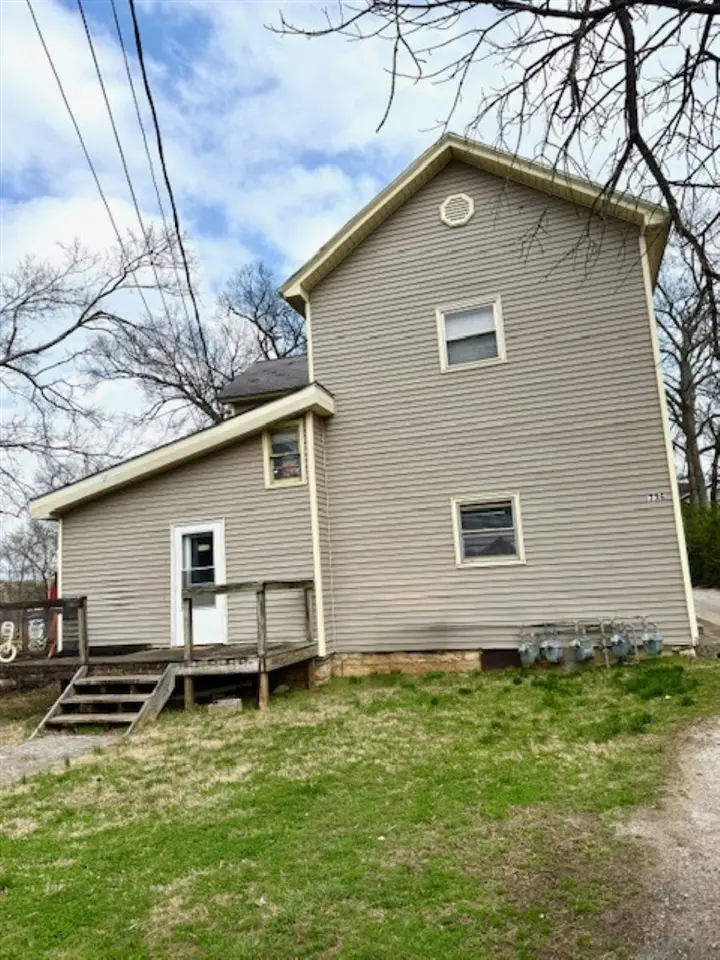
736 E 12th St · Bowling Green, KY
Flood risk 1/10 · Minimal
- FEMA flood zone
- X (unshaded)
- Chance of flooding over 30 yrs
- 0.0%
- Est. flood insurance / yr
- $507 – $1,088
Fire risk 1/10 · Minimal
- Est. fire insurance / yr
- $839 – $1,559
Heat risk 6/10 · Moderate
- Hot days now (above 107°F)
- 7 days/yr
- Hot days in 30 yrs
- 19 days/yr
Wind risk 2/10 · Minimal
- Chance of severe wind over 30 yrs
- 5.0%
Air-quality risk 2/10 · Minimal
- Unhealthy air days now
- 0 days/yr
- Unhealthy air days in 30 yrs
- 1 days/yr
Risk factors via First Street. Map © Google.
Why this score? — see what drove the B- grade
The composite is a weighted blend of 9 inputs, each scored 0–100. Each bar is that input's sub-score; the figure is the points it added to the 100-point composite (weight × sub-score).
- Cash flow +30.0/30.0
- 1% rule +10.0/10.0
- DSCR +10.0/10.0
- ARV discount +7.5/15.0
- Schools +3.2/10.0
- Livability +3.2/5.0
- Rent growth +2.6/5.0
- Condition / age +2.5/5.0
- Appreciation +0.0/10.0
$399,900
🖨 Deal sheet (PDF) 📄 Offer letter ✓ Due diligence
Multi-family units
County records classify this as Multi-Family (5+ Unit). Listing-text estimate: 5 units. confirmed
5+ unit building — per-unit beds/baths from public records are typically unavailable; the breakdown below (if shown) is an estimate from the listing text.
Listing remarks
5 Unit property in great location. 3 units currently have active leases. Property sold As-Is
Key facts
- 7,841 sq ft lot
- Built 1880
- Listed 94 days
Property features AI
Finance
- Other: Directions: US 31 Bypass to Broadway Ave / becomes E 12th Ave
- Financial info: Investor/multifamily property (income-producing)
- HOA & community: Details not provided
Exterior
- Parking: Details not provided
- Security: Details not provided
- Utilities: Public water; Public sewer
- Home design: Multi-family residential income property
- Construction: Details not provided
- Exterior features: Lot approximately 0.18 acres
Interior
- Kitchen: Details not provided
- Bedrooms: Details not provided
- Flooring: Details not provided
- Bathrooms: 5 full bathrooms
- Heating & cooling: Details not provided
- Interior features: Electric water heater
- Laundry & utility: Details not provided
Neighborhood map
What this means for you Summary
Snapshot
- This is a 5 × 7-bed/5.0-bath units multifamily listed at $400k.
Deal economics
- At list price, monthly cash flow is $4k ($43k/yr) — positive. Per door: $712/mo.
- The deal already cash-flows at list — no discount required.
- Meets the 1% rule at list price ($8k rent vs $400k).
- Recommended offer: $364k (9.0% below list) — sets the bar for market timing.
- Cap rate 17.0% vs local median 3.2% in Bowling Green — top-decile yield for the area; either an underpriced asset or a hidden risk that comps aren't pricing in. Stress-test before assuming the spread holds.
Location & tenants
- Location reads 65/100 on livability (#255 in KY) — a middle-class / working-renter tenant base. Strengths: cost of living A+, housing A+; Watch: crime C-, amenities F, commute F.
- Bowling Green Independent (urban): math 37% / reading 41% proficiency, ranked #44 of 165 in KY (top 27%) — families likely to look elsewhere, expect single-tenant / working-renter base with shorter leases.
- Zoned schools: Potter Gray Elementary (math 62% / reading 55%, grade B-, #42 of 676 statewide, top 6%, 424 students, 32% FRL); Bowling Green Junior High (math 37% / reading 46%, grade F, #51 of 217 statewide, top 24%, 963 students, 65% FRL); Bowling Green High School (math 39% / reading 39%, grade F, #51 of 254 statewide, top 21%, 1,294 students, 58% FRL) — zoned schools at 51% FRL track the district average.
- Market conditions: Rents flat; 592 active listings in the ZIP; 2,286 units permitted in Warren County in 2024 (1,410 in 5+ unit buildings).
- At $8,007/mo this rent would consume 199% of the median local household income ($48k/yr) (locally 3855% of renters already pay >50% of income on rent) — very limited rent-growth headroom before tenants either downsize or default.
Forward outlook
- Local home prices are declining (-3.0%/yr); year-one equity from $3k of loan paydown is wiped out by about $12k of value loss. Plan a longer hold.
- Warren County population projected at +41% by 2050 — long-run rental-demand tailwind backs the buy-and-hold thesis.
- At projected returns (-3.0% appreciation + 0.3% rent growth), your $112k cash investment doubles in ~4 years — after that, you're playing with house money.
Negotiation context
- It's been on market 94 days — a 9% lower offer ($364k) is reasonable based on typical stale-listing flexibility.
Risks & watch-outs
- Watch-outs: built in 1880 — expect roof / HVAC / electrical / plumbing capex.
- Climate carrying-cost: extreme-heat days projected 7→19/yr by 2055 (HVAC capex compounding) — expect insurance premiums to compound above CPI over the hold.
Questions for the listing agent
- It's been on market 94 days. Have you received any prior offers? Is the seller open to a 9% concession, seller financing, or rate buy-down credit?
- Can we see the unit-by-unit rent roll, current vacancy, and any below-market leases? What's the average tenancy length?
- What capital expenditures (roof, boiler, parking lot, exteriors) have been made in the last 5 years, and what's planned in the next 2?
- Built in 1880 — when were the roof, HVAC, electrical panel, plumbing, and water heater last replaced?
- Why hasn't it sold? Are there any deal-killer items the seller is aware of (foundation, flood, title, zoning, code violations)?
- Is there a deadline driving the sale (1031 exchange, divorce, estate, relocation)? That informs how much negotiation room exists.
- Schools are D-rated, which usually means shorter tenancies and higher turnover. Who's the typical renter profile here, and what's been the actual vacancy rate?
- What's the average days-on-market for RENTAL listings here right now (not sales)? A rising rental-DOM trend means longer vacancies and softer asking-rent achievability than the comps imply.
- What's the recent tenant-quality profile in this submarket — average credit score on applications, eviction rate, late-payment / NSF rate, and stable-employment percentage? A property-management company in the area should have these aggregated.
- How much new apartment / multifamily construction is in the pipeline within 1–3 miles? Heavy new supply (>2% of stock underway) typically softens rents 12–24 months out; light construction supports rent growth.
Investment metrics
- 1% rule
- 2.00% ✓
- Cap rate
- 16.98%
- Cash-on-cash
- 38.17%
- DSCR
- 2.70
- GRM
- 4.2
CMA / ARV
No comps found within radius.
Projected returns pro-forma
-3.0% appreciation · 0.28% rent growth · sell at horizon
- IRR
- 31.1%
- Equity multiple
- 2.26×
- Total profit
- $140,846
- Equity at exit
- $59,626
- IRR
- 36.8%
- Equity multiple
- 3.97×
- Total profit
- $332,351
- Equity at exit
- $34,576
Cash invested: $111,972 (down + closing). Projections, not guarantees.
Landlord ↔ Tenant lean methodology
- Overall (STATE)
- 83 Strongly Landlord-Friendly
- State Kentucky
- 83 Strongly Landlord-Friendly · R+16
- County
- — inherits STATE
- City
- — inherits STATE
ZIP-level market 42101
- Home prices YoY
- -20.9%
- Rents YoY
- 0.3%
- Active inventory
- 592
- Price-to-rent
- 20.8×
Monthly cashflow live
- Estimated rent
- $8,007 medium interval (Pro) →
- Mortgage (P&I)
- −$2,097
- Tax est. 1.5%
- −$500 /mo · $5,998/yr
- Insurance
- −$167
- HOA
- −$0
- Vacancy / Maint / Mgmt
- −$1,681
- Net cashflow
- $3,562
Break-even live
Sensitivity live
| Price | -10% $3,838 | -5% $3,700 | +0% $3,562 | +5% $3,424 | +10% $3,286 |
|---|---|---|---|---|---|
| Rent | -10% $2,929 | -5% $3,246 | +0% $3,562 | +5% $3,878 | +10% $4,194 |
| Rate | -1.0pp $3,763 | -0.5pp $3,664 | base $3,562 | +0.5pp $3,458 | +1.0pp $3,353 |
5-unit breakdown (identical units grouped — click to expand)
| Units | Beds | Baths | Est. rent |
|---|---|---|---|
| 5× units | 7 | 5 | $8,005 |
| #1 | 7 | 5 | $1,601 |
| #2 | 7 | 5 | $1,601 |
| #3 | 7 | 5 | $1,601 |
| #4 | 7 | 5 | $1,601 |
| #5 | 7 | 5 | $1,601 |
| Total (5 units) | $8,007 | ||
UW: 25.0% down · 7.5% · 30yr · 1.5% tax · 5.0% vac · 8.0% maint · 8.0% mgmt
Financing live
Cash to close
- Down payment
- $99,975
- Closing costs
- $11,997
- Reserves months
- —
- Total cash needed
- —
Loan-product check · same deal, 3 products live
Conventional
25% down · 7.5% · 30yr
- Down + closing
- —
- Monthly P&I
- —
- Monthly cashflow
- —
- DSCR
- —
- Eligible?
- —
Personal DTI + credit; lowest rate.
DSCR
20% down · 8.5% · 30yr
- Down + closing
- —
- Monthly P&I
- —
- Monthly cashflow
- —
- DSCR
- —
- Eligible?
- —
No personal income docs; deal must DSCR.
Hard money
10% down · 12.0% · 12mo
- Down + closing
- —
- Monthly P&I
- —
- Monthly cashflow
- —
- DSCR
- —
- Eligible?
- —
Short-term bridge; refi at stabilization.
Listing history 17 events
-
2026-06-21days on market $399,900 Active 94 DOM
-
2026-06-19days on market $399,900 Active 92 DOM
-
2026-06-18days on market $399,900 Active 91 DOM
-
2026-06-17days on market $399,900 Active 90 DOM
-
2026-06-16days on market $399,900 Active 89 DOM
-
2026-06-15days on market $399,900 Active 88 DOM
-
2026-06-14days on market $399,900 Active 86 DOM
-
2026-06-13days on market $399,900 Active 85 DOM
-
2026-06-10days on market $399,900 Active 83 DOM
-
2026-06-09days on market $399,900 Active 82 DOM
-
2026-06-08days on market $399,900 Active 81 DOM
-
2026-06-07days on market $399,900 Active 80 DOM
-
2026-06-02days on market $399,900 Active 75 DOM
-
2026-06-01days on market $399,900 Active 74 DOM
-
2026-05-31days on market $399,900 Active 73 DOM
-
2026-05-30days on market $399,900 Active 72 DOM
-
2026-03-19$399,900 Active
ⓘ Source: listings_history table (triggers on properties + properties_extension) + one-shot
backfill from property_details.listing_events for pre-trigger history.
Climate risk First Street
- Flood 1/10 Low FEMA zone X (unshaded) · 0% chance over 30 yrs
- Wildfire 1/10 Low
- Heat 6/10 Major 7 d/yr ≥107°F today · 19 d/yr by 30 yrs out
- Wind 2/10 Low 5% chance of damaging wind over 30 yrs
- Air quality 2/10 Low 0 unhealthy d/yr today · 1 by 30 yrs out
Nearby sold comps map
Loading sold comps map…
Walkable amenities ~0.75 mi
Loading nearby amenities…
Taxation est. · year 1
- Rental income
- $96,084
- − Mortgage interest
- −$22,401
- − Property taxes
- −$5,998
- − Insurance
- −$2,000
- − Repairs & maintenance
- −$7,687
- − Management
- −$7,687
- − Depreciation
- −$11,633
- Taxable income
- $38,678
- Est. tax owed @ 24.0%
- −$9,283
- After-tax cash flow
- $33,460/yr
For passive investors: Depreciation is non-cash, so a rental often shows a tax loss while cash-flowing — sheltering income. Rental losses are passive: they offset passive income freely, and up to $25,000/yr can offset ordinary (W-2) income if you actively participate and your MAGI is under $100k (phasing out to $0 by $150k); unused losses carry forward. On sale, claimed depreciation is recaptured at up to 25%, and gains may owe capital-gains tax (a 1031 exchange can defer both). Figures are a year-1 estimate at your 24.0% rate — not tax advice; consult a CPA.
Schools (NCES district)
- District
- Bowling Green Independent
- NCES district ID
- 2100570
- Math proficiency
- 37% ▼ -11.00%
- Reading proficiency
- 41% ▼ -15.00%
- Median HH income
- $31,181
- Composite
- 31.86/100
- National rank
- #5870
- State rank
- #44 of 165 in KY
Livability — Bowling Green
- Score
- 65/100
- State rank
- #255
- US rank
- #12782
Category grades
Schools grade is shown separately in the Schools card above.
Census & demographics
- Census place
- Bowling Green, KY
- County
- Warren County · 129,408 people
- City population
- 129,408
- Metro
- Bowling Green, KY
- Population (ZIP)
- 65,421
- Household income
- $48,217
- Rent vs Own
- Severe rent burden
- 3855.0
Population outlook (Warren County) Hauer SSP2
- Today (2025)
- 144,620 people
- By 2030
- 155,977 · +7.9%
- By 2040
- 179,381 · +24.0%
- By 2050
- 203,713 · +40.9%
- By 2075
- 267,291 · +84.8%
- By 2100
- 314,019 · +117.1%
Race, ethnicity, and origin ACS 2023
- Neighborhood character
- Predominantly White (68%)
- Race & ethnicity
- White 68% Black 13% Hispanic / Latino 10% Two or more races 7% Asian 3%
- Hispanic origin (detail)
- Mexican 6%
- Common ancestry
- Slovak 2% American 1% Italian 1%
- Foreign-born
- 10% · Canada, Philippines
- Languages at home
- 84% English-only · Spanish 8% Other Asian/Pacific 2% Russian/Polish/Slavic 2%
Political lean MEDSL · Warren
- 2024 margin
- Strong R (+24.3) · D 37.0% · R 61.3% · Other 1.6%
- 2008→2024 swing
- -5.4pp toward R · 2008: -18.9pp · 2024: -24.3pp
- All cycles
- 2024: R+24.3 2020: R+16.8 2016: R+24.2 2012: R+21.8 2008: R+18.9
Not yet ingested
- Civics
- —
Market trends
- HPI YoY
- ▼ -73.34%
- Current HPI
- 277.6554
- Rent YoY
- ▲ 0.28%
- Metro
- Bowling Green, KY
- State GDP YoY
- ▲ 1.81%
- F500 in state
- 4
Industry mix (Fortune 500 HQ in KY)
| Industry | F500 HQs | Revenue |
|---|---|---|
| Healthcare | 1 | $118B |
|
||
| Food / Beverage | 1 | $7B |
|
||
Price history
1 event — show timeline
- 2026-03-19 Listed $399,900 RASKMLS
Property tax history
+0.2%/yrLatest (2017): $424 · +1.0% YoY. Source: county tax records.
Cash-flow waterfall
monthlySold comps — $/sqft
last 12 mo · ≤1 miLoading sold comps…