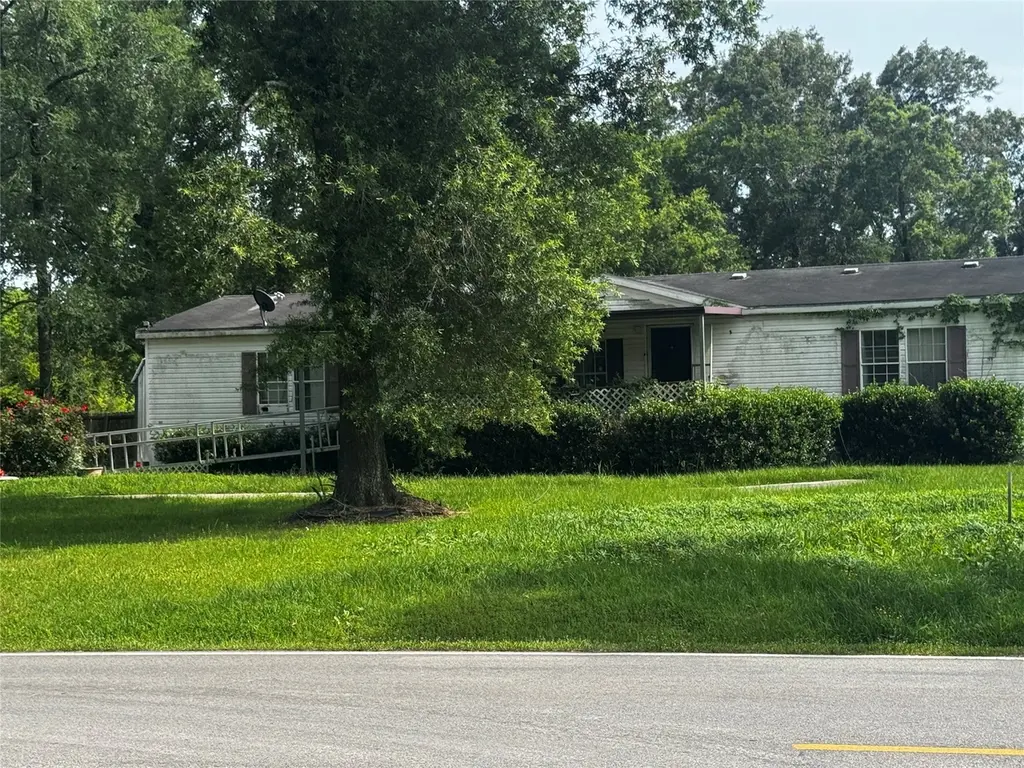
11403 Walraven Dr · Houston, TX
Flood risk 1/10 · Minimal
- FEMA flood zone
- X (unshaded)
- Chance of flooding over 30 yrs
- 0.0%
- Est. flood insurance / yr
- $507 – $1,088
Fire risk 3/10 · Minor
- Est. fire insurance / yr
- $1,222 – $2,270
Heat risk 9/10 · Severe
- Hot days now (above 111°F)
- 7 days/yr
- Hot days in 30 yrs
- 24 days/yr
Wind risk 9/10 · Severe
- Chance of severe wind over 30 yrs
- 99.0%
Air-quality risk 2/10 · Minimal
- Unhealthy air days now
- 2 days/yr
- Unhealthy air days in 30 yrs
- 2 days/yr
Risk factors via First Street. Map © Google.
Why this score? — see what drove the B- grade
The composite is a weighted blend of 9 inputs, each scored 0–100. Each bar is that input's sub-score; the figure is the points it added to the 100-point composite (weight × sub-score).
- Cash flow +26.5/30.0
- ARV discount +15.0/15.0
- DSCR +9.0/10.0
- 1% rule +6.4/10.0
- Livability +3.7/5.0
- Schools +3.1/10.0
- Rent growth +2.5/5.0
- Condition / age +2.5/5.0
- Appreciation +0.7/10.0
$185,000
🖨 Deal sheet (PDF) 📄 Offer letter ✓ Due diligence
Listing remarks MLS
Very Well Maintained Mobile Home located on 2 lots. .. Above Ground Pool and Fully Fenced Backyard. This Huffman Charmer is located in the GREAT Huffman School District and is READY FOR ITS NEW OWNER! THIS ONE WON'T LAST LONG-LET'S GET YOU MOVED IN RIGHT AWAY!!!
Key facts
- 0.52 acre lot
- Built 2001
- Listed 46 days
Property features AI
Finance
- Other: Seller disclosure available
- Financial info: Lease not considered
Exterior
- Utilities: Public water; Public sewer
- Home design: Residential property; Faces northwest; Built in 2001; Pillar/post/pier foundation
- Construction: Aluminum siding
- Exterior features: Cleared lot
Interior
- Kitchen: Dishwasher; Electric cooktop; Electric oven; Electric range
- Flooring: Carpet; Vinyl
- Bathrooms: 2 full bathrooms
- Heating & cooling: Central heating (electric); Central air conditioning (electric)
- Interior features: Stove fireplace; 7 total rooms
Neighborhood map
What this means for you Summary
Snapshot
- This is a 3-bed/2.0-bath manufactured listed at $185k.
Deal economics
- At list price, monthly cash flow is $490 ($6k/yr) — positive.
- The deal already cash-flows at list — no discount required.
- Meets the 1% rule at list price ($2k rent vs $185k).
- Recommended offer: $179k (3.0% below list) — sets the bar for market timing.
- Cap rate 9.5% vs local median 3.2% in Houston — top-decile yield for the area; either an underpriced asset or a hidden risk that comps aren't pricing in. Stress-test before assuming the spread holds.
Location & tenants
- Location reads 74/100 on livability (#184 in TX, #4,771 nationally) — a middle-class / working-renter tenant base. Strengths: amenities A+, cost of living A+, housing A+; Watch: crime F.
- Huffman ISD (rural): math 32% / reading 35% proficiency, ranked #500 of 826 in TX (top 60%) — families likely to look elsewhere, expect single-tenant / working-renter base with shorter leases.
- Zoned schools: Huffman Middle (math 36% / reading 32%, grade F, #892 of 1,662 statewide, top 55%, 907 students, 42% FRL); Hargrave H S (math 31% / reading 46%, grade F, #866 of 1,632 statewide, top 54%, 1,125 students, 36% FRL) — zoned schools at 39% FRL track the district average.
- Market conditions: 587 active listings in the ZIP; 6 comparable units currently listed for rent nearby; rentals lingering (median 45d on market — plan ~5-8 weeks vacancy on turnover, expect pricing pressure); 83% of comp listings sitting > 30 days — soft ceiling on asking rent; solid renter incomes; 29,883 units permitted in Harris County in 2024 (8,621 in 5+ unit buildings).
Forward outlook
- Local home prices are declining (-3.0%/yr); year-one equity from $1k of loan paydown is wiped out by about $6k of value loss. Plan a longer hold.
- Harris County population projected at +47% by 2050 — long-run rental-demand tailwind backs the buy-and-hold thesis.
- At projected returns (-3.0% appreciation + 3.0% rent growth), your $52k cash investment doubles in ~10 years — after that, you're playing with house money.
Negotiation context
- It's been on market 47 days — a 3% lower offer ($179k) is reasonable based on typical stale-listing flexibility.
- 5 sale attempts since 24y ago with the ask held roughly flat each time — persistent listings suggest the price (not the market) is what's stuck; bring a comps-based counter.
Risks & watch-outs
- Climate carrying-cost: severe wind risk, 99% chance of damaging wind over 30y; extreme-heat days projected 7→24/yr by 2055 (HVAC capex compounding) — expect insurance premiums to compound above CPI over the hold.
Questions for the listing agent
- It's been on market 47 days. Have you received any prior offers? Is the seller open to a 3% concession, seller financing, or rate buy-down credit?
- Is there a deadline driving the sale (1031 exchange, divorce, estate, relocation)? That informs how much negotiation room exists.
- Schools are D-rated, which usually means shorter tenancies and higher turnover. Who's the typical renter profile here, and what's been the actual vacancy rate?
- Crime grade is F in this area — have there been break-ins, vandalism, or insurance claims at this property in the last 3 years? What carrier currently insures it and at what premium?
- What's the average days-on-market for RENTAL listings here right now (not sales)? A rising rental-DOM trend means longer vacancies and softer asking-rent achievability than the comps imply.
- What's the recent tenant-quality profile in this submarket — average credit score on applications, eviction rate, late-payment / NSF rate, and stable-employment percentage? A property-management company in the area should have these aggregated.
- How much new for-sale + rental construction is in the pipeline within 1–3 miles? Heavy new supply typically softens prices + rents 12–24 months out; constrained supply supports both.
Investment metrics
- 1% rule
- 1.14% ✓
- Cap rate
- 9.47%
- Cash-on-cash
- 11.35%
- DSCR
- 1.50
- GRM
- 7.3
CMA / ARV
- ARV (median comp)
- $283,598
- List price
- $185,000
- Delta
- -34.77%
- Verdict
- UNDERPRICED
- Comps
- 2 within 2.0 mi
Show comp detail 1 sale within ~0.75 mi
| Address | Dist | Beds/Ba | Sqft | Sold | Price | $/sf | Match |
|---|---|---|---|---|---|---|---|
| 12207 Walraven Dr | 0.56mi | 3/2.0 | 1,836 (-4%) | 6mo | $179,900 | $98 | 63 |
Match score weights: distance 35% · size 25% · config 20% · recency 20%. Top-matched comps best support the ARV.
Projected returns pro-forma
-3.0% appreciation · 3.0% rent growth · sell at horizon
- IRR
- 0.6%
- Equity multiple
- 1.02×
- Total profit
- $1,191
- Equity at exit
- $27,584
- IRR
- 10.2%
- Equity multiple
- 1.79×
- Total profit
- $41,087
- Equity at exit
- $15,995
Cash invested: $51,800 (down + closing). Projections, not guarantees.
Landlord ↔ Tenant lean methodology
- Overall (STATE)
- 87 Strongly Landlord-Friendly
- State Texas
- 87 Strongly Landlord-Friendly · R+5
- County
- — inherits STATE
- City
- — inherits STATE
ZIP-level market 77336
- Home prices YoY
- -1.8%
- Active inventory
- 587
- Price-to-rent
- 7.3×
Monthly cashflow live
- Estimated rent
- $2,110 high interval (Pro) →
- Mortgage (P&I)
- −$970
- Tax from tax record
- −$130 /mo · $1,556/yr
- Insurance
- −$77
- HOA
- −$0
- Vacancy / Maint / Mgmt
- −$443
- Net cashflow
- $490
Break-even live
Sensitivity live
| Price | -10% $595 | -5% $542 | +0% $490 | +5% $437 | +10% $385 |
|---|---|---|---|---|---|
| Rent | -10% $323 | -5% $407 | +0% $490 | +5% $573 | +10% $657 |
| Rate | -1.0pp $583 | -0.5pp $537 | base $490 | +0.5pp $442 | +1.0pp $393 |
UW: 25.0% down · 7.5% · 30yr · 1.5% tax · 5.0% vac · 8.0% maint · 8.0% mgmt
Financing live
Cash to close
- Down payment
- $46,250
- Closing costs
- $5,550
- Reserves months
- —
- Total cash needed
- —
Loan-product check · same deal, 3 products live
Conventional
25% down · 7.5% · 30yr
- Down + closing
- —
- Monthly P&I
- —
- Monthly cashflow
- —
- DSCR
- —
- Eligible?
- —
Personal DTI + credit; lowest rate.
DSCR
20% down · 8.5% · 30yr
- Down + closing
- —
- Monthly P&I
- —
- Monthly cashflow
- —
- DSCR
- —
- Eligible?
- —
No personal income docs; deal must DSCR.
Hard money
10% down · 12.0% · 12mo
- Down + closing
- —
- Monthly P&I
- —
- Monthly cashflow
- —
- DSCR
- —
- Eligible?
- —
Short-term bridge; refi at stabilization.
Rent comps 6 comps
| Address | Beds | Baths | Sqft | Rent | $/sqft | DOM | Units | Dist |
|---|---|---|---|---|---|---|---|---|
| 24730 Russet Bluff Trl Huffman, TX | 4.0 | 2.0 | 1604 | $2,150 | $1.34 | 0d | 1 | 0.28mi |
| 24719 Colony Meadow Trl Huffman, TX | 4.0 | 2.0 | 1613 | $2,200 | $1.36 | 45d | 1 | 0.35mi |
| 24118 Grey Fox Dr Huffman, TX | 3.0 | 2.0 | 1543 | $1,425 | $0.92 | 45d | 1 | 0.59mi |
| 408 Emerald Thicket Ln Huffman, TX | 3.0 | 2.5 | 1755 | $2,200 | $1.25 | 45d | 1 | 0.96mi |
| 24523 Whitesail Dr Huffman, TX | 3.0 | 2.0 | 1512 | $1,800 | $1.19 | 45d | 1 | 1.14mi |
| 24527 Lightwoods Dr Huffman, TX | 4.0 | 2.0 | 2095 | $2,100 | $1.00 | 45d | 1 | 1.25mi |
Listing history 28 events
-
2026-06-21days on market $185,000 Active 47 DOM
-
2026-06-18days on market $185,000 Active 44 DOM
-
2026-06-17days on market $185,000 Active 43 DOM
-
2026-06-16days on market $185,000 Active 42 DOM
-
2026-06-15days on market $185,000 Active 41 DOM
-
2026-06-13days on market $185,000 Active 39 DOM
-
2026-06-09days on market $185,000 Active 35 DOM
-
2026-06-08days on market $185,000 Active 34 DOM
-
2026-06-07days on market $185,000 Active 33 DOM
-
2026-06-04days on market $185,000 Active 30 DOM
-
2026-06-03days on market $185,000 Active 29 DOM
-
2026-06-02days on market $185,000 Active 28 DOM
-
2026-06-01days on market $185,000 Active 27 DOM
-
2026-05-31days on market $185,000 Active 26 DOM
-
2026-05-05$185,000 Active 895-char remark
-
2025-05-05soldstatus
-
2016-08-23soldstatus
-
2016-08-22soldstatus Sold 263-char remark
Show marketing remark (263 chars)
Very Well Maintained Mobile Home located on 2 lots. .. Above Ground Pool and Fully Fenced Backyard. This Huffman Charmer is located in the GREAT Huffman School District and is READY FOR ITS NEW OWNER! THIS ONE WON'T LAST LONG-LET'S GET YOU MOVED IN RIGHT AWAY!!!
-
2016-08-19status Pending 263-char remark
Show marketing remark (263 chars)
Very Well Maintained Mobile Home located on 2 lots. .. Above Ground Pool and Fully Fenced Backyard. This Huffman Charmer is located in the GREAT Huffman School District and is READY FOR ITS NEW OWNER! THIS ONE WON'T LAST LONG-LET'S GET YOU MOVED IN RIGHT AWAY!!!
-
2016-08-16status Option Pending 263-char remark
Show marketing remark (263 chars)
Very Well Maintained Mobile Home located on 2 lots. .. Above Ground Pool and Fully Fenced Backyard. This Huffman Charmer is located in the GREAT Huffman School District and is READY FOR ITS NEW OWNER! THIS ONE WON'T LAST LONG-LET'S GET YOU MOVED IN RIGHT AWAY!!!
-
2016-07-14$124,900 Active 263-char remark
Show marketing remark (263 chars)
Very Well Maintained Mobile Home located on 2 lots. .. Above Ground Pool and Fully Fenced Backyard. This Huffman Charmer is located in the GREAT Huffman School District and is READY FOR ITS NEW OWNER! THIS ONE WON'T LAST LONG-LET'S GET YOU MOVED IN RIGHT AWAY!!!
-
2007-09-16historical
-
2007-03-31$89,900
-
2006-12-31historical
-
2006-08-18$96,000
-
2003-04-09soldstatus
-
2002-12-31historical
-
2002-01-08$19,500
ⓘ Source: listings_history table (triggers on properties + properties_extension) + one-shot
backfill from property_details.listing_events for pre-trigger history.
Tax reassessment forecast TX · Resets to sale price
- Current annual tax
- $1,556 · $130/mo
- Projected year-2 tax
- $3,386 · $282/mo
- Expected delta
- +$1,830/yr (+$152/mo · 117.6%)
ⓘ Screening estimate from a state-policy table — verify with the county assessor before closing.
Climate risk First Street
- Flood 1/10 Low FEMA zone X (unshaded) · 0% chance over 30 yrs
- Wildfire 3/10 Moderate
- Heat 9/10 Extreme 7 d/yr ≥111°F today · 24 d/yr by 30 yrs out
- Wind 9/10 Extreme 99% chance of damaging wind over 30 yrs
- Air quality 2/10 Low 2 unhealthy d/yr today · 2 by 30 yrs out
Nearby sold comps map
Loading sold comps map…
Walkable amenities ~0.75 mi
Loading nearby amenities…
Taxation est. · year 1
- Rental income
- $25,317
- − Mortgage interest
- −$10,363
- − Property taxes
- −$1,556
- − Insurance
- −$925
- − Repairs & maintenance
- −$2,025
- − Management
- −$2,025
- − Depreciation
- −$5,382
- Taxable income
- $3,041
- Est. tax owed @ 24.0%
- −$730
- After-tax cash flow
- $5,148/yr
For passive investors: Depreciation is non-cash, so a rental often shows a tax loss while cash-flowing — sheltering income. Rental losses are passive: they offset passive income freely, and up to $25,000/yr can offset ordinary (W-2) income if you actively participate and your MAGI is under $100k (phasing out to $0 by $150k); unused losses carry forward. On sale, claimed depreciation is recaptured at up to 25%, and gains may owe capital-gains tax (a 1031 exchange can defer both). Figures are a year-1 estimate at your 24.0% rate — not tax advice; consult a CPA.
Schools (NCES district)
- District
- Huffman ISD
- NCES district ID
- 4823820
- Math proficiency
- 32% ▼ -9.00%
- Reading proficiency
- 35% ▼ -9.00%
- Median HH income
- $65,848
- Composite
- 30.61/100
- National rank
- #6195
- State rank
- #500 of 826 in TX
Livability — Houston
- Score
- 74/100
- State rank
- #184
- US rank
- #4771
Category grades
Schools grade is shown separately in the Schools card above.
Census & demographics
- County
- Harris County · 4,702,590 people
- Metro
- Houston-The Woodlands-Sugar Land, TX
- Population (ZIP)
- 14,342
- Household income
- $96,404
- Rent vs Own
- Severe rent burden
- 377.0
Population outlook (Harris County) Hauer SSP2
- Today (2025)
- 5,571,493 people
- By 2030
- 6,089,821 · +9.3%
- By 2040
- 7,142,806 · +28.2%
- By 2050
- 8,185,864 · +46.9%
- By 2075
- 10,574,329 · +89.8%
- By 2100
- 12,109,958 · +117.4%
Race, ethnicity, and origin ACS 2023
- Neighborhood character
- Majority White (65%)
- Race & ethnicity
- White 65% Hispanic / Latino 23% Two or more races 9% Black 5% Native American 4%
- Hispanic origin (detail)
- Mexican 20%
- Common ancestry
- Lithuanian 4% Slovak 2% Romanian 2%
- Foreign-born
- 9% · Canada
- Languages at home
- 79% English-only · Spanish 18% Other Indo-European 2%
Political lean MEDSL · Harris
- 2024 margin
- Lean D (+5.5) · D 52.0% · R 46.4% · Other 1.6%
- 2008→2024 swing
- +3.9pp toward D · 2008: 1.6pp · 2024: 5.5pp
- All cycles
- 2024: D+5.5 2020: D+13.3 2016: D+12.4 2012: D+0.1 2008: D+1.6
Not yet ingested
- Civics
- —
Market trends
- HPI YoY
- ▼ -8.59%
- Current HPI
- 472.03
- Rent YoY
- —
- Metro
- Houston-The Woodlands-Sugar Land, TX
- State GDP YoY
- ▲ 3.95%
- F500 in state
- 110
Industry mix (Fortune 500 HQ in TX)
| Industry | F500 HQs | Revenue |
|---|---|---|
| Energy | 16 | $1,198B |
|
||
| Technology | 5 | $198B |
|
||
| Engineering / Construction | 4 | $72B |
|
||
| Energy Services | 3 | $60B |
|
||
| Utilities | 3 | $41B |
|
||
| Healthcare | 2 | $330B |
|
||
Price history
+848.7% since first listed14 events — show timeline
- 2026-05-05 Listed $185,000 HARMLS
- 2025-05-05 Sold (Public Records) — Public Records
- 2016-08-23 Sold (Public Records) — Public Records
- 2016-08-22 Sold (MLS) — HARMLS
- 2016-08-19 Pending — HARMLS
- 2016-08-16 Pending — HARMLS
- 2016-07-14 Listed $124,900 HARMLS
- 2007-09-16 Listing Removed — HARMLS
- 2007-03-31 Listed $89,900 HARMLS
- 2006-12-31 Listing Removed — HARMLS
- 2006-08-18 Listed $96,000 HARMLS
- 2003-04-09 Sold (Public Records) — Public Records
- 2002-12-31 Listing Removed — HARMLS
- 2002-01-08 Listed $19,500 HARMLS
Property tax history
+5.4%/yrLatest (2025): $1,556 · +10.6% YoY. Source: county tax records.
Cash-flow waterfall
monthlySold comps — $/sqft
last 12 mo · ≤1 miLoading sold comps…