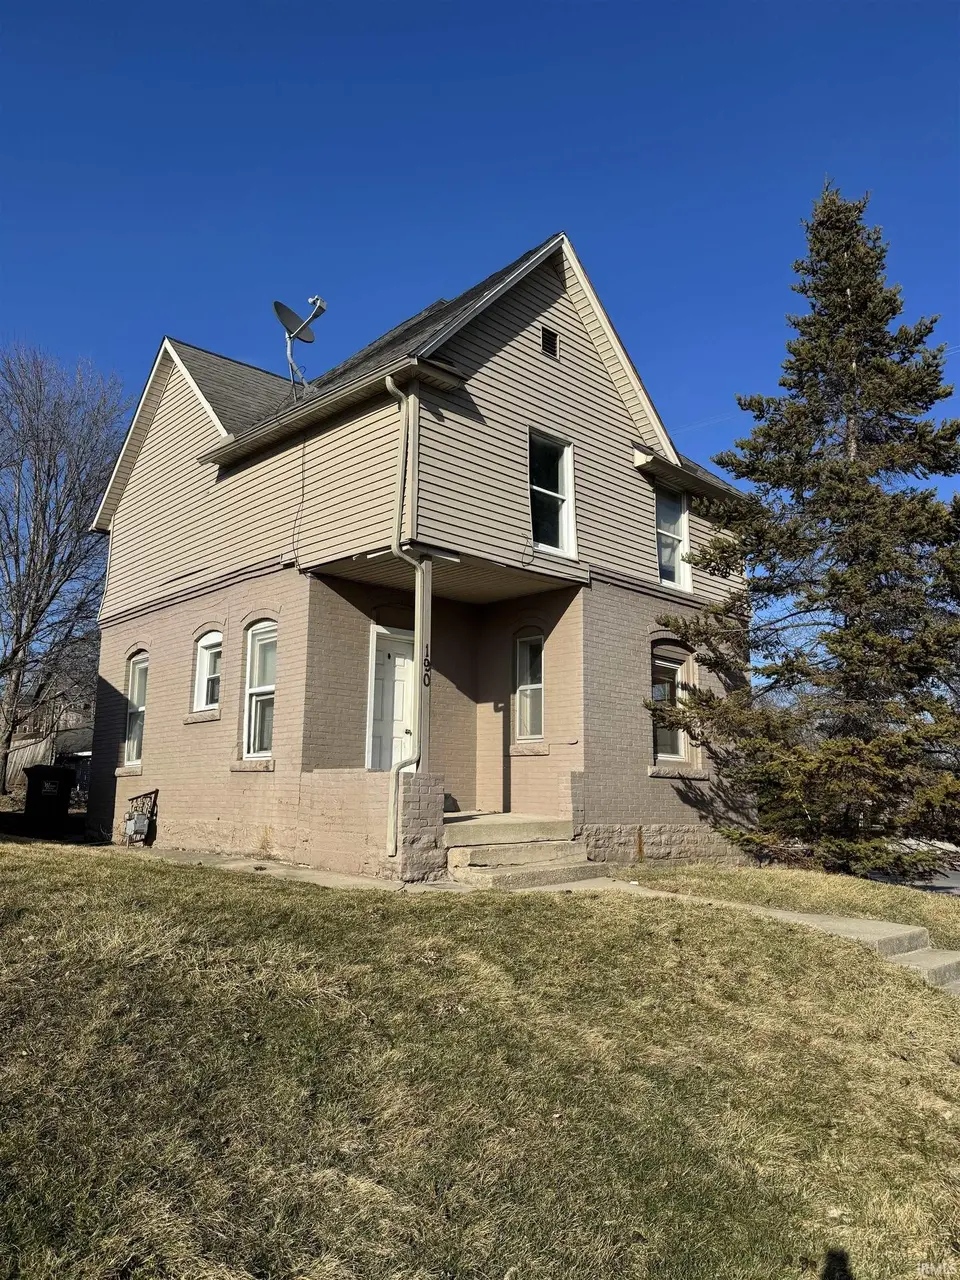
190 E Canal St · Wabash, IN
Flood risk 1/10 · Minimal
- FEMA flood zone
- X (unshaded)
- Chance of flooding over 30 yrs
- 0.0%
- Est. flood insurance / yr
- $473 – $860
Fire risk 1/10 · Minimal
- Est. fire insurance / yr
- $717 – $1,331
Heat risk 3/10 · Minor
- Hot days now (above 101°F)
- 7 days/yr
- Hot days in 30 yrs
- 18 days/yr
Wind risk 2/10 · Minimal
- Chance of severe wind over 30 yrs
- —
Air-quality risk 2/10 · Minimal
- Unhealthy air days now
- 1 days/yr
- Unhealthy air days in 30 yrs
- 2 days/yr
Risk factors via First Street. Map © Google.
Why this score? — see what drove the B- grade
The composite is a weighted blend of 9 inputs, each scored 0–100. Each bar is that input's sub-score; the figure is the points it added to the 100-point composite (weight × sub-score).
- Cash flow +26.7/30.0
- ARV discount +14.6/15.0
- DSCR +9.2/10.0
- 1% rule +6.9/10.0
- Livability +3.8/5.0
- Rent growth +2.5/5.0
- Schools +2.5/10.0
- Condition / age +2.5/5.0
- Appreciation +0.0/10.0
$79,900
🖨 Deal sheet (PDF) 📄 Offer letter ✓ Due diligence
Listing remarks MLS
This home has been a rental property for many years. It needs some TLC. Off street parking behind home. Taxes reflect no exemptions. Buyer's agent is responsible for confirming room dimensions. Stove included. Selling as is. Conventional or cash only. Listing agent is owner. Water lines were converted to pex about three years ago, water heater is 3-4 years old. Kitchen cabinets replaced 2-3 years ago. Sold As Is
Key facts
- Off street parking
- 3,485 sq ft lot
- Built 1920
Tags
Neighborhood map
What this means for you Summary
Snapshot
- This is a 3-bed/1.0-bath single-family listed at $80k.
Deal economics
- At list price, monthly cash flow is $217 ($3k/yr) — positive.
- The deal already cash-flows at list — no discount required.
- Meets the 1% rule at list price ($950 rent vs $80k).
- Recommended offer: $75k (6.0% below list) — sets the bar for market timing.
- Cap rate 9.6% vs local median 4.0% in Wabash — top-decile yield for the area; either an underpriced asset or a hidden risk that comps aren't pricing in. Stress-test before assuming the spread holds.
Location & tenants
- Location reads 76/100 on livability (#48 in IN, #3,353 nationally) — a middle-class / working-renter tenant base. Strengths: cost of living A+, housing A+, health & safety A+; Watch: employment D, commute F.
- Wabash City Schools (town): math 21% / reading 38% proficiency, ranked #249 of 301 in IN (top 83%) — low school quality limits family demand, transient renter base, plan for 1-2y turnover.
- Zoned schools: O J Neighbours Elementary School (math 24% / reading 25%, grade F, #762 of 994 statewide, top 78%, 391 students, 57% FRL); Wabash Middle School (math 18% / reading 43%, grade F, #203 of 330 statewide, top 63%, 443 students, 60% FRL); Wabash High School (math 27% / reading 42%, grade F, #270 of 369 statewide, top 77%, 478 students, 53% FRL).
- Market conditions: 37 active listings in the ZIP; 42 units permitted in Wabash County in 2024 (0 in 5+ unit buildings).
Forward outlook
- Local home prices are declining (-3.0%/yr); year-one equity from $552 of loan paydown is wiped out by about $2k of value loss. Plan a longer hold.
- Wabash County population projected at -16% by 2050 — secular population decline; favor cash flow + early exit over multi-decade hold.
- At projected returns (-3.0% appreciation + 3.0% rent growth), your $22k cash investment doubles in ~10 years — after that, you're playing with house money.
Negotiation context
- It's been on market 86 days — a 6% lower offer ($75k) is reasonable based on typical stale-listing flexibility.
- 6 sale attempts since 13y ago; this cycle's ask has dropped $5k (6%) from the opening price — seller is motivated, your offer sets the floor, not the list.
- Current owner paid $28k; list at $80k implies a 185% gain — meaningful room to come down on a strong offer.
Risks & watch-outs
- Watch-outs: built in 1920 — expect roof / HVAC / electrical / plumbing capex.
Questions for the listing agent
- It's been on market 86 days. Have you received any prior offers? Is the seller open to a 6% concession, seller financing, or rate buy-down credit?
- Built in 1920 — when were the roof, HVAC, electrical panel, plumbing, and water heater last replaced?
- Why hasn't it sold? Are there any deal-killer items the seller is aware of (foundation, flood, title, zoning, code violations)?
- Is there a deadline driving the sale (1031 exchange, divorce, estate, relocation)? That informs how much negotiation room exists.
- Schools are D-rated, which usually means shorter tenancies and higher turnover. Who's the typical renter profile here, and what's been the actual vacancy rate?
- What's the average days-on-market for RENTAL listings here right now (not sales)? A rising rental-DOM trend means longer vacancies and softer asking-rent achievability than the comps imply.
- What's the recent tenant-quality profile in this submarket — average credit score on applications, eviction rate, late-payment / NSF rate, and stable-employment percentage? A property-management company in the area should have these aggregated.
- How much new for-sale + rental construction is in the pipeline within 1–3 miles? Heavy new supply typically softens prices + rents 12–24 months out; constrained supply supports both.
Investment metrics
- 1% rule
- 1.19% ✓
- Cap rate
- 9.55%
- Cash-on-cash
- 11.64%
- DSCR
- 1.52
- GRM
- 7.0
CMA / ARV
- ARV (median comp)
- $94,815
- List price
- $79,900
- Delta
- -15.73%
- Verdict
- UNDERPRICED
- Comps
- 20 within 1.0 mi
Show comp detail 7 sales within ~0.75 mi
| Address | Dist | Beds/Ba | Sqft | Sold | Price | $/sf | Match |
|---|---|---|---|---|---|---|---|
| 311 N East St | 0.45mi | 3/1.0 | 1,072 (-2%) | 9mo | $45,000 | $42 | 69 |
| 409 Congress St | 0.57mi | 3/1.0 | 1,022 (-6%) | 1mo | $154,000 | $151 | 62 |
| 343 N East St | 0.46mi | 2/1.0 (-1) | 1,004 (-8%) | 3mo | $115,000 | $115 | 57 |
| 138 S Carroll St | 0.45mi | 2/1.0 (-1) | 1,144 (+5%) | 19mo | $65,000 | $57 | 50 |
| 255 N Carroll St | 0.56mi | 2/1.0 (-1) | 1,028 (-6%) | 18mo | $60,000 | $58 | 44 |
| 246 W Fulton St | 0.41mi | 3/1.0 | 1,232 (+13%) | 20mo | $18,000 | $15 | 43 |
| 73 N Thorne St | 0.74mi | 2/1.0 (-1) | 1,030 (-6%) | 20mo | $32,500 | $32 | 35 |
Match score weights: distance 35% · size 25% · config 20% · recency 20%. Top-matched comps best support the ARV.
Projected returns pro-forma
-3.0% appreciation · 3.0% rent growth · sell at horizon
- IRR
- 1.0%
- Equity multiple
- 1.04×
- Total profit
- $879
- Equity at exit
- $11,913
- IRR
- 10.7%
- Equity multiple
- 1.83×
- Total profit
- $18,577
- Equity at exit
- $6,908
Cash invested: $22,372 (down + closing). Projections, not guarantees.
Landlord ↔ Tenant lean methodology
- Overall (STATE)
- 90 Strongly Landlord-Friendly
- State Indiana
- 90 Strongly Landlord-Friendly · R+11
- County
- — inherits STATE
- City
- — inherits STATE
ZIP-level market 46992
- Home prices YoY
- -21.3%
- Active inventory
- 37
- Price-to-rent
- 7.0×
Monthly cashflow live
- Estimated rent
- $950 medium interval (Pro) →
- Mortgage (P&I)
- −$419
- Tax from tax record
- −$81 /mo · $970/yr
- Insurance
- −$33
- HOA
- −$0
- Vacancy / Maint / Mgmt
- −$199
- Net cashflow
- $217
Break-even live
Sensitivity live
| Price | -10% $262 | -5% $240 | +0% $217 | +5% $194 | +10% $172 |
|---|---|---|---|---|---|
| Rent | -10% $142 | -5% $180 | +0% $217 | +5% $255 | +10% $292 |
| Rate | -1.0pp $257 | -0.5pp $237 | base $217 | +0.5pp $196 | +1.0pp $175 |
UW: 25.0% down · 7.5% · 30yr · 1.5% tax · 5.0% vac · 8.0% maint · 8.0% mgmt
Financing live
Cash to close
- Down payment
- $19,975
- Closing costs
- $2,397
- Reserves months
- —
- Total cash needed
- —
Loan-product check · same deal, 3 products live
Conventional
25% down · 7.5% · 30yr
- Down + closing
- —
- Monthly P&I
- —
- Monthly cashflow
- —
- DSCR
- —
- Eligible?
- —
Personal DTI + credit; lowest rate.
DSCR
20% down · 8.5% · 30yr
- Down + closing
- —
- Monthly P&I
- —
- Monthly cashflow
- —
- DSCR
- —
- Eligible?
- —
No personal income docs; deal must DSCR.
Hard money
10% down · 12.0% · 12mo
- Down + closing
- —
- Monthly P&I
- —
- Monthly cashflow
- —
- DSCR
- —
- Eligible?
- —
Short-term bridge; refi at stabilization.
Listing history 8 events
-
2026-04-04price $79,900 415-char remark
Show marketing remark (415 chars)
This home has been a rental property for many years. It needs some TLC. Off street parking behind home. Taxes reflect no exemptions. Buyer's agent is responsible for confirming room dimensions. Stove included. Selling as is. Conventional or cash only. Listing agent is owner. Water lines were converted to pex about three years ago, water heater is 3-4 years old. Kitchen cabinets replaced 2-3 years ago. Sold As Is
-
2026-03-02$85,000 Active 415-char remark
Show marketing remark (415 chars)
This home has been a rental property for many years. It needs some TLC. Off street parking behind home. Taxes reflect no exemptions. Buyer's agent is responsible for confirming room dimensions. Stove included. Selling as is. Conventional or cash only. Listing agent is owner. Water lines were converted to pex about three years ago, water heater is 3-4 years old. Kitchen cabinets replaced 2-3 years ago. Sold As Is
-
2018-03-29soldstatus $28,000
-
2018-03-03$37,900
-
2016-02-04$40,900
-
2015-04-28$40,900
-
2014-09-15$45,900
-
2013-12-31$49,500
ⓘ Source: listings_history table (triggers on properties + properties_extension) + one-shot
backfill from property_details.listing_events for pre-trigger history.
Tax reassessment forecast IN · Partial reset (capped growth)
- Current annual tax
- $970 · $81/mo
- Projected year-2 tax
- $970 · $81/mo
- Expected delta
- $0/yr ($0/mo · 0.0%)
ⓘ Screening estimate from a state-policy table — verify with the county assessor before closing.
Climate risk First Street
- Flood 1/10 Low FEMA zone X (unshaded) · 0% chance over 30 yrs
- Wildfire 1/10 Low
- Heat 3/10 Moderate 7 d/yr ≥101°F today · 18 d/yr by 30 yrs out
- Wind 2/10 Low
- Air quality 2/10 Low 1 unhealthy d/yr today · 2 by 30 yrs out
Nearby sold comps map
Loading sold comps map…
Walkable amenities ~0.75 mi
Loading nearby amenities…
Taxation est. · year 1
- Rental income
- $11,395
- − Mortgage interest
- −$4,476
- − Property taxes
- −$970
- − Insurance
- −$400
- − Repairs & maintenance
- −$912
- − Management
- −$912
- − Depreciation
- −$2,324
- Taxable income
- $1,402
- Est. tax owed @ 24.0%
- −$337
- After-tax cash flow
- $2,268/yr
For passive investors: Depreciation is non-cash, so a rental often shows a tax loss while cash-flowing — sheltering income. Rental losses are passive: they offset passive income freely, and up to $25,000/yr can offset ordinary (W-2) income if you actively participate and your MAGI is under $100k (phasing out to $0 by $150k); unused losses carry forward. On sale, claimed depreciation is recaptured at up to 25%, and gains may owe capital-gains tax (a 1031 exchange can defer both). Figures are a year-1 estimate at your 24.0% rate — not tax advice; consult a CPA.
Schools (NCES district)
- District
- Wabash City Schools
- NCES district ID
- 1812150
- Math proficiency
- 21% ▼ -10.00%
- Reading proficiency
- 38% ▼ -7.00%
- Median HH income
- $38,900
- Composite
- 24.66/100
- National rank
- #7622
- State rank
- #249 of 301 in IN
Livability — Wabash
- Score
- 76/100
- State rank
- #48
- US rank
- #3353
Category grades
Schools grade is shown separately in the Schools card above.
Census & demographics
- Census place
- Wabash, IN
- City population
- 16,475
- Population (ZIP)
- 16,475
Population outlook (Wabash County) Hauer SSP2
- Today (2025)
- 30,872 people
- By 2030
- 29,933 · -3.0%
- By 2040
- 27,877 · -9.7%
- By 2050
- 25,887 · -16.1%
- By 2075
- 22,404 · -27.4%
- By 2100
- 19,461 · -37.0%
Race, ethnicity, and origin ACS 2023
- Neighborhood character
- Predominantly White (93%)
- Race & ethnicity
- White 93% Hispanic / Latino 4% Two or more races 3%
- Common ancestry
- Lithuanian 2% Italian 1% Iranian 1%
- Foreign-born
- 1% · Canada
- Languages at home
- 98% English-only · Spanish 1%
Political lean MEDSL · Wabash
- 2024 margin
- Solid R (+50.8) · D 23.9% · R 74.7% · Other 1.4%
- 2008→2024 swing
- -30.7pp toward R · 2008: -20.1pp · 2024: -50.8pp
- All cycles
- 2024: R+50.8 2020: R+49.9 2016: R+50.7 2012: R+36.2 2008: R+20.1
Not yet ingested
- Civics
- —
Market trends
- HPI YoY
- ▼ -59.46%
- Current HPI
- 220.0458
- Rent YoY
- —
- Metro
- —
- State GDP YoY
- ▲ 2.90%
- F500 in state
- 18
Industry mix (Fortune 500 HQ in IN)
| Industry | F500 HQs | Revenue |
|---|---|---|
| Industrial Machinery | 2 | $37B |
|
||
| Healthcare | 1 | $177B |
|
||
| Pharmaceuticals | 1 | $45B |
|
||
| Metals / Steel | 1 | $18B |
|
||
| Agriculture | 1 | $17B |
|
||
| Packaging | 1 | $12B |
|
||
Price history
+61.4% since first listed8 events — show timeline
- 2026-04-04 Price Changed $79,900 IRMLS
- 2026-03-02 Listed $85,000 IRMLS
- 2018-03-29 Sold (MLS) $28,000 IRMLS
- 2018-03-03 Listed $37,900 IRMLS
- 2016-02-04 Listed $40,900 IRMLS
- 2015-04-28 Listed $40,900 IRMLS
- 2014-09-15 Listed $45,900 IRMLS
- 2013-12-31 Listed $49,500 IRMLS
Property tax history
-2.0%/yrLatest (2024): $970 · +2.5% YoY. Source: county tax records.
Cash-flow waterfall
monthlySold comps — $/sqft
last 12 mo · ≤1 miLoading sold comps…