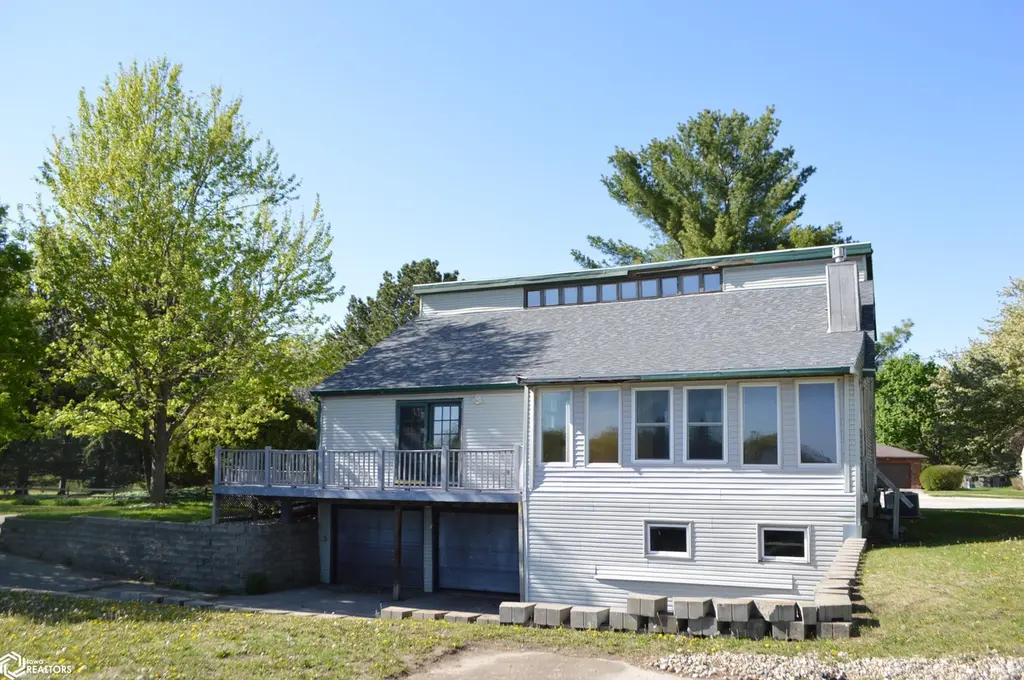
659 3rd Pl SE · Mason City, IA
Flood risk 1/10 · Minimal
- FEMA flood zone
- X (unshaded)
- Chance of flooding over 30 yrs
- 0.0%
- Est. flood insurance / yr
- $473 – $860
Fire risk 1/10 · Minimal
- Est. fire insurance / yr
- $902 – $1,676
Heat risk 2/10 · Minimal
- Hot days now (above 100°F)
- 7 days/yr
- Hot days in 30 yrs
- 16 days/yr
Wind risk 2/10 · Minimal
- Chance of severe wind over 30 yrs
- —
Air-quality risk 1/10 · Minimal
- Unhealthy air days now
- 0 days/yr
- Unhealthy air days in 30 yrs
- 0 days/yr
Risk factors via First Street. Map © Google.
Why this score? — see what drove the B grade
The composite is a weighted blend of 9 inputs, each scored 0–100. Each bar is that input's sub-score; the figure is the points it added to the 100-point composite (weight × sub-score).
- Cash flow +30.0/30.0
- 1% rule +10.0/10.0
- DSCR +10.0/10.0
- ARV discount +7.5/15.0
- Schools +4.5/10.0
- Livability +4.0/5.0
- Rent growth +2.5/5.0
- Condition / age +2.5/5.0
- Appreciation +0.0/10.0
$69,000
🖨 Deal sheet 📄 Offer letter ✓ Due diligence
Listing remarks MLS
Take a look at this 3 bedroom 2 bath home on a large lot. Convenient location near Hwy 122 at the end of a cul-de-sac. 1 Main floor bedroom and full bath, along 2 upper floor bedrooms and another bathroom. Full basement including 2 garage stalls. Open main floor lay-out. Buyer responsible for city required repairs.
Key facts
- Large lot
- Full basement
- Convenient location
Tags
Neighborhood map
What this means for you Summary
Snapshot
- This is a 3-bed/2.0-bath single-family listed at $69k.
Deal economics
- At list price, monthly cash flow is $613 ($7k/yr) — positive.
- The deal already cash-flows at list — no discount required.
- Meets the 1% rule at list price ($1k rent vs $69k).
- Recommended offer: $61k (12.0% below list) — sets the bar for market timing.
- Cap rate 17.0% vs local median 5.2% in Mason City — top-decile yield for the area; either an underpriced asset or a hidden risk that comps aren't pricing in. Stress-test before assuming the spread holds.
Location & tenants
- Location reads 81/100 on livability (#67 in IA, #1,477 nationally) — a professional / high-income tenant draw. Strengths: commute A+, cost of living A+, housing A+; Watch: amenities F.
- Mason City Community School District (town): math 50% / reading 58% proficiency, ranked #271 of 289 in IA (top 94%) — acceptable for families but not a draw, mixed tenant base, ~2y average lease.
- Market conditions: 153 active listings in the ZIP; 54 units permitted in Cerro Gordo County in 2024 (6 in 5+ unit buildings).
Forward outlook
- Local home prices are declining (-3.0%/yr); year-one equity from $477 of loan paydown is wiped out by about $2k of value loss. Plan a longer hold.
- Cerro Gordo County population projected at -18% by 2050 — secular population decline; favor cash flow + early exit over multi-decade hold.
- At projected returns (-3.0% appreciation + 3.0% rent growth), your $19k cash investment doubles in ~4 years — after that, you're playing with house money.
Negotiation context
- It's been on market 182 days — a 12% lower offer ($61k) is reasonable based on typical stale-listing flexibility.
- 6 sale attempts since 5y ago; this cycle's ask has dropped $24k (26%) from the opening price — seller is motivated, your offer sets the floor, not the list.
Questions for the listing agent
- It's been on market 182 days. Have you received any prior offers? Is the seller open to a 12% concession, seller financing, or rate buy-down credit?
- Built in 1976 — when were the roof, HVAC, electrical panel, plumbing, and water heater last replaced?
- Why hasn't it sold? Are there any deal-killer items the seller is aware of (foundation, flood, title, zoning, code violations)?
- Is there a deadline driving the sale (1031 exchange, divorce, estate, relocation)? That informs how much negotiation room exists.
- What's the average days-on-market for RENTAL listings here right now (not sales)? A rising rental-DOM trend means longer vacancies and softer asking-rent achievability than the comps imply.
- What's the recent tenant-quality profile in this submarket — average credit score on applications, eviction rate, late-payment / NSF rate, and stable-employment percentage? A property-management company in the area should have these aggregated.
- How much new for-sale + rental construction is in the pipeline within 1–3 miles? Heavy new supply typically softens prices + rents 12–24 months out; constrained supply supports both.
Investment metrics
- 1% rule
- 2.00% ✓
- Cap rate
- 16.96%
- Cash-on-cash
- 38.10%
- DSCR
- 2.70
- GRM
- 4.2
CMA / ARV
- ARV (median comp)
- $176,270
- List price
- $69,000
- Delta
- -60.86%
- Verdict
- UNDERPRICED
- Comps
- 20 within 1.0 mi
Show comp detail 12 sales within ~0.75 mi
| Address | Dist | Beds/Ba | Sqft | Sold | Price | $/sf | Match |
|---|---|---|---|---|---|---|---|
| 413 S Carolina Ave | 0.13mi | 3/1.8 | 2,220 (-1%) | 7mo | $160,000 | $72 | 85 |
| 706 6th St SE | 0.16mi | 4/2.0 (+1) | 2,184 (-3%) | 0mo | $238,000 | $109 | 82 |
| 215 S Vermont Ave | 0.33mi | 4/2.2 (+1) | 2,267 (+1%) | 4mo | $245,000 | $108 | 74 |
| 943 6th St SE | 0.37mi | 3/1.8 | 2,346 (+4%) | 4mo | $187,000 | $80 | 71 |
| 104 River Heights Dr Dr | 0.18mi | 4/2.2 (+1) | 2,451 (+9%) | 11mo | $288,775 | $118 | 62 |
| 201 S Vermont Ave | 0.33mi | 4/1.8 (+1) | 2,093 (-7%) | 7mo | $180,000 | $86 | 62 |
| 161 Granada Dr Dr | 0.60mi | 3/1.8 | 2,152 (-4%) | 9mo | $325,000 | $151 | 56 |
| 30 Kentucky Ct Ct | 0.46mi | 4/1.8 (+1) | 2,112 (-6%) | 9mo | $265,000 | $125 | 55 |
| 1141 Eastmoor Dr Dr | 0.63mi | 3/2.5 | 2,118 (-6%) | 8mo | $239,900 | $113 | 52 |
| 521 S Kentucky Ave | 0.40mi | 3/2.0 | 1,923 (-15%) | 10mo | $205,543 | $107 | 49 |
| 212 S Ohio Ave | 0.60mi | 3/1.5 | 1,955 (-13%) | 5mo | $130,000 | $66 | 44 |
| 330 E State St | 0.42mi | 4/2.5 (+1) | 1,929 (-14%) | 8mo | $268,000 | $139 | 42 |
Match score weights: distance 35% · size 25% · config 20% · recency 20%. Top-matched comps best support the ARV.
Projected returns pro-forma
-3.0% appreciation · 3.0% rent growth · sell at horizon
- IRR
- 34.2%
- Equity multiple
- 2.44×
- Total profit
- $27,913
- Equity at exit
- $10,288
- IRR
- 41.1%
- Equity multiple
- 4.87×
- Total profit
- $74,703
- Equity at exit
- $5,966
Cash invested: $19,320 (down + closing). Projections, not guarantees.
Landlord ↔ Tenant lean methodology
- Overall (STATE)
- 83 Strongly Landlord-Friendly
- State Iowa
- 83 Strongly Landlord-Friendly · R+6
- County
- — inherits STATE
- City
- — inherits STATE
ZIP-level market 50401
- Active inventory
- 153
- Price-to-rent
- 4.2×
Monthly cashflow live
- Estimated rent
- $1,380 medium interval (Pro) →
- Mortgage (P&I)
- −$362
- Tax est. 1.5%
- −$86 /mo · $1,035/yr
- Insurance
- −$29
- HOA
- −$0
- Vacancy / Maint / Mgmt
- −$290
- Net cashflow
- $613
Break-even live
UW: 25.0% down · 7.5% · 30yr · 1.5% tax · 5.0% vac · 8.0% maint · 8.0% mgmt
Financing live
Cash to close
- Down payment
- $17,250
- Closing costs
- $2,070
- Reserves months
- —
- Total cash needed
- —
Loan-product check · same deal, 3 products live
Conventional
25% down · 7.5% · 30yr
- Down + closing
- —
- Monthly P&I
- —
- Monthly cashflow
- —
- DSCR
- —
- Eligible?
- —
Personal DTI + credit; lowest rate.
DSCR
20% down · 8.5% · 30yr
- Down + closing
- —
- Monthly P&I
- —
- Monthly cashflow
- —
- DSCR
- —
- Eligible?
- —
No personal income docs; deal must DSCR.
Hard money
10% down · 12.0% · 12mo
- Down + closing
- —
- Monthly P&I
- —
- Monthly cashflow
- —
- DSCR
- —
- Eligible?
- —
Short-term bridge; refi at stabilization.
Listing history 32 events
-
2026-06-18days on market $69,000 Active 182 DOM
-
2026-06-17days on market $69,000 Active 181 DOM
-
2026-06-16days on market $69,000 Active 180 DOM
-
2026-06-15days on market $69,000 Active 179 DOM
-
2026-06-13days on market $69,000 Active 177 DOM
-
2026-06-12days on market $69,000 Active 176 DOM
-
2026-06-09days on market $69,000 Active 173 DOM
-
2026-06-08days on market $69,000 Active 172 DOM
-
2026-06-07days on market $69,000 Active 171 DOM
-
2026-06-07days on market $69,000 Active 170 DOM
-
2026-06-04days on market $69,000 Active 167 DOM
-
2026-06-02days on market $69,000 Active 166 DOM
-
2026-06-01days on market $69,000 Active 165 DOM
-
2026-05-31days on market $69,000 Active 164 DOM
-
2026-05-31days on market $69,000 Active 163 DOM
-
2026-05-04price $69,000 316-char remark
Show marketing remark (316 chars)
Take a look at this 3 bedroom 2 bath home on a large lot. Convenient location near Hwy 122 at the end of a cul-de-sac. 1 Main floor bedroom and full bath, along 2 upper floor bedrooms and another bathroom. Full basement including 2 garage stalls. Open main floor lay-out. Buyer responsible for city required repairs.
-
2026-04-25status Active 316-char remark
Show marketing remark (316 chars)
Take a look at this 3 bedroom 2 bath home on a large lot. Convenient location near Hwy 122 at the end of a cul-de-sac. 1 Main floor bedroom and full bath, along 2 upper floor bedrooms and another bathroom. Full basement including 2 garage stalls. Open main floor lay-out. Buyer responsible for city required repairs.
-
2026-04-23status Pending 316-char remark
Show marketing remark (316 chars)
Take a look at this 3 bedroom 2 bath home on a large lot. Convenient location near Hwy 122 at the end of a cul-de-sac. 1 Main floor bedroom and full bath, along 2 upper floor bedrooms and another bathroom. Full basement including 2 garage stalls. Open main floor lay-out. Buyer responsible for city required repairs.
-
2026-03-23price $74,900 316-char remark
Show marketing remark (316 chars)
Take a look at this 3 bedroom 2 bath home on a large lot. Convenient location near Hwy 122 at the end of a cul-de-sac. 1 Main floor bedroom and full bath, along 2 upper floor bedrooms and another bathroom. Full basement including 2 garage stalls. Open main floor lay-out. Buyer responsible for city required repairs.
-
2026-02-19price $79,900 316-char remark
Show marketing remark (316 chars)
Take a look at this 3 bedroom 2 bath home on a large lot. Convenient location near Hwy 122 at the end of a cul-de-sac. 1 Main floor bedroom and full bath, along 2 upper floor bedrooms and another bathroom. Full basement including 2 garage stalls. Open main floor lay-out. Buyer responsible for city required repairs.
-
2026-01-17price $87,000 316-char remark
Show marketing remark (316 chars)
Take a look at this 3 bedroom 2 bath home on a large lot. Convenient location near Hwy 122 at the end of a cul-de-sac. 1 Main floor bedroom and full bath, along 2 upper floor bedrooms and another bathroom. Full basement including 2 garage stalls. Open main floor lay-out. Buyer responsible for city required repairs.
-
2025-12-15$92,900 Active 316-char remark
Show marketing remark (316 chars)
Take a look at this 3 bedroom 2 bath home on a large lot. Convenient location near Hwy 122 at the end of a cul-de-sac. 1 Main floor bedroom and full bath, along 2 upper floor bedrooms and another bathroom. Full basement including 2 garage stalls. Open main floor lay-out. Buyer responsible for city required repairs.
-
2025-07-15status Active
-
2025-07-14historical
-
2025-07-04price $134,900
-
2025-06-12price $139,900
-
2025-05-13status Active
-
2025-05-13price $211,000
-
2025-03-10$217,300 Active
-
2022-03-03soldstatus $205,000
-
2022-03-01soldstatus $205,000
-
2021-09-27$220,000
ⓘ Source: listings_history table (triggers on properties + properties_extension) + one-shot
backfill from property_details.listing_events for pre-trigger history.
Climate risk First Street
- Flood 1/10 Low FEMA zone X (unshaded) · 0% chance over 30 yrs
- Wildfire 1/10 Low
- Heat 2/10 Low 7 d/yr ≥100°F today · 16 d/yr by 30 yrs out
- Wind 2/10 Low
- Air quality 1/10 Low 0 unhealthy d/yr today · 0 by 30 yrs out
Nearby sold comps map
Loading sold comps map…
Walkable amenities ~0.75 mi
Loading nearby amenities…
Taxation est. · year 1
- Rental income
- $16,562
- − Mortgage interest
- −$3,865
- − Property taxes
- −$1,035
- − Insurance
- −$345
- − Repairs & maintenance
- −$1,325
- − Management
- −$1,325
- − Depreciation
- −$2,007
- Taxable income
- $6,660
- Est. tax owed @ 24.0%
- −$1,598
- After-tax cash flow
- $5,763/yr
For passive investors: Depreciation is non-cash, so a rental often shows a tax loss while cash-flowing — sheltering income. Rental losses are passive: they offset passive income freely, and up to $25,000/yr can offset ordinary (W-2) income if you actively participate and your MAGI is under $100k (phasing out to $0 by $150k); unused losses carry forward. On sale, claimed depreciation is recaptured at up to 25%, and gains may owe capital-gains tax (a 1031 exchange can defer both). Figures are a year-1 estimate at your 24.0% rate — not tax advice; consult a CPA.
Schools (NCES district)
- District
- Mason City Community School District
- NCES district ID
- 1918780
- Math proficiency
- 50% ▼ -1.00%
- Reading proficiency
- 58% ▼ -7.00%
- Median HH income
- $43,668
- Composite
- 45.47/100
- National rank
- #2614
- State rank
- #271 of 289 in IA
Livability — Mason City
- Score
- 81/100
- State rank
- #67
- US rank
- #1477
Category grades
Schools grade is shown separately in the Schools card above.
Census & demographics
- Census place
- Mason City, IA
- City population
- 28,818
- Population (ZIP)
- 28,818
Population outlook (Cerro Gordo County) Hauer SSP2
- Today (2025)
- 41,080 people
- By 2030
- 39,746 · -3.2%
- By 2040
- 36,608 · -10.9%
- By 2050
- 33,682 · -18.0%
- By 2075
- 29,702 · -27.7%
- By 2100
- 27,399 · -33.3%
Race, ethnicity, and origin ACS 2023
- Neighborhood character
- Predominantly White (87%)
- Race & ethnicity
- White 87% Hispanic / Latino 6% Two or more races 5% Black 3% Asian 1%
- Hispanic origin (detail)
- Mexican 5%
- Common ancestry
- Portuguese 12% Iranian 2% Lithuanian 2%
- Foreign-born
- 2% · Canada, Vietnam
- Languages at home
- 96% English-only · Spanish 3% Other Asian/Pacific 1%
Political lean MEDSL · Cerro Gordo
- 2024 margin
- R (+11.7) · D 43.4% · R 55.0% · Other 1.6%
- 2008→2024 swing
- -32.5pp toward R · 2008: 20.8pp · 2024: -11.7pp
- All cycles
- 2024: R+11.7 2020: R+6.3 2016: R+7.7 2012: D+13.2 2008: D+20.8
Not yet ingested
- Civics
- —
Market trends
- HPI YoY
- ▼ -130.01%
- Current HPI
- 199.1966
- Rent YoY
- —
- Metro
- —
- State GDP YoY
- ▲ 2.48%
- F500 in state
- 4
Industry mix (Fortune 500 HQ in IA)
| Industry | F500 HQs | Revenue |
|---|---|---|
| Financial Services | 1 | $16B |
|
||
| Retail / Convenience | 1 | $15B |
|
||
Price history
-68.6% since first listed17 events — show timeline
- 2026-05-04 Price Changed $69,000 IAR
- 2026-04-25 Relisted — IAR
- 2026-04-23 Pending — IAR
- 2026-03-23 Price Changed $74,900 IAR
- 2026-02-19 Price Changed $79,900 IAR
- 2026-01-17 Price Changed $87,000 IAR
- 2025-12-15 Listed $92,900 IAR
- 2025-07-15 Relisted — IAR
- 2025-07-14 Delisted — IAR
- 2025-07-04 Price Changed $134,900 IAR
- 2025-06-12 Price Changed $139,900 IAR
- 2025-05-13 Relisted — IAR
- 2025-05-13 Price Changed $211,000 IAR
- 2025-03-10 Listed $217,300 IAR
- 2022-03-03 Sold (Public Records) $205,000 Public Records
- 2022-03-01 Sold (MLS) $205,000 Greater Mason BOR
- 2021-09-27 Listed $220,000 Greater Mason BOR
Property tax history
+4.3%/yrLatest (2025): $3,824 · +2.9% YoY. Source: county tax records.
Cash-flow waterfall
monthlySold comps — $/sqft
last 12 mo · ≤1 miLoading sold comps…