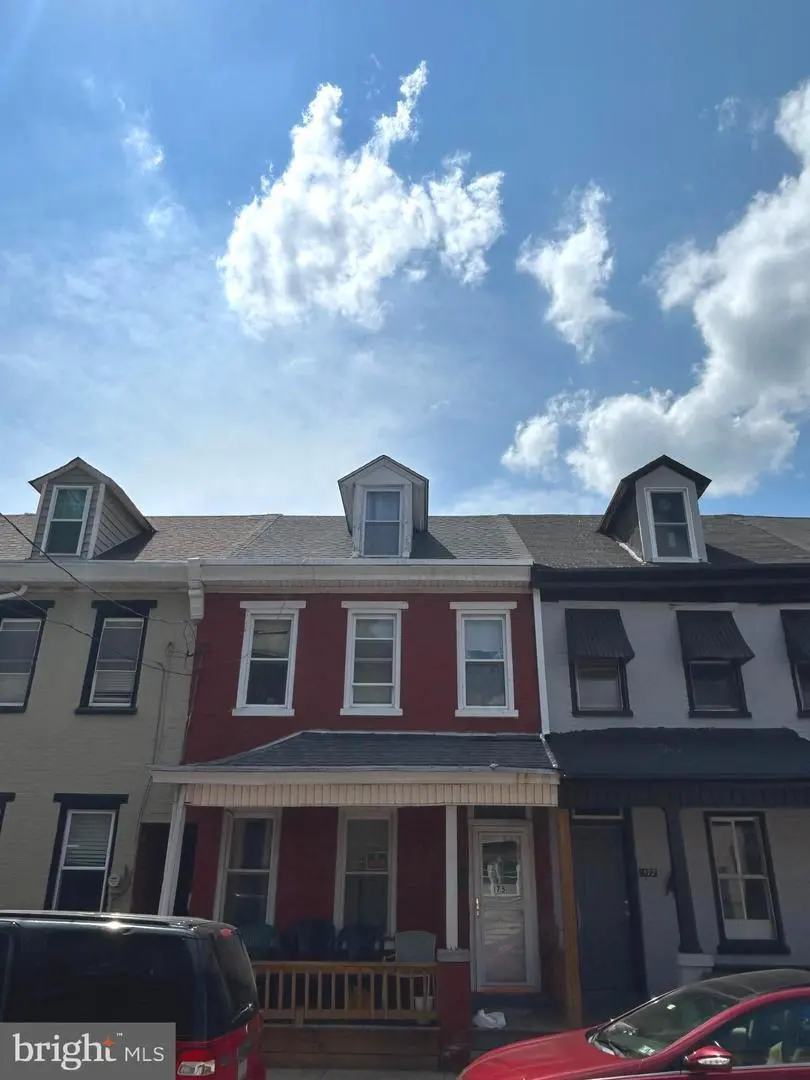
175 N Franklin St · Pottstown, PA
Flood risk 1/10 · Minimal
- FEMA flood zone
- X (unshaded)
- Chance of flooding over 30 yrs
- 0.0%
- Est. flood insurance / yr
- $473 – $860
Fire risk 1/10 · Minimal
- Est. fire insurance / yr
- $511 – $949
Heat risk 6/10 · Moderate
- Hot days now (above 101°F)
- 7 days/yr
- Hot days in 30 yrs
- 15 days/yr
Wind risk 5/10 · Moderate
- Chance of severe wind over 30 yrs
- 23.0%
Air-quality risk 2/10 · Minimal
- Unhealthy air days now
- 1 days/yr
- Unhealthy air days in 30 yrs
- 3 days/yr
Risk factors via First Street. Map © Google.
Why this score? — see what drove the C+ grade
The composite is a weighted blend of 9 inputs, each scored 0–100. Each bar is that input's sub-score; the figure is the points it added to the 100-point composite (weight × sub-score).
- Cash flow +25.2/30.0
- ARV discount +13.1/15.0
- DSCR +8.3/10.0
- 1% rule +6.5/10.0
- Rent growth +3.7/5.0
- Livability +3.6/5.0
- Condition / age +2.5/5.0
- Schools +1.5/10.0
- Appreciation +0.0/10.0
$149,900
🖨 Deal sheet 📄 Offer letter ✓ Due diligence
Listing remarks MLS
Welcome to 175 N Franklin - New ROOF & DECK in 2023 as well as a NEW PORCH 2024. Equipped with Central Air, Electric Heat & a fenced backyard. Almost 1600 sq ft & Taxes at $2,042. This could be ideal for investors looking in Pottstown, or possibly a first time home buyer. All dimensions of lots and building/room sizes are estimated and should be verified by consumer/buyer for accuracy.
Key facts
- Built 1892
- Listed 70 days
Neighborhood map
What this means for you Summary
Snapshot
- This is a 2-bed/1.0-bath townhouse listed at $150k.
Deal economics
- At list price, monthly cash flow is $337 ($4k/yr) — positive.
- The deal already cash-flows at list — no discount required.
- Meets the 1% rule at list price ($2k rent vs $150k).
- Recommended offer: $141k (6.0% below list) — sets the bar for market timing.
- Cap rate 9.0% vs local median 5.0% in Pottstown — top-decile yield for the area; either an underpriced asset or a hidden risk that comps aren't pricing in. Stress-test before assuming the spread holds.
Location & tenants
- Location reads 72/100 on livability (#643 in PA) — a middle-class / working-renter tenant base. Strengths: cost of living A+, housing A+, health & safety A+; Watch: amenities C-, employment D+, crime F.
- Pottstown SD (suburban): math 11% / reading 23% proficiency, ranked #504 of 539 in PA (top 94%) — low school quality limits family demand, transient renter base, plan for 1-2y turnover; 62% free/reduced lunch — lower-income household profile, screen leases tightly.
- Market conditions: Rents rising fast (+4.9%/yr); 202 active listings in the ZIP; 19 comparable units currently listed for rent nearby; rentals at typical pace (median 25d on market — plan ~3-4 weeks tenant-placement turnaround); solid renter incomes; 1,936 units permitted in Montgomery County in 2024 (530 in 5+ unit buildings).
Forward outlook
- Local home prices are declining (-3.0%/yr); year-one equity from $1k of loan paydown is wiped out by about $4k of value loss. Plan a longer hold.
- Montgomery County population projected at +5% by 2050 — modest demand growth; plan on rents tracking national, not racing it.
- At projected returns (-3.0% appreciation + 4.9% rent growth), your $42k cash investment doubles in ~9 years — after that, you're playing with house money.
Negotiation context
- It's been on market 70 days — a 6% lower offer ($141k) is reasonable based on typical stale-listing flexibility.
- 7 sale attempts since 32y ago; this cycle's ask has dropped $10k (6%) from the opening price — seller is motivated, your offer sets the floor, not the list.
- Current owner paid $80k; list at $150k implies a 87% gain — meaningful room to come down on a strong offer.
Risks & watch-outs
- Watch-outs: built in 1892 — expect roof / HVAC / electrical / plumbing capex.
- Climate carrying-cost: moderate wind risk, 23% chance of damaging wind over 30y; extreme-heat days projected 7→15/yr by 2055 (HVAC capex compounding) — expect insurance premiums to compound above CPI over the hold.
Questions for the listing agent
- It's been on market 70 days. Have you received any prior offers? Is the seller open to a 6% concession, seller financing, or rate buy-down credit?
- Built in 1892 — when were the roof, HVAC, electrical panel, plumbing, and water heater last replaced?
- Why hasn't it sold? Are there any deal-killer items the seller is aware of (foundation, flood, title, zoning, code violations)?
- Is there a deadline driving the sale (1031 exchange, divorce, estate, relocation)? That informs how much negotiation room exists.
- Schools are B-rated — typically a magnet for longer-tenancy family renters. What's the average tenant stay here, and is there a school-zone premium baked into asking?
- Crime grade is F in this area — have there been break-ins, vandalism, or insurance claims at this property in the last 3 years? What carrier currently insures it and at what premium?
- What's the average days-on-market for RENTAL listings here right now (not sales)? A rising rental-DOM trend means longer vacancies and softer asking-rent achievability than the comps imply.
- What's the recent tenant-quality profile in this submarket — average credit score on applications, eviction rate, late-payment / NSF rate, and stable-employment percentage? A property-management company in the area should have these aggregated.
- How much new for-sale + rental construction is in the pipeline within 1–3 miles? Heavy new supply typically softens prices + rents 12–24 months out; constrained supply supports both.
Investment metrics
- 1% rule
- 1.15% ✓
- Cap rate
- 8.99%
- Cash-on-cash
- 9.62%
- DSCR
- 1.43
- GRM
- 7.2
CMA / ARV
- ARV (median comp)
- $171,179
- List price
- $149,900
- Delta
- -12.43%
- Verdict
- UNDERPRICED
- Comps
- 20 within 1.0 mi
Show comp detail 12 sales within ~0.75 mi
| Address | Dist | Beds/Ba | Sqft | Sold | Price | $/sf | Match |
|---|---|---|---|---|---|---|---|
| 527 May St | 0.24mi | 3/2.5 (+1) | 1,466 (-8%) | 1mo | $289,500 | $197 | 64 |
| 521 May St | 0.24mi | 3/2.5 (+1) | 1,466 (-8%) | 10mo | $255,000 | $174 | 57 |
| 121 S Penn St | 0.51mi | 3/2.5 (+1) | 1,520 (-5%) | 1mo | $285,000 | $188 | 56 |
| 474 N Franklin St | 0.29mi | 3/1.0 (+1) | 1,382 (-13%) | 5mo | $183,500 | $133 | 55 |
| 361 Cherry St | 0.46mi | 3/1.5 (+1) | 1,693 (+6%) | 11mo | $199,999 | $118 | 52 |
| 123 Cobbler Ln | 0.50mi | 3/1.5 (+1) | 1,520 (-5%) | 13mo | $250,000 | $164 | 51 |
| 243 Peach St | 0.49mi | 3/2.5 (+1) | 1,520 (-5%) | 12mo | $275,000 | $181 | 48 |
| 52 W 3rd St | 0.64mi | 3/1.5 (+1) | 1,510 (-5%) | 9mo | $245,000 | $162 | 47 |
| 123 S Penn St | 0.52mi | 3/2.5 (+1) | 1,520 (-5%) | 13mo | $285,000 | $188 | 46 |
| 383 Spruce St | 0.31mi | 3/1.5 (+1) | 1,398 (-12%) | 14mo | $200,000 | $143 | 46 |
| 75 W 4th St | 0.68mi | 3/1.0 (+1) | 1,420 (-11%) | 2mo | $195,000 | $137 | 43 |
| 854 Queen St | 0.70mi | 3/1.5 (+1) | 1,456 (-9%) | 8mo | $239,000 | $164 | 40 |
Match score weights: distance 35% · size 25% · config 20% · recency 20%. Top-matched comps best support the ARV.
Projected returns pro-forma
-3.0% appreciation · 4.93% rent growth · sell at horizon
- IRR
- 0.4%
- Equity multiple
- 1.01×
- Total profit
- $585
- Equity at exit
- $22,351
- IRR
- 11.9%
- Equity multiple
- 2.02×
- Total profit
- $42,786
- Equity at exit
- $12,961
Cash invested: $41,972 (down + closing). Projections, not guarantees.
Landlord ↔ Tenant lean methodology
- Overall (STATE)
- 62 Landlord-Friendly
- State Pennsylvania
- 62 Landlord-Friendly · EVEN
- County
- — inherits STATE
- City
- — inherits STATE
ZIP-level market 19464
- Rents YoY
- 4.9%
- Active inventory
- 202
- Price-to-rent
- 7.2×
Monthly cashflow live
- Estimated rent
- $1,727 high interval (Pro) →
- Mortgage (P&I)
- −$786
- Tax from tax record
- −$179 /mo · $2,147/yr
- Insurance
- −$62
- HOA
- −$0
- Vacancy / Maint / Mgmt
- −$363
- Net cashflow
- $337
Break-even live
UW: 25.0% down · 7.5% · 30yr · 1.5% tax · 5.0% vac · 8.0% maint · 8.0% mgmt
Financing live
Cash to close
- Down payment
- $37,475
- Closing costs
- $4,497
- Reserves months
- —
- Total cash needed
- —
Loan-product check · same deal, 3 products live
Conventional
25% down · 7.5% · 30yr
- Down + closing
- —
- Monthly P&I
- —
- Monthly cashflow
- —
- DSCR
- —
- Eligible?
- —
Personal DTI + credit; lowest rate.
DSCR
20% down · 8.5% · 30yr
- Down + closing
- —
- Monthly P&I
- —
- Monthly cashflow
- —
- DSCR
- —
- Eligible?
- —
No personal income docs; deal must DSCR.
Hard money
10% down · 12.0% · 12mo
- Down + closing
- —
- Monthly P&I
- —
- Monthly cashflow
- —
- DSCR
- —
- Eligible?
- —
Short-term bridge; refi at stabilization.
Rent comps 19 comps
| Address | Beds | Baths | Sqft | Rent | $/sqft | DOM | Units | Dist |
|---|---|---|---|---|---|---|---|---|
| 415 Walnut St Unit 1 Pottstown, PA | 3.0 | 1.0 | 1730 | $1,800 | $1.04 | 24d | 1 | 0.09mi |
| 457 Walnut St Pottstown, PA | 3.0 | 1.0 | 1274 | $1,600 | $1.26 | 44d | 1 | 0.15mi |
| 262 Beech St Unit 2 Pottstown, PA | 2.0 | 1.0 | 1841 | $1,550 | $0.84 | 24d | 1 | 0.18mi |
| 220 N Penn St Unit 1 Pottstown, PA | 3.0 | 1.0 | 1184 | $1,700 | $1.44 | 24d | 1 | 0.21mi |
| 541 Lincoln Ave Pottstown, PA | 3.0 | 1.0 | 1094 | $1,975 | $1.81 | 24d | 1 | 0.24mi |
| 614 Beech St Pottstown, PA | 3.0 | 1.5 | 1360 | $1,900 | $1.40 | 44d | 1 | 0.30mi |
| 226 Warren St Pottstown, PA | 3.0 | 1.5 | 1180 | $2,050 | $1.74 | 17d | 1 | 0.31mi |
| 130 E 4th St Unit 2 Pottstown, PA | 3.0 | 1.0 | 1808 | $1,850 | $1.02 | 44d | 1 | 0.33mi |
| 122 E 3rd St Unit 3 Pottstown, PA | 2.0 | 1.0 | 1200 | $1,400 | $1.17 | 44d | 1 | 0.36mi |
| 646 Chestnut St Unit 3 Pottstown, PA | 1.0 | 1.0 | 2142 | $1,200 | $0.56 | 22d | 1 | 0.40mi |
| 48 Chestnut St #2 Pottstown, PA | 3.0 | 1.0 | 1100 | $1,700 | $1.55 | 44d | 1 | 0.49mi |
| 5 E 2nd St Pottstown, PA | 3.0 | 1.5 | 1085 | $2,000 | $1.84 | 3d | 1 | 0.50mi |
| 19 Beech St Pottstown, PA | 2.0 | 1.0 | 2000 | $1,650 | $0.82 | 44d | 1 | 0.53mi |
| 657 N Charlotte St Unit 2 Pottstown, PA | 2.0 | 1.0 | 1050 | $1,700 | $1.62 | 1d | 1 | 0.54mi |
| 422 Upland St Pottstown, PA | 2.0–3.0 | 1.0–2.0 | 1082 | $1,650 | $1.52 | 1d | 5 | 0.96mi |
| 110 W Harmony Dr #107 Pottstown, PA | 2.0 | 2.0 | 1248 | $2,000 | $1.60 | 1d | 1 | 1.19mi |
| 644 Kline Ave Pottstown, PA | 2.0 | 1.0–1.5 | 1103 | $2,195 | $1.99 | 1d | 2 | 1.20mi |
| 1318 Cherry St Pottstown, PA | 3.0 | 2.0 | 1240 | $2,250 | $1.81 | 1d | 1 | 1.35mi |
| 1412 Cherry Ln Pottstown, PA | 3.0 | 1.0 | 1080 | $2,200 | $2.04 | 1d | 1 | 1.43mi |
Listing history 29 events
-
2026-06-08status $149,900 Pending 70 DOM
-
2026-05-31days on market $149,900 Active 70 DOM
-
2026-04-24price $149,900 406-char remark
Show marketing remark (406 chars)
Welcome to 175 N Franklin - New ROOF & DECK in 2023 as well as a NEW PORCH 2024. Equipped with Central Air, Electric Heat & a fenced backyard. Almost 1600 sq ft & Taxes at $2,042. This could be ideal for investors looking in Pottstown, or possibly a first time home buyer. All dimensions of lots and building/room sizes are estimated and should be verified by consumer/buyer for accuracy.
-
2026-03-23$159,900 Active 406-char remark
Show marketing remark (406 chars)
Welcome to 175 N Franklin - New ROOF & DECK in 2023 as well as a NEW PORCH 2024. Equipped with Central Air, Electric Heat & a fenced backyard. Almost 1600 sq ft & Taxes at $2,042. This could be ideal for investors looking in Pottstown, or possibly a first time home buyer. All dimensions of lots and building/room sizes are estimated and should be verified by consumer/buyer for accuracy.
-
2026-03-22historical $159,900 406-char remark
Show marketing remark (406 chars)
Welcome to 175 N Franklin - New ROOF & DECK in 2023 as well as a NEW PORCH 2024. Equipped with Central Air, Electric Heat & a fenced backyard. Almost 1600 sq ft & Taxes at $2,042. This could be ideal for investors looking in Pottstown, or possibly a first time home buyer. All dimensions of lots and building/room sizes are estimated and should be verified by consumer/buyer for accuracy.
-
2025-10-06historical
-
2025-09-10price $169,900
-
2025-07-28$184,900 Active
-
2023-04-12soldstatus $80,000
-
2018-07-30soldstatus $40,000
-
2017-04-04historical
-
2017-03-31soldstatus $37,500
-
2017-03-31soldstatus $37,500 Sold
-
2017-03-08status Under Contract
-
2017-02-24price $39,900
-
2016-09-16price $49,900
-
2016-09-14price $54,900
-
2016-01-19price $59,900
-
2015-10-01$69,900 Active
-
2015-09-21$39,900
-
2010-09-17historical
-
2010-06-17$79,900
-
2010-05-27historical
-
2009-11-09$49,900
-
2005-12-01soldstatus $35,000
-
1994-11-02soldstatus $17,500
-
1994-10-31soldstatus $17,500
-
1994-10-27historical
-
1994-10-21$17,500
ⓘ Source: listings_history table (triggers on properties + properties_extension) + one-shot
backfill from property_details.listing_events for pre-trigger history.
Tax reassessment forecast PA · Partial reset (capped growth)
- Current annual tax
- $2,147 · $179/mo
- Projected year-2 tax
- $2,258 · $188/mo
- Expected delta
- +$111/yr (+$9/mo · 5.2%)
ⓘ Screening estimate from a state-policy table — verify with the county assessor before closing.
Climate risk First Street
- Flood 1/10 Low FEMA zone X (unshaded) · 0% chance over 30 yrs
- Wildfire 1/10 Low
- Heat 6/10 Major 7 d/yr ≥101°F today · 15 d/yr by 30 yrs out
- Wind 5/10 Major 23% chance of damaging wind over 30 yrs
- Air quality 2/10 Low 1 unhealthy d/yr today · 3 by 30 yrs out
Nearby sold comps map
Loading sold comps map…
Walkable amenities ~0.75 mi
Loading nearby amenities…
Taxation est. · year 1
- Rental income
- $20,720
- − Mortgage interest
- −$8,397
- − Property taxes
- −$2,147
- − Insurance
- −$750
- − Repairs & maintenance
- −$1,658
- − Management
- −$1,658
- − Depreciation
- −$4,361
- Taxable income
- $1,751
- Est. tax owed @ 24.0%
- −$420
- After-tax cash flow
- $3,619/yr
For passive investors: Depreciation is non-cash, so a rental often shows a tax loss while cash-flowing — sheltering income. Rental losses are passive: they offset passive income freely, and up to $25,000/yr can offset ordinary (W-2) income if you actively participate and your MAGI is under $100k (phasing out to $0 by $150k); unused losses carry forward. On sale, claimed depreciation is recaptured at up to 25%, and gains may owe capital-gains tax (a 1031 exchange can defer both). Figures are a year-1 estimate at your 24.0% rate — not tax advice; consult a CPA.
Schools (NCES district)
- District
- Pottstown SD
- NCES district ID
- 4219680
- Math proficiency
- 11% ▼ -12.00%
- Reading proficiency
- 23% ▼ -19.00%
- Median HH income
- $43,739
- Composite
- 14.78/100
- National rank
- #9390
- State rank
- #504 of 539 in PA
Livability — Pottstown
- Score
- 72/100
- State rank
- #643
- US rank
- #6257
Category grades
Schools grade is shown separately in the Schools card above.
Census & demographics
- Census place
- Pottstown, PA
- County
- Montgomery County · 712,331 people
- City population
- 49,101
- Metro
- Philadelphia-Camden-Wilmington, PA-NJ-DE-MD
- Population (ZIP)
- 49,101
- Household income
- $79,787
- Rent vs Own
- Severe rent burden
- 1797.0
Population outlook (Montgomery County) Hauer SSP2
- Today (2025)
- 856,074 people
- By 2030
- 870,887 · +1.7%
- By 2040
- 891,195 · +4.1%
- By 2050
- 896,417 · +4.7%
- By 2075
- 903,212 · +5.5%
- By 2100
- 843,240 · -1.5%
Race, ethnicity, and origin ACS 2023
- Neighborhood character
- Predominantly White (69%)
- Race & ethnicity
- White 69% Black 15% Two or more races 9% Hispanic / Latino 9% Asian 2%
- Hispanic origin (detail)
- Mexican 2% Puerto Rican 5%
- Common ancestry
- Romanian 7% Polish 2% Iranian 2%
- Foreign-born
- 6% · Canada, China
- Languages at home
- 92% English-only · Spanish 4% Arabic 1% Other Indo-European 1%
Political lean MEDSL · Montgomery
- 2024 margin
- Strong D (+22.8) · D 60.9% · R 38.1% · Other 1.1%
- 2008→2024 swing
- +2.0pp toward D · 2008: 20.8pp · 2024: 22.8pp
- All cycles
- 2024: D+22.8 2020: D+26.3 2016: D+21.1 2012: D+14.3 2008: D+20.8
Not yet ingested
- Civics
- —
Market trends
- HPI YoY
- ▼ -253.73%
- Current HPI
- 271.9399
- Rent YoY
- ▲ 4.93%
- Metro
- Philadelphia-Camden-Wilmington, PA-NJ-DE-MD
- State GDP YoY
- ▲ 1.68%
- F500 in state
- 34
Industry mix (Fortune 500 HQ in PA)
| Industry | F500 HQs | Revenue |
|---|---|---|
| Healthcare | 2 | $309B |
|
||
| Insurance | 2 | $27B |
|
||
| Telecommunications / Media | 1 | $124B |
|
||
| Industrial Distribution | 1 | $22B |
|
||
| Financial Services | 1 | $20B |
|
||
| Chemicals / Materials | 1 | $18B |
|
||
Price history
+756.6% since first listed27 events — show timeline
- 2026-04-24 Price Changed $149,900 BRIGHT MLS
- 2026-03-23 Listed $159,900 BRIGHT MLS
- 2026-03-22 Coming Soon $159,900 BRIGHT MLS
- 2025-10-06 Listing Removed — BRIGHT MLS
- 2025-09-10 Price Changed $169,900 BRIGHT MLS
- 2025-07-28 Listed $184,900 BRIGHT MLS
- 2023-04-12 Sold (Public Records) $80,000 Public Records
- 2018-07-30 Sold (Public Records) $40,000 Public Records
- 2017-04-04 Listing Removed — BRIGHT MLS
- 2017-03-31 Sold (MLS) $37,500 TREND
- 2017-03-31 Sold (MLS) $37,500 BRIGHT MLS
- 2017-03-08 Pending — TREND
- 2017-02-24 Price Changed $39,900 TREND
- 2016-09-16 Price Changed $49,900 TREND
- 2016-09-14 Price Changed $54,900 TREND
- 2016-01-19 Price Changed $59,900 TREND
- 2015-10-01 Listed $69,900 TREND
- 2015-09-21 Listed $39,900 BRIGHT MLS
- 2010-09-17 Listing Removed — BRIGHT MLS
- 2010-06-17 Listed $79,900 BRIGHT MLS
- 2010-05-27 Listing Removed — BRIGHT MLS
- 2009-11-09 Listed $49,900 BRIGHT MLS
- 2005-12-01 Sold (Public Records) $35,000 Public Records
- 1994-11-02 Sold (Public Records) $17,500 Public Records
- 1994-10-31 Sold (MLS) $17,500 BRIGHT MLS
- 1994-10-27 Listing Removed — BRIGHT MLS
- 1994-10-21 Listed $17,500 BRIGHT MLS
Property tax history
+2.1%/yrLatest (2026): $2,147 · +5.1% YoY. Source: county tax records.
Cash-flow waterfall
monthlySold comps — $/sqft
last 12 mo · ≤1 miLoading sold comps…