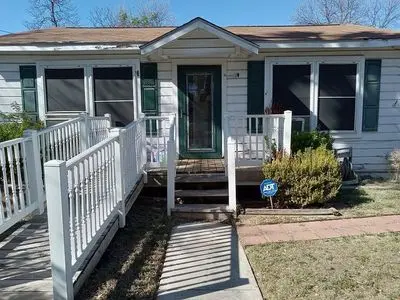
2315 Clower · San Antonio, TX
Flood risk 1/10 · Minimal
- FEMA flood zone
- X (unshaded)
- Chance of flooding over 30 yrs
- 0.0%
- Est. flood insurance / yr
- $507 – $1,088
Fire risk 1/10 · Minimal
- Est. fire insurance / yr
- $1,222 – $2,270
Heat risk 8/10 · Major
- Hot days now (above 108°F)
- 7 days/yr
- Hot days in 30 yrs
- 22 days/yr
Wind risk 6/10 · Moderate
- Chance of severe wind over 30 yrs
- 77.0%
Air-quality risk 2/10 · Minimal
- Unhealthy air days now
- 1 days/yr
- Unhealthy air days in 30 yrs
- 1 days/yr
Risk factors via First Street. Map © Google.
Why this score? — see what drove the C+ grade
The composite is a weighted blend of 9 inputs, each scored 0–100. Each bar is that input's sub-score; the figure is the points it added to the 100-point composite (weight × sub-score).
- Cash flow +24.7/30.0
- 1% rule +9.2/10.0
- DSCR +8.0/10.0
- ARV discount +7.5/15.0
- Livability +4.0/5.0
- Rent growth +3.2/5.0
- Condition / age +2.5/5.0
- Schools +1.4/10.0
- Appreciation +0.0/10.0
$95,000
🖨 Deal sheet 📄 Offer letter ✓ Due diligence
Listing remarks
Hello everyone! I & acirc; & euro; & trade; m selling a 3-bedroom, 2-bath home in the Los Angeles Heights / Keystone neighborhood. This is a classic 1947 brick single-family house with 1,444 sq ft on a nice 6,000 sq ft lot. Important Note: This is a true fixer-upper being sold strictly as-is. It needs a new roof, HVAC system, some foundation repairs, and general updates throughout (kitchen, bathrooms, flooring, paint, etc. ). The price reflects all the work required. It has great bones and tons of potential for the right buyer - whether you& apos; re a handy homeowner, first-time renovator, or investor looking for a solid project in a convenient central San Antonio location.
Key facts
- Spacious backyard
- General updates
- Foundation repairs
Tags
Neighborhood map
What this means for you Summary
Snapshot
- This is a 3-bed/2.0-bath single-family listed at $95k.
Deal economics
- At list price, monthly cash flow is $198 ($2k/yr) — positive.
- The deal already cash-flows at list — no discount required.
- Meets the 1% rule at list price ($1k rent vs $95k).
- Cap rate 8.8% vs local median 3.8% in San Antonio — top-decile yield for the area; either an underpriced asset or a hidden risk that comps aren't pricing in. Stress-test before assuming the spread holds.
Location & tenants
- Location reads 80/100 on livability (#31 in TX, #1,616 nationally) — a professional / high-income tenant draw. Strengths: amenities A+, commute A+, cost of living A+; Watch: schools C-, crime F.
- San Antonio ISD (urban): math 12% / reading 22% proficiency, ranked #805 of 826 in TX (top 98%) — low school quality limits family demand, transient renter base, plan for 1-2y turnover; 80% free/reduced lunch — lower-income household profile, screen leases tightly.
- Market conditions: Rents rising (+2.8%/yr); 172 active listings in the ZIP; 40 comparable units currently listed for rent nearby; rentals at typical pace (median 24d on market — plan ~3-4 weeks tenant-placement turnaround); 40% of comp listings sitting > 30 days — soft ceiling on asking rent; 8,308 units permitted in Bexar County in 2024 (2,506 in 5+ unit buildings).
- This rent runs 34% of the median local income ($47k/yr) — at the standard rent-burdened threshold; future hikes will face affordability resistance.
Forward outlook
- Local home prices are declining (-3.0%/yr); year-one equity from $657 of loan paydown is wiped out by about $3k of value loss. Plan a longer hold.
- Bexar County population projected at +50% by 2050 — long-run rental-demand tailwind backs the buy-and-hold thesis.
Negotiation context
- Only 14 days on market — expect competitive offers; lowballing is unlikely to land.
Risks & watch-outs
- Watch-outs: property tax is 4.2% of price; built in 1947 — expect roof / HVAC / electrical / plumbing capex.
- Climate carrying-cost: major wind risk, 77% chance of damaging wind over 30y; extreme-heat days projected 7→22/yr by 2055 (HVAC capex compounding) — expect insurance premiums to compound above CPI over the hold.
Questions for the listing agent
- Built in 1947 — when were the roof, HVAC, electrical panel, plumbing, and water heater last replaced?
- Property tax is high relative to price — has the assessment been appealed recently, and will the sale trigger a re-assessment?
- Is there a deadline driving the sale (1031 exchange, divorce, estate, relocation)? That informs how much negotiation room exists.
- Crime grade is F in this area — have there been break-ins, vandalism, or insurance claims at this property in the last 3 years? What carrier currently insures it and at what premium?
- What's the average days-on-market for RENTAL listings here right now (not sales)? A rising rental-DOM trend means longer vacancies and softer asking-rent achievability than the comps imply.
- What's the recent tenant-quality profile in this submarket — average credit score on applications, eviction rate, late-payment / NSF rate, and stable-employment percentage? A property-management company in the area should have these aggregated.
- How much new for-sale + rental construction is in the pipeline within 1–3 miles? Heavy new supply typically softens prices + rents 12–24 months out; constrained supply supports both.
Investment metrics
- 1% rule
- 1.42% ✓
- Cap rate
- 8.79%
- Cash-on-cash
- 8.92%
- DSCR
- 1.40
- GRM
- 5.9
CMA / ARV
- ARV (median comp)
- $224,858
- List price
- $95,000
- Delta
- -57.75%
- Verdict
- UNDERPRICED
- Comps
- 20 within 1.0 mi
Show comp detail 12 sales within ~0.75 mi
| Address | Dist | Beds/Ba | Sqft | Sold | Price | $/sf | Match |
|---|---|---|---|---|---|---|---|
| 2218 W Wildwood Dr | 0.12mi | 3/2.0 | 1,304 (-10%) | 2mo | $260,000 | $199 | 77 |
| 200 Frost St | 0.31mi | 3/2.0 | 1,316 (-9%) | 4mo | $225,000 | $171 | 67 |
| 2209 Sacramento | 0.42mi | 3/1.5 | 1,534 (+6%) | 4mo | $180,000 | $117 | 65 |
| 230 Leming Dr | 0.64mi | 3/2.0 | 1,392 (-4%) | 1mo | $299,000 | $215 | 63 |
| 251 North | 0.70mi | 3/2.0 | 1,434 (-1%) | 6mo | $319,000 | $222 | 61 |
| 2207 Ramona | 0.20mi | 3/1.0 | 1,261 (-13%) | 6mo | $185,000 | $147 | 61 |
| 226 Frost | 0.25mi | 3/2.0 | 1,244 (-14%) | 9mo | $254,990 | $205 | 57 |
| 2223 Ramona St | 0.22mi | 4/1.0 (+1) | 1,288 (-11%) | 8mo | $205,000 | $159 | 56 |
| 107 Cromwell Dr | 0.62mi | 3/2.0 | 1,548 (+7%) | 6mo | $285,000 | $184 | 54 |
| 1620 Kampmann | 0.59mi | 4/1.0 (+1) | 1,524 (+6%) | 4mo | $249,999 | $164 | 51 |
| 1819 Edison | 0.48mi | 3/1.0 | 1,266 (-12%) | 3mo | $229,900 | $182 | 51 |
| 115 Rosemont | 0.68mi | 3/2.0 | 1,611 (+12%) | 2mo | $155,000 | $96 | 48 |
Match score weights: distance 35% · size 25% · config 20% · recency 20%. Top-matched comps best support the ARV.
Projected returns pro-forma
-3.0% appreciation · 2.82% rent growth · sell at horizon
- IRR
- -2.9%
- Equity multiple
- 0.89×
- Total profit
- $-2,894
- Equity at exit
- $14,165
- IRR
- 6.7%
- Equity multiple
- 1.50×
- Total profit
- $13,312
- Equity at exit
- $8,214
Cash invested: $26,600 (down + closing). Projections, not guarantees.
Landlord ↔ Tenant lean methodology
- Overall (STATE)
- 87 Strongly Landlord-Friendly
- State Texas
- 87 Strongly Landlord-Friendly · R+5
- County
- — inherits STATE
- City
- — inherits STATE
ZIP-level market 78201
- Home prices YoY
- -28.4%
- Rents YoY
- 2.8%
- Active inventory
- 172
- Price-to-rent
- 5.9×
Monthly cashflow live
- Estimated rent
- $1,352 high interval (Pro) →
- Mortgage (P&I)
- −$498
- Tax from tax record
- −$333 /mo · $3,993/yr
- Insurance
- −$40
- HOA
- −$0
- Vacancy / Maint / Mgmt
- −$284
- Net cashflow
- $198
Break-even live
UW: 25.0% down · 7.5% · 30yr · 1.5% tax · 5.0% vac · 8.0% maint · 8.0% mgmt
Financing live
Cash to close
- Down payment
- $23,750
- Closing costs
- $2,850
- Reserves months
- —
- Total cash needed
- —
Loan-product check · same deal, 3 products live
Conventional
25% down · 7.5% · 30yr
- Down + closing
- —
- Monthly P&I
- —
- Monthly cashflow
- —
- DSCR
- —
- Eligible?
- —
Personal DTI + credit; lowest rate.
DSCR
20% down · 8.5% · 30yr
- Down + closing
- —
- Monthly P&I
- —
- Monthly cashflow
- —
- DSCR
- —
- Eligible?
- —
No personal income docs; deal must DSCR.
Hard money
10% down · 12.0% · 12mo
- Down + closing
- —
- Monthly P&I
- —
- Monthly cashflow
- —
- DSCR
- —
- Eligible?
- —
Short-term bridge; refi at stabilization.
Rent comps 40 comps
| Address | Beds | Baths | Sqft | Rent | $/sqft | DOM | Units | Dist |
|---|---|---|---|---|---|---|---|---|
| 1218 Gardina St Unit 1218 San Antonio, TX | 2.0 | 1.0 | 1280 | $900 | $0.70 | 44d | 1 | 0.15mi |
| 1216 Gardina St Unit 1218 San Antonio, TX | 2.0 | 1.0 | 1280 | $900 | $0.70 | 44d | 1 | 0.15mi |
| 911 Vance Jackson Rd San Antonio, TX | 2.0 | 1.5 | 1073 | $1,262 | $1.18 | 3d | 3 | 0.22mi |
| 2003 Fresno St San Antonio, TX | 2.0 | 1.0 | 1100 | $1,149 | $1.04 | 18d | 1 | 0.39mi |
| 210 Laddie Pl San Antonio, TX | 3.0 | 1.0 | 1226 | $1,575 | $1.28 | 24d | 1 | 0.45mi |
| 210 Laddie Pl San Antonio, TX | 3.0 | 1.0 | 1226 | $1,550 | $1.26 | 3d | 1 | 0.45mi |
| 140 Babcock Rd San Antonio, TX | 1.0–3.0 | 1.0–2.0 | 851 | $1,300 | $1.53 | 44d | 6 | 0.46mi |
| 2005 Santa Anna St Unit 1 San Antonio, TX | 2.0 | 1.0 | 1000 | $1,500 | $1.50 | 44d | 1 | 0.57mi |
| 312 Babcock Rd San Antonio, TX | 2.0 | 1.0 | 1044 | $995 | $0.95 | 44d | 1 | 0.57mi |
| 2803 Fredericksburg Rd San Antonio, TX | 2.0 | 1.0–2.0 | 968 | $1,099 | $1.13 | 13d | 2 | 0.58mi |
| 135 De Chantle Rd Unit 204 San Antonio, TX | 2.0 | 2.0 | 1100 | $1,300 | $1.18 | 44d | 1 | 0.60mi |
| 135 De Chantle Rd Unit 206 San Antonio, TX | 2.0 | 1.0 | 950 | $1,200 | $1.26 | 44d | 1 | 0.60mi |
| 1627 W Mariposa Dr San Antonio, TX | 3.0 | 2.0 | 1400 | $1,850 | $1.32 | 13d | 1 | 0.70mi |
| 1606 W Wildwood Dr Unit A San Antonio, TX | 2.0 | 1.0 | 1000 | $1,350 | $1.35 | 44d | 1 | 0.72mi |
| 415 North Dr San Antonio, TX | 4.0 | 2.0 | 1795 | $1,600 | $0.89 | 20d | 1 | 0.75mi |
| 331 Gardina St San Antonio, TX | 3.0 | 1.5 | 980 | $1,450 | $1.48 | 18d | 1 | 0.78mi |
| 2326 Basse Rd San Antonio, TX | 3.0 | 2.0 | 1168 | $1,250 | $1.07 | 24d | 1 | 0.91mi |
| 4210 Fredericksburg Rd San Antonio, TX | 2.0 | 1.0–2.0 | 687 | $739 | $1.07 | 2d | 55 | 0.96mi |
| 206 Avalon St San Antonio, TX | 3.0 | 1.0 | 1200 | $1,450 | $1.21 | 44d | 1 | 0.97mi |
| 1331 W Wildwood Dr San Antonio, TX | 3.0 | 1.0 | 1178 | $1,600 | $1.36 | 44d | 1 | 0.98mi |
| 119 Meredith Dr San Antonio, TX | 3.0 | 1.0 | 1408 | $1,850 | $1.31 | 44d | 1 | 1.00mi |
| 229 Alexander Hamilton Dr Unit 1 San Antonio, TX | 3.0 | 1.0 | 1568 | $1,250 | $0.80 | 3d | 1 | 1.02mi |
| 229 Alexander Hamilton Dr San Antonio, TX | 3.0 | 1.0 | 1568 | $1,250 | $0.80 | 20d | 1 | 1.02mi |
| 4216 Fredericksburg Rd Balcones Heights, TX | 2.0 | 2.0 | 1025 | $1,300 | $1.27 | 24d | 1 | 1.02mi |
| 126 Meredith Dr San Antonio, TX | 2.0 | 1.0 | 1278 | $1,400 | $1.10 | 22d | 1 | 1.04mi |
| 97 Denton Dr San Antonio, TX | 3.0 | 2.0 | 1672 | $1,750 | $1.05 | 24d | 1 | 1.04mi |
| 734 Donaldson Ave Unit B San Antonio, TX | 2.0 | 1.0 | 910 | $910 | $1.00 | 3d | 1 | 1.04mi |
| 734 Donaldson Ave Unit D San Antonio, TX | 2.0 | 1.0 | 910 | $915 | $1.01 | 13d | 1 | 1.04mi |
| 234 Danville Ave San Antonio, TX | 3.0 | 1.0 | 1129 | $1,600 | $1.42 | 20d | 1 | 1.09mi |
| 318 Avalon St San Antonio, TX | 3.0 | 2.0 | 1058 | $1,600 | $1.51 | 24d | 1 | 1.10mi |
| 414 Alexander Hamilton Dr San Antonio, TX | 2.0 | 1.0 | 1277 | $1,275 | $1.00 | 44d | 1 | 1.11mi |
| 1614 W Rosewood Ave San Antonio, TX | 2.0 | 2.0 | 1086 | $2,500 | $2.30 | 24d | 1 | 1.11mi |
| 146 Redrock Dr San Antonio, TX | 3.0 | 1.0 | 1050 | $1,800 | $1.71 | 16d | 1 | 1.11mi |
| 2531 Clara Ln Unit 211 San Antonio, TX | 2.0 | 1.0 | 900 | $1,200 | $1.33 | 44d | 1 | 1.13mi |
| 1211 Lee Hall San Antonio, TX | 4.0 | 2.0 | 1078 | $1,500 | $1.39 | 24d | 1 | 1.16mi |
| 374 Meredith Dr San Antonio, TX | 4.0 | 3.0 | 1336 | $2,100 | $1.57 | 44d | 1 | 1.18mi |
| 166 Tabard Dr San Antonio, TX | 3.0 | 2.0 | 1491 | $1,800 | $1.21 | 3d | 1 | 1.18mi |
| 943 Weizmann St San Antonio, TX | 3.0 | 2.0 | 1692 | $2,100 | $1.24 | 44d | 1 | 1.19mi |
| 943 Weizmann St San Antonio, TX | 3.0 | 2.0 | 1692 | $2,100 | $1.24 | 24d | 1 | 1.19mi |
| 2020 W Kings Hwy Unit 2 San Antonio, TX | 2.0 | 1.0 | 1254 | $1,325 | $1.06 | 44d | 1 | 1.20mi |
Listing history 1 events
-
2026-05-12$95,000 Active 1258-char remark
ⓘ Source: listings_history table (triggers on properties + properties_extension) + one-shot
backfill from property_details.listing_events for pre-trigger history.
Tax reassessment forecast TX · Resets to sale price
- Current annual tax
- $3,993 · $333/mo
- Projected year-2 tax
- $3,993 · $333/mo
- Expected delta
- $0/yr ($0/mo · 0.0%)
ⓘ Screening estimate from a state-policy table — verify with the county assessor before closing.
Climate risk First Street
- Flood 1/10 Low FEMA zone X (unshaded) · 0% chance over 30 yrs
- Wildfire 1/10 Low
- Heat 8/10 Severe 7 d/yr ≥108°F today · 22 d/yr by 30 yrs out
- Wind 6/10 Major 77% chance of damaging wind over 30 yrs
- Air quality 2/10 Low 1 unhealthy d/yr today · 1 by 30 yrs out
Nearby sold comps map
Loading sold comps map…
Walkable amenities ~0.75 mi
Loading nearby amenities…
Taxation est. · year 1
- Rental income
- $16,226
- − Mortgage interest
- −$5,321
- − Property taxes
- −$3,993
- − Insurance
- −$475
- − Repairs & maintenance
- −$1,298
- − Management
- −$1,298
- − Depreciation
- −$2,764
- Taxable income
- $1,077
- Est. tax owed @ 24.0%
- −$258
- After-tax cash flow
- $2,114/yr
For passive investors: Depreciation is non-cash, so a rental often shows a tax loss while cash-flowing — sheltering income. Rental losses are passive: they offset passive income freely, and up to $25,000/yr can offset ordinary (W-2) income if you actively participate and your MAGI is under $100k (phasing out to $0 by $150k); unused losses carry forward. On sale, claimed depreciation is recaptured at up to 25%, and gains may owe capital-gains tax (a 1031 exchange can defer both). Figures are a year-1 estimate at your 24.0% rate — not tax advice; consult a CPA.
Schools (NCES district)
- District
- San Antonio ISD
- NCES district ID
- 4838730
- Math proficiency
- 12% ▼ -21.00%
- Reading proficiency
- 22% ▼ -7.00%
- Median HH income
- $30,952
- Composite
- 13.57/100
- National rank
- #9512
- State rank
- #805 of 826 in TX
Livability — San Antonio
- Score
- 80/100
- State rank
- #31
- US rank
- #1616
Category grades
Schools grade is shown separately in the Schools card above.
Census & demographics
- Census place
- San Antonio, TX
- County
- Bexar County · 1,990,555 people
- City population
- 1,806,925
- Metro
- San Antonio-New Braunfels, TX
- Population (ZIP)
- 41,981
- Household income
- $47,121
- Rent vs Own
- Severe rent burden
- 2332.0
Population outlook (Bexar County) Hauer SSP2
- Today (2025)
- 2,336,851 people
- By 2030
- 2,560,728 · +9.6%
- By 2040
- 3,020,569 · +29.3%
- By 2050
- 3,493,522 · +49.5%
- By 2075
- 4,668,459 · +99.8%
- By 2100
- 5,533,242 · +136.8%
Race, ethnicity, and origin ACS 2023
- Neighborhood character
- Predominantly Hispanic (83%)
- Race & ethnicity
- Hispanic / Latino 83% Two or more races 51% White 13% Black 2% Native American 1%
- Hispanic origin (detail)
- Mexican 71%
- Common ancestry
- Arab 1% Lithuanian 1% Slovak 1%
- Foreign-born
- 22% · Canada
- Languages at home
- 43% English-only · Spanish 54% Arabic 1%
Political lean MEDSL · Bexar
- 2024 margin
- Lean D (+9.8) · D 54.3% · R 44.6% · Other 1.1%
- 2008→2024 swing
- +4.2pp toward D · 2008: 5.6pp · 2024: 9.8pp
- All cycles
- 2024: D+9.8 2020: D+18.2 2016: D+13.5 2012: D+4.6 2008: D+5.6
Not yet ingested
- Civics
- —
Market trends
- HPI YoY
- ▼ -103.07%
- Current HPI
- 259.9918
- Rent YoY
- ▲ 2.82%
- Metro
- San Antonio-New Braunfels, TX
- State GDP YoY
- ▲ 3.95%
- F500 in state
- 110
Industry mix (Fortune 500 HQ in TX)
| Industry | F500 HQs | Revenue |
|---|---|---|
| Energy | 16 | $1,198B |
|
||
| Technology | 5 | $198B |
|
||
| Engineering / Construction | 4 | $72B |
|
||
| Energy Services | 3 | $60B |
|
||
| Utilities | 3 | $41B |
|
||
| Healthcare | 2 | $330B |
|
||
Property tax history
+6.2%/yrLatest (2025): $3,993 · +10.0% YoY. Source: county tax records.
Cash-flow waterfall
monthlySold comps — $/sqft
last 12 mo · ≤1 miLoading sold comps…