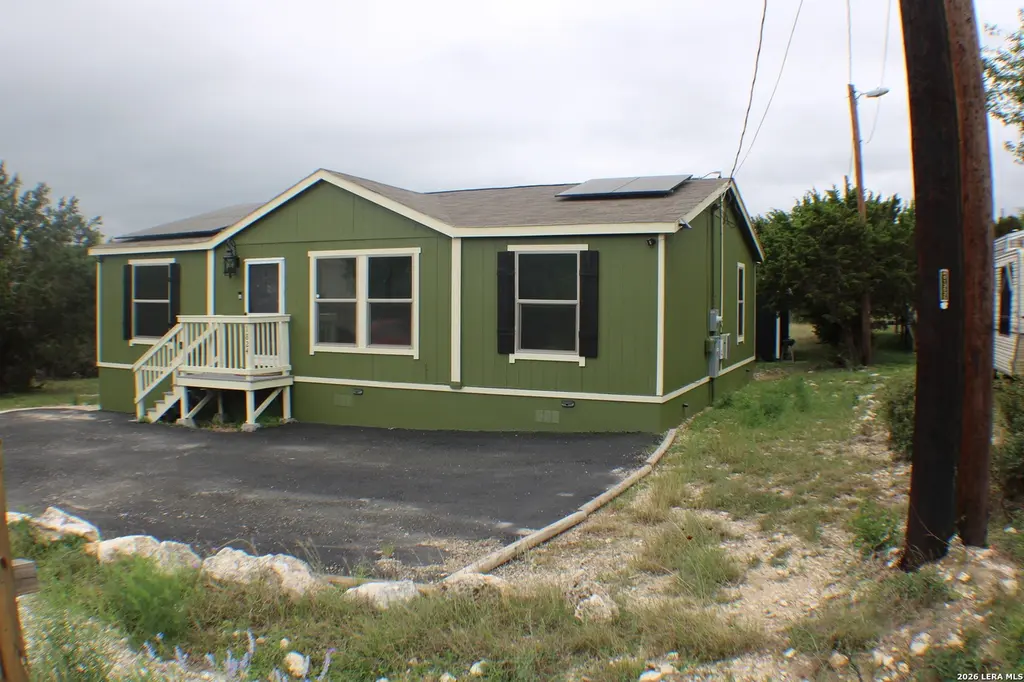
1824 Live Oak Dr · Canyon Lake, TX
Flood risk 5/10 · Moderate
- FEMA flood zone
- X (unshaded)
- Chance of flooding over 30 yrs
- 0.65%
- Est. flood insurance / yr
- $507 – $1,088
Fire risk 4/10 · Minor
- Est. fire insurance / yr
- $1,222 – $2,270
Heat risk 8/10 · Major
- Hot days now (above 107°F)
- 7 days/yr
- Hot days in 30 yrs
- 23 days/yr
Wind risk 6/10 · Moderate
- Chance of severe wind over 30 yrs
- 73.0%
Air-quality risk 2/10 · Minimal
- Unhealthy air days now
- 0 days/yr
- Unhealthy air days in 30 yrs
- 1 days/yr
Risk factors via First Street. Map © Google.
Why this score? — see what drove the C grade
The composite is a weighted blend of 9 inputs, each scored 0–100. Each bar is that input's sub-score; the figure is the points it added to the 100-point composite (weight × sub-score).
- Cash flow +17.7/30.0
- ARV discount +15.0/15.0
- DSCR +5.5/10.0
- Schools +5.2/10.0
- 1% rule +4.3/10.0
- Livability +3.4/5.0
- Condition / age +2.5/5.0
- Rent growth +2.2/5.0
- Appreciation +0.0/10.0
$199,900
🖨 Deal sheet (PDF) 📄 Offer letter ✓ Due diligence
Listing remarks MLS
Opportunity in Canyon Lake ideal for full time living, a weekend getaway, or short-term rental potential. Positioned in the desirable Canyon Lake area, 1824 Live Oak Dr. offers a spacious lot with room to create your ideal outdoor setting, expand, or simply enjoy the Hill County lifestyle. Inside, the home features a comfortable layout with natural light and a practical flow, making it easy to move right in or update to match your vision. Located just minutes from Canyon Lake access, boat ramps, parks, and local dining, this property is well suited for both personal use and investment purposes. With recent exterior updated already in place, you can move forward with confidence whil adding your own value over time. If you've been looking for a Canyon Lake property with flexibility and upside, this is one to see.
Key facts
- Asphalt driveway
- Brand new front door
- Storm door
Tags
Neighborhood map
What this means for you Summary
Snapshot
- This is a 3-bed/2.0-bath manufactured listed at $200k.
Deal economics
- At list price, monthly cash flow is $161 ($2k/yr) — positive.
- The deal already cash-flows at list — no discount required.
- To meet the 1% rule (rent ≥ 1% of price), the offer needs to be $187k (6.5% below list).
- Recommended offer: $187k (6.5% below list) — sets the bar for 1% rule.
- Cap rate 7.3% vs local median 2.3% in Canyon Lake — top-decile yield for the area; either an underpriced asset or a hidden risk that comps aren't pricing in. Stress-test before assuming the spread holds.
Location & tenants
- Location reads 67/100 on livability (#534 in TX) — a middle-class / working-renter tenant base. Strengths: employment A+, housing A+, cost of living A; Watch: schools C-, amenities F, commute F.
- Comal ISD (rural): math 57% / reading 59% proficiency, ranked #58 of 826 in TX (top 7%) — acceptable for families but not a draw, mixed tenant base, ~2y average lease.
- Market conditions: Rents soft (-1.2%/yr); 1014 active listings in the ZIP; 9 comparable units currently listed for rent nearby; rentals at typical pace (median 25d on market — plan ~3-4 weeks tenant-placement turnaround); solid renter incomes; 3,420 units permitted in Comal County in 2024 (1,164 in 5+ unit buildings).
Forward outlook
- Local home prices are declining (-3.0%/yr); year-one equity from $1k of loan paydown is wiped out by about $6k of value loss. Plan a longer hold.
- Comal County population projected at +70% by 2050 — long-run rental-demand tailwind backs the buy-and-hold thesis.
Negotiation context
- It's been on market 61 days — a 6% lower offer ($188k) is reasonable based on typical stale-listing flexibility.
- 6 sale attempts since 5y ago with the ask held roughly flat each time — persistent listings suggest the price (not the market) is what's stuck; bring a comps-based counter.
Risks & watch-outs
- Climate carrying-cost: moderate flood risk; major wind risk, 73% chance of damaging wind over 30y; extreme-heat days projected 7→23/yr by 2055 (HVAC capex compounding) — expect insurance premiums to compound above CPI over the hold.
Questions for the listing agent
- It's been on market 61 days. Have you received any prior offers? Is the seller open to a 7% concession, seller financing, or rate buy-down credit?
- What does the HOA fee cover, when was the last increase, and are there any pending special assessments or reserve-fund shortfalls?
- Why hasn't it sold? Are there any deal-killer items the seller is aware of (foundation, flood, title, zoning, code violations)?
- Is there a deadline driving the sale (1031 exchange, divorce, estate, relocation)? That informs how much negotiation room exists.
- What's the average days-on-market for RENTAL listings here right now (not sales)? A rising rental-DOM trend means longer vacancies and softer asking-rent achievability than the comps imply.
- What's the recent tenant-quality profile in this submarket — average credit score on applications, eviction rate, late-payment / NSF rate, and stable-employment percentage? A property-management company in the area should have these aggregated.
- How much new for-sale + rental construction is in the pipeline within 1–3 miles? Heavy new supply typically softens prices + rents 12–24 months out; constrained supply supports both.
Investment metrics
- 1% rule
- 0.93% ✗
- Cap rate
- 7.26%
- Cash-on-cash
- 3.45%
- DSCR
- 1.15
- GRM
- 8.9
CMA / ARV
- ARV (median comp)
- $253,694
- List price
- $199,900
- Delta
- -21.20%
- Verdict
- UNDERPRICED
- Comps
- 20 within 1.0 mi
Show comp detail 5 sales within ~0.75 mi
| Address | Dist | Beds/Ba | Sqft | Sold | Price | $/sf | Match |
|---|---|---|---|---|---|---|---|
| 1155 Pecan Cir | 0.25mi | 3/2.0 | 1,280 (0%) | 2mo | $169,000 | $132 | 86 |
| 1457 Willow Dr | 0.11mi | 3/2.0 | 1,344 (+5%) | 20mo | $199,900 | $149 | 70 |
| 1875 Live Oak Dr | 0.06mi | 3/2.0 | 1,456 (+14%) | 15mo | $240,000 | $165 | 62 |
| 710 Tamarack Dr | 0.11mi | 3/2.0 | 1,440 (+12%) | 18mo | $149,000 | $103 | 59 |
| 996 Cypress Dr | 0.28mi | 3/2.0 | 1,456 (+14%) | 22mo | $284,000 | $195 | 46 |
Match score weights: distance 35% · size 25% · config 20% · recency 20%. Top-matched comps best support the ARV.
Projected returns pro-forma
-3.0% appreciation · 0.0% rent growth · sell at horizon
- IRR
- -14.2%
- Equity multiple
- 0.51×
- Total profit
- $-27,646
- Equity at exit
- $29,806
- IRR
- -10.9%
- Equity multiple
- 0.43×
- Total profit
- $-32,110
- Equity at exit
- $17,284
Cash invested: $55,972 (down + closing). Projections, not guarantees.
Landlord ↔ Tenant lean methodology
- Overall (STATE)
- 87 Strongly Landlord-Friendly
- State Texas
- 87 Strongly Landlord-Friendly · R+5
- County
- — inherits STATE
- City
- — inherits STATE
ZIP-level market 78133
- Home prices YoY
- -33.8%
- Rents YoY
- -1.2%
- Active inventory
- 1014
- Price-to-rent
- 8.9×
Monthly cashflow live
- Estimated rent
- $1,869 high interval (Pro) →
- Mortgage (P&I)
- −$1,048
- Tax from tax record
- −$177 /mo · $2,125/yr
- Insurance
- −$83
- HOA
- −$7
- Vacancy / Maint / Mgmt
- −$392
- Net cashflow
- $161
Break-even live
Sensitivity live
| Price | -10% $274 | -5% $217 | +0% $161 | +5% $104 | +10% $48 |
|---|---|---|---|---|---|
| Rent | -10% $13 | -5% $87 | +0% $161 | +5% $235 | +10% $308 |
| Rate | -1.0pp $261 | -0.5pp $212 | base $161 | +0.5pp $109 | +1.0pp $56 |
UW: 25.0% down · 7.5% · 30yr · 1.5% tax · 5.0% vac · 8.0% maint · 8.0% mgmt
Financing live
Cash to close
- Down payment
- $49,975
- Closing costs
- $5,997
- Reserves months
- —
- Total cash needed
- —
Loan-product check · same deal, 3 products live
Conventional
25% down · 7.5% · 30yr
- Down + closing
- —
- Monthly P&I
- —
- Monthly cashflow
- —
- DSCR
- —
- Eligible?
- —
Personal DTI + credit; lowest rate.
DSCR
20% down · 8.5% · 30yr
- Down + closing
- —
- Monthly P&I
- —
- Monthly cashflow
- —
- DSCR
- —
- Eligible?
- —
No personal income docs; deal must DSCR.
Hard money
10% down · 12.0% · 12mo
- Down + closing
- —
- Monthly P&I
- —
- Monthly cashflow
- —
- DSCR
- —
- Eligible?
- —
Short-term bridge; refi at stabilization.
Rent comps 9 comps
| Address | Beds | Baths | Sqft | Rent | $/sqft | DOM | Units | Dist |
|---|---|---|---|---|---|---|---|---|
| 691 Tamarack Dr Canyon Lake, TX | 3.0 | 2.0 | 1659 | $1,495 | $0.90 | 24d | 1 | 0.10mi |
| 537 Tamarack Dr Canyon Lake, TX | 3.0 | 1.0 | 1357 | $1,820 | $1.34 | 5d | 1 | 0.23mi |
| 1200 Willow Dr Canyon Lake, TX | 2.0 | 2.5 | 1360 | $1,875 | $1.38 | 44d | 1 | 0.25mi |
| 1285 Live Oak Dr Canyon Lake, TX | 3.0 | 2.0 | 1314 | $1,795 | $1.37 | 44d | 1 | 0.39mi |
| 1660 McIver Canyon Lake, TX | 3.0 | 2.5 | 1378 | $3,450 | $2.50 | 44d | 1 | 1.10mi |
| 1616 Lonesome Canyon Lake, TX | 3.0 | 2.0 | 1350 | $1,650 | $1.22 | 2d | 1 | 1.11mi |
| 1375 Canyon Trce Unit B Canyon Lake, TX | 2.0 | 1.5 | 896 | $1,450 | $1.62 | 2d | 1 | 1.25mi |
| 578 Misty Glen Dr Canyon Lake, TX | 3.0 | 2.0 | 1277 | $1,850 | $1.45 | 13d | 1 | 1.32mi |
| 1123 Hedgestone Canyon Lake, TX | 3.0 | 2.0 | 1344 | $1,450 | $1.08 | 24d | 1 | 1.47mi |
HOA detail
- Monthly dues
- $7 · $84/yr
Listing history 35 events
-
2026-06-18days on market $199,900 Active 61 DOM
-
2026-06-17days on market $199,900 Active 60 DOM
-
2026-06-16days on market $199,900 Active 59 DOM
-
2026-06-15days on market $199,900 Active 58 DOM
-
2026-06-13days on market $199,900 Active 56 DOM
-
2026-06-09days on market $199,900 Active 52 DOM
-
2026-06-08days on market $199,900 Active 51 DOM
-
2026-06-07days on market $199,900 Active 50 DOM
-
2026-06-04days on market $199,900 Active 47 DOM
-
2026-06-03days on market $199,900 Active 46 DOM
-
2026-06-02statusdays on market $199,900 Active 45 DOM
-
2026-06-01days on market $199,900 Price Change 44 DOM
-
2026-05-31days on market $199,900 Price Change 43 DOM
-
2026-04-18$200,000 New 823-char remark
Show marketing remark (823 chars)
Opportunity in Canyon Lake ideal for full time living, a weekend getaway, or short-term rental potential. Positioned in the desirable Canyon Lake area, 1824 Live Oak Dr. offers a spacious lot with room to create your ideal outdoor setting, expand, or simply enjoy the Hill County lifestyle. Inside, the home features a comfortable layout with natural light and a practical flow, making it easy to move right in or update to match your vision. Located just minutes from Canyon Lake access, boat ramps, parks, and local dining, this property is well suited for both personal use and investment purposes. With recent exterior updated already in place, you can move forward with confidence whil adding your own value over time. If you've been looking for a Canyon Lake property with flexibility and upside, this is one to see.
-
2025-06-16historical
-
2025-06-16historical
-
2025-04-17price $224,000
-
2025-04-16$224,000 Active
-
2025-03-07price $228,500
-
2025-03-07status Price Change
-
2025-01-13historical
-
2024-12-20historical
-
2024-11-17price $228,000
-
2024-09-10price $230,000
-
2024-09-10price $230,000
-
2024-08-29price $239,000
-
2024-08-28price $239,000
-
2024-06-28price $239,500
-
2024-06-28price $239,500
-
2024-05-02$240,000 Active
-
2024-04-20$240,000 New
-
2021-05-25soldstatus Sold
-
2021-03-29status Pending
-
2021-02-06$174,900 New
-
2020-11-09soldstatus
ⓘ Source: listings_history table (triggers on properties + properties_extension) + one-shot
backfill from property_details.listing_events for pre-trigger history.
Tax reassessment forecast TX · Resets to sale price
- Current annual tax
- $2,125 · $177/mo
- Projected year-2 tax
- $3,658 · $305/mo
- Expected delta
- +$1,534/yr (+$128/mo · 72.2%)
ⓘ Screening estimate from a state-policy table — verify with the county assessor before closing.
Climate risk First Street
- Flood 5/10 Major FEMA zone X (unshaded) · 65% chance over 30 yrs
- Wildfire 4/10 Moderate
- Heat 8/10 Severe 7 d/yr ≥107°F today · 23 d/yr by 30 yrs out
- Wind 6/10 Major 73% chance of damaging wind over 30 yrs
- Air quality 2/10 Low 0 unhealthy d/yr today · 1 by 30 yrs out
Nearby sold comps map
Loading sold comps map…
Walkable amenities ~0.75 mi
Loading nearby amenities…
Taxation est. · year 1
- Rental income
- $22,425
- − Mortgage interest
- −$11,198
- − Property taxes
- −$2,125
- − Insurance
- −$1,000
- − Repairs & maintenance
- −$1,794
- − Management
- −$1,794
- − HOA
- −$84
- − Depreciation
- −$5,815
- Taxable loss
- −$1,384
- Est. tax savings @ 24.0%
- +$332
- After-tax cash flow
- $2,260/yr
For passive investors: Depreciation is non-cash, so a rental often shows a tax loss while cash-flowing — sheltering income. Rental losses are passive: they offset passive income freely, and up to $25,000/yr can offset ordinary (W-2) income if you actively participate and your MAGI is under $100k (phasing out to $0 by $150k); unused losses carry forward. On sale, claimed depreciation is recaptured at up to 25%, and gains may owe capital-gains tax (a 1031 exchange can defer both). Figures are a year-1 estimate at your 24.0% rate — not tax advice; consult a CPA.
Schools (NCES district)
- District
- Comal ISD
- NCES district ID
- 4814730
- Math proficiency
- 57% ▼ -9.00%
- Reading proficiency
- 59% ▼ -2.00%
- Median HH income
- $74,792
- Composite
- 51.79/100
- National rank
- #1671
- State rank
- #58 of 826 in TX
Livability — Canyon Lake
- Score
- 67/100
- State rank
- #534
- US rank
- #10441
Category grades
Schools grade is shown separately in the Schools card above.
Census & demographics
- Census place
- Canyon Lake, TX
- County
- Comal County · 206,262 people
- City population
- 42,159
- Metro
- San Antonio-New Braunfels, TX
- Population (ZIP)
- 21,959
- Household income
- $83,853
- Rent vs Own
- Severe rent burden
- 402.0
Population outlook (Comal County) Hauer SSP2
- Today (2025)
- 175,637 people
- By 2030
- 199,911 · +13.8%
- By 2040
- 249,436 · +42.0%
- By 2050
- 299,430 · +70.5%
- By 2075
- 423,857 · +141.3%
- By 2100
- 512,048 · +191.5%
Race, ethnicity, and origin ACS 2023
- Neighborhood character
- Predominantly White (74%)
- Race & ethnicity
- White 74% Hispanic / Latino 20% Two or more races 10% Black 2%
- Hispanic origin (detail)
- Mexican 15%
- Common ancestry
- Lithuanian 3% Romanian 3% Italian 3%
- Foreign-born
- 4% · Canada
- Languages at home
- 91% English-only · Spanish 7%
Political lean MEDSL · Comal
- 2024 margin
- Solid R (+45.5) · D 26.8% · R 72.2%
- 2008→2024 swing
- +1.9pp toward D · 2008: -47.4pp · 2024: -45.5pp
- All cycles
- 2024: R+45.5 2020: R+42.7 2016: R+50.1 2012: R+54.1 2008: R+47.4
Not yet ingested
- Civics
- —
Market trends
- HPI YoY
- ▼ -111.36%
- Current HPI
- 218.4633
- Rent YoY
- ▼ -1.20%
- Metro
- San Antonio-New Braunfels, TX
- State GDP YoY
- ▲ 3.95%
- F500 in state
- 110
Industry mix (Fortune 500 HQ in TX)
| Industry | F500 HQs | Revenue |
|---|---|---|
| Energy | 16 | $1,198B |
|
||
| Technology | 5 | $198B |
|
||
| Engineering / Construction | 4 | $72B |
|
||
| Energy Services | 3 | $60B |
|
||
| Utilities | 3 | $41B |
|
||
| Healthcare | 2 | $330B |
|
||
Price history
+14.4% since first listed22 events — show timeline
- 2026-04-18 Listed $200,000 LERA
- 2025-06-16 Listing Removed — LERA
- 2025-06-16 Listing Removed — CTXMLS
- 2025-04-17 Price Changed $224,000 LERA
- 2025-04-16 Listed $224,000 CTXMLS
- 2025-03-07 Price Changed $228,500 LERA
- 2025-03-07 Relisted — LERA
- 2025-01-13 Listing Removed — LERA
- 2024-12-20 Listing Removed — CTXMLS
- 2024-11-17 Price Changed $228,000 LERA
- 2024-09-10 Price Changed $230,000 LERA
- 2024-09-10 Price Changed $230,000 CTXMLS
- 2024-08-29 Price Changed $239,000 LERA
- 2024-08-28 Price Changed $239,000 CTXMLS
- 2024-06-28 Price Changed $239,500 LERA
- 2024-06-28 Price Changed $239,500 CTXMLS
- 2024-05-02 Listed $240,000 CTXMLS
- 2024-04-20 Listed $240,000 LERA
- 2021-05-25 Sold (MLS) — LERA
- 2021-03-29 Pending — LERA
- 2021-02-06 Listed $174,900 LERA
- 2020-11-09 Sold (Public Records) — Public Records
Property tax history
+20.4%/yrLatest (2026): $2,125 · -8.9% YoY. Source: county tax records.
Cash-flow waterfall
monthlySold comps — $/sqft
last 12 mo · ≤1 miLoading sold comps…