1126 Gannon Ln · DeSoto, TX
Flood risk 1/10 · Minimal
- FEMA flood zone
- X (unshaded)
- Chance of flooding over 30 yrs
- 0.0%
- Est. flood insurance / yr
- $507 – $1,088
Fire risk 1/10 · Minimal
- Est. fire insurance / yr
- $1,222 – $2,270
Heat risk 7/10 · Major
- Hot days now (above 110°F)
- 7 days/yr
- Hot days in 30 yrs
- 24 days/yr
Wind risk 6/10 · Moderate
- Chance of severe wind over 30 yrs
- 27.0%
Air-quality risk 2/10 · Minimal
- Unhealthy air days now
- 2 days/yr
- Unhealthy air days in 30 yrs
- 2 days/yr
Risk factors via First Street. Map © Google.
Why this score? — see what drove the F grade
The composite is a weighted blend of 9 inputs, each scored 0–100. Each bar is that input's sub-score; the figure is the points it added to the 100-point composite (weight × sub-score).
- Cash flow +5.3/30.0
- Livability +3.3/5.0
- Schools +2.8/10.0
- Condition / age +2.5/5.0
- Rent growth +1.9/5.0
- 1% rule +1.0/10.0
- DSCR +0.0/10.0
- ARV discount +0.0/15.0
- Appreciation +0.0/10.0
$429,999
🖨 Deal sheet 📄 Offer letter ✓ Due diligence
Listing remarks MLS
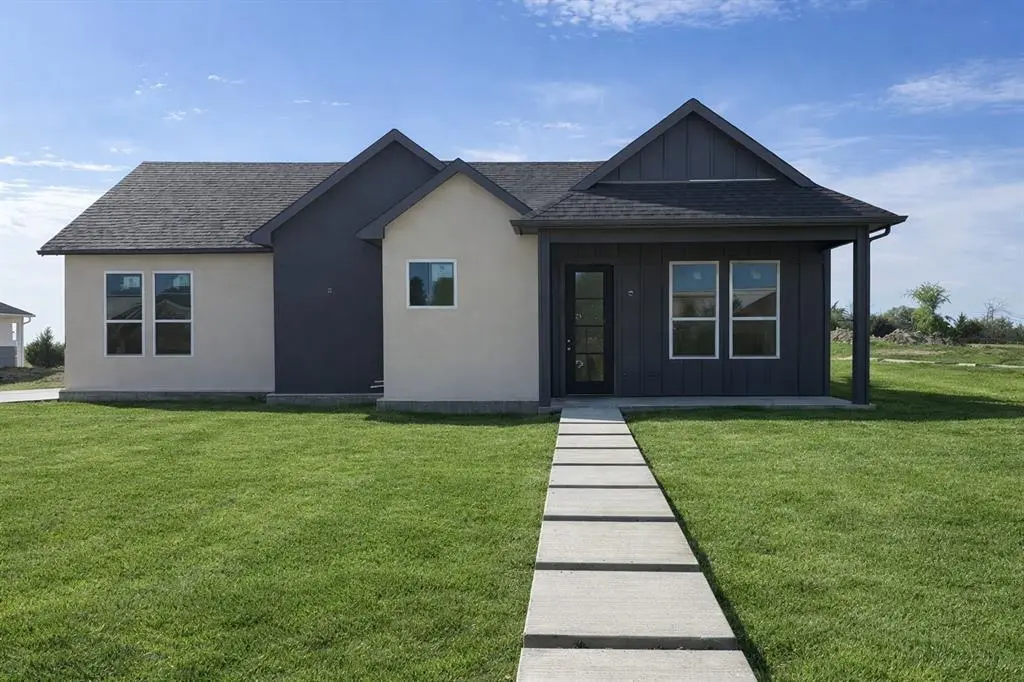
Final stages of construction – estimated completion end of May. Welcome to this thoughtfully designed modern single-story home that blends style, comfort, and everyday functionality. Sitting on an oversized 12,000+ sqft lot, this 4-bedroom, 2.5-bath home features an open-concept layout that creates a bright and inviting space from the moment you walk in. The kitchen opens seamlessly into the main living area and is equipped with quartz countertops, custom cabinetry, and a large island — perfect for entertaining or everyday living. Clean lines and modern finishes throughout give the home a sleek, updated feel. The primary suite offers a private retreat with its own fireplace, a well-designed bathroom, and a spacious walk-in closet. Secondary bedrooms provide flexibility for guests, a home office, or additional living space. Outside, enjoy a large backyard with plenty of room to relax, entertain, or customize to your liking. This home is nearing completion, giving buyers the opportunity to secure it now and move in shortly after. Seller is offering $10,000 toward buyer’s closing costs.
Key facts
- Custom cabinetry
- Quartz countertops
- Walk-in closet
Tags
Neighborhood map
What this means for you Summary
Snapshot
- This is a 4-bed/2.5-bath land listed at $430k.
Deal economics
- At list price, monthly cash flow is $-949 ($-11k/yr) — negative.
- To cash-flow at today's rent, offer at most $293k (31.9% below list).
- To meet the 1% rule (rent ≥ 1% of price), the offer needs to be $256k (40.5% below list).
- Recommended offer: $256k (40.5% below list) — sets the bar for 1% rule.
Location & tenants
- Location reads 66/100 on livability (#589 in TX) — a middle-class / working-renter tenant base. Strengths: cost of living A+, housing A+; Watch: schools D+, amenities F, commute F.
- Dallas ISD (urban): math 31% / reading 36% proficiency, ranked #559 of 826 in TX (top 68%) — families likely to look elsewhere, expect single-tenant / working-renter base with shorter leases; 83% free/reduced lunch — lower-income household profile, screen leases tightly.
- Market conditions: Rents soft (-2.6%/yr); 472 active listings in the ZIP; 14 comparable units currently listed for rent nearby; rentals at typical pace (median 24d on market — plan ~3-4 weeks tenant-placement turnaround); solid renter incomes; 12,577 units permitted in Dallas County in 2024 (6,829 in 5+ unit buildings).
- This rent runs 37% of the median local income ($83k/yr) — at the standard rent-burdened threshold; future hikes will face affordability resistance.
Forward outlook
- Local home prices are declining (-3.0%/yr); year-one equity from $3k of loan paydown is wiped out by about $13k of value loss. Plan a longer hold.
- Dallas County population projected at +35% by 2050 — long-run rental-demand tailwind backs the buy-and-hold thesis.
Negotiation context
- It's been on market 85 days — a 6% lower offer ($404k) is reasonable based on typical stale-listing flexibility.
Risks & watch-outs
- Climate carrying-cost: major wind risk, 27% chance of damaging wind over 30y; extreme-heat days projected 7→24/yr by 2055 (HVAC capex compounding) — expect insurance premiums to compound above CPI over the hold.
Questions for the listing agent
- What do current leases actually rent for vs. the listed asking? Can we see a recent rent roll and the last 12 months of T-12 income?
- It's been on market 85 days. Have you received any prior offers? Is the seller open to a 40% concession, seller financing, or rate buy-down credit?
- Why hasn't it sold? Are there any deal-killer items the seller is aware of (foundation, flood, title, zoning, code violations)?
- Is there a deadline driving the sale (1031 exchange, divorce, estate, relocation)? That informs how much negotiation room exists.
- Schools are D-rated, which usually means shorter tenancies and higher turnover. Who's the typical renter profile here, and what's been the actual vacancy rate?
- The area grade is low — what's the realistic commute time and amenity access for the typical tenant pool here? Any planned neighborhood developments (good or bad) we should know about?
- What's the average days-on-market for RENTAL listings here right now (not sales)? A rising rental-DOM trend means longer vacancies and softer asking-rent achievability than the comps imply.
- What's the recent tenant-quality profile in this submarket — average credit score on applications, eviction rate, late-payment / NSF rate, and stable-employment percentage? A property-management company in the area should have these aggregated.
- How much new for-sale + rental construction is in the pipeline within 1–3 miles? Heavy new supply typically softens prices + rents 12–24 months out; constrained supply supports both.
Investment metrics
- 1% rule
- 0.60% ✗
- Cap rate
- 3.64%
- Cash-on-cash
- -9.46%
- DSCR
- 0.58
- GRM
- 14.0
CMA / ARV
- ARV (median comp)
- $339,010
- List price
- $429,999
- Delta
- 26.84%
- Verdict
- OVERPRICED
- Comps
- 20 within 1.0 mi
Projected returns pro-forma
-3.0% appreciation · 0.0% rent growth · sell at horizon
- IRR
- -36.5%
- Equity multiple
- -0.14×
- Total profit
- $-137,604
- Equity at exit
- $64,114
- IRR
- -74.0%
- Equity multiple
- -0.88×
- Total profit
- $-226,512
- Equity at exit
- $37,178
Cash invested: $120,400 (down + closing). Projections, not guarantees.
Landlord ↔ Tenant lean methodology
- Overall (STATE)
- 87 Strongly Landlord-Friendly
- State Texas
- 87 Strongly Landlord-Friendly · R+5
- County
- — inherits STATE
- City
- — inherits STATE
ZIP-level market 75115
- Rents YoY
- -2.6%
- Active inventory
- 472
- Price-to-rent
- 14.0×
Monthly cashflow live
- Estimated rent
- $2,560 high interval (Pro) →
- Mortgage (P&I)
- −$2,255
- Tax est. 1.5%
- −$537 /mo · $6,450/yr
- Insurance
- −$179
- HOA
- −$0
- Vacancy / Maint / Mgmt
- −$538
- Net cashflow
- $-949
Break-even live
UW: 25.0% down · 7.5% · 30yr · 1.5% tax · 5.0% vac · 8.0% maint · 8.0% mgmt
Financing live
Cash to close
- Down payment
- $107,500
- Closing costs
- $12,900
- Reserves months
- —
- Total cash needed
- —
Loan-product check · same deal, 3 products live
Conventional
25% down · 7.5% · 30yr
- Down + closing
- —
- Monthly P&I
- —
- Monthly cashflow
- —
- DSCR
- —
- Eligible?
- —
Personal DTI + credit; lowest rate.
DSCR
20% down · 8.5% · 30yr
- Down + closing
- —
- Monthly P&I
- —
- Monthly cashflow
- —
- DSCR
- —
- Eligible?
- —
No personal income docs; deal must DSCR.
Hard money
10% down · 12.0% · 12mo
- Down + closing
- —
- Monthly P&I
- —
- Monthly cashflow
- —
- DSCR
- —
- Eligible?
- —
Short-term bridge; refi at stabilization.
Rent comps 14 comps
| Address | Beds | Baths | Sqft | Rent | $/sqft | DOM | Units | Dist |
|---|---|---|---|---|---|---|---|---|
| 1201 Post Oak Ln Desoto, TX | 3.0 | 3.0 | 2631 | $3,200 | $1.22 | 1d | 1 | 0.43mi |
| 705 Timber Trl Desoto, TX | 4.0 | 2.5 | 2048 | $2,370 | $1.16 | 43d | 1 | 0.82mi |
| 1044 Briarwood Ln Desoto, TX | 4.0 | 3.0 | 2078 | $8,750 | $4.21 | 22d | 1 | 0.84mi |
| 1044 Briarwood Ln Unit 1051607P DeSoto, TX | 4.0 | 3.0 | 2077 | $14,645 | $7.05 | 24d | 1 | 0.84mi |
| 1325 Forest Crk Desoto, TX | 4.0 | 3.5 | 2950 | $2,683 | $0.91 | 4d | 1 | 0.86mi |
| 726 Cottonwood Cir Desoto, TX | 3.0 | 2.0 | 1900 | $2,350 | $1.24 | 43d | 1 | 0.93mi |
| 1012 Cloverdale Ln Unit 1024494P DeSoto, TX | 5.0 | 2.5 | 2421 | $16,997 | $7.02 | 22d | 1 | 1.06mi |
| 1012 Cloverdale Ln Desoto, TX | 5.0 | 2.5 | 2428 | $9,950 | $4.10 | 22d | 1 | 1.06mi |
| 829 Hunters Creek Dr Desoto, TX | 3.0 | 2.0 | 2187 | $2,500 | $1.14 | 43d | 1 | 1.28mi |
| 334 Lisa Ln Desoto, TX | 4.0 | 3.0 | 2034 | $9,750 | $4.79 | 24d | 1 | 1.40mi |
| 334 Lisa Ln Unit 1019597P DeSoto, TX | 4.0 | 3.0 | 2023 | $16,361 | $8.09 | 22d | 1 | 1.40mi |
| 206 Rolling Hills Pl Lancaster, TX | 3.0 | 2.5 | 1410 | $1,895 | $1.34 | 17d | 1 | 1.41mi |
| 201 David Unit 203 DeSoto, TX | 3.0 | 2.0 | 2300 | $2,200 | $0.96 | 43d | 1 | 1.41mi |
| 246 Rolling Hills Pl Unit 1 Lancaster, TX | 3.0 | 2.0 | 1540 | $1,600 | $1.04 | 43d | 1 | 1.43mi |
Listing history 16 events
-
2026-06-18days on market $429,999 Active 85 DOM
-
2026-06-17days on market $429,999 Active 84 DOM
-
2026-06-16days on market $429,999 Active 83 DOM
-
2026-06-15remarks 693-char remark
-
2026-06-15days on market $429,999 Active 82 DOM
-
2026-06-13days on market $429,999 Active 80 DOM
-
2026-06-09days on market $429,999 Active 76 DOM
-
2026-06-08days on market $429,999 Active 75 DOM
-
2026-06-07days on market $429,999 Active 74 DOM
-
2026-06-04days on market $429,999 Active 71 DOM
-
2026-06-03days on market $429,999 Active 70 DOM
-
2026-06-02days on market $429,999 Active 69 DOM
-
2026-06-01days on market $429,999 Active 68 DOM
-
2026-05-31days on market $429,999 Active 67 DOM
-
2026-03-25$429,999 Active 1124-char remark
Show marketing remark (1124 chars)
Final stages of construction – estimated completion end of May. Welcome to this thoughtfully designed modern single-story home that blends style, comfort, and everyday functionality. Sitting on an oversized 12,000+ sqft lot, this 4-bedroom, 2.5-bath home features an open-concept layout that creates a bright and inviting space from the moment you walk in. The kitchen opens seamlessly into the main living area and is equipped with quartz countertops, custom cabinetry, and a large island — perfect for entertaining or everyday living. Clean lines and modern finishes throughout give the home a sleek, updated feel. The primary suite offers a private retreat with its own fireplace, a well-designed bathroom, and a spacious walk-in closet. Secondary bedrooms provide flexibility for guests, a home office, or additional living space. Outside, enjoy a large backyard with plenty of room to relax, entertain, or customize to your liking. This home is nearing completion, giving buyers the opportunity to secure it now and move in shortly after. Seller is offering $10,000 toward buyer’s closing costs.
-
2024-09-25soldstatus
ⓘ Source: listings_history table (triggers on properties + properties_extension) + one-shot
backfill from property_details.listing_events for pre-trigger history.
Climate risk First Street
- Flood 1/10 Low FEMA zone X (unshaded) · 0% chance over 30 yrs
- Wildfire 1/10 Low
- Heat 7/10 Severe 7 d/yr ≥110°F today · 24 d/yr by 30 yrs out
- Wind 6/10 Major 27% chance of damaging wind over 30 yrs
- Air quality 2/10 Low 2 unhealthy d/yr today · 2 by 30 yrs out
Nearby sold comps map
Loading sold comps map…
Walkable amenities ~0.75 mi
Loading nearby amenities…
Taxation est. · year 1
- Rental income
- $30,719
- − Mortgage interest
- −$24,087
- − Property taxes
- −$6,450
- − Insurance
- −$2,150
- − Repairs & maintenance
- −$2,458
- − Management
- −$2,458
- − Depreciation
- −$12,509
- Taxable loss
- −$19,392
- Est. tax savings @ 24.0%
- +$4,654
- After-tax cash flow
- $-6,738/yr
For passive investors: Depreciation is non-cash, so a rental often shows a tax loss while cash-flowing — sheltering income. Rental losses are passive: they offset passive income freely, and up to $25,000/yr can offset ordinary (W-2) income if you actively participate and your MAGI is under $100k (phasing out to $0 by $150k); unused losses carry forward. On sale, claimed depreciation is recaptured at up to 25%, and gains may owe capital-gains tax (a 1031 exchange can defer both). Figures are a year-1 estimate at your 24.0% rate — not tax advice; consult a CPA.
Schools (NCES district)
- District
- Dallas ISD
- NCES district ID
- 4816230
- Math proficiency
- 31% ▼ -16.00%
- Reading proficiency
- 36% ▼ -4.00%
- Median HH income
- $42,881
- Composite
- 28.41/100
- National rank
- #6763
- State rank
- #559 of 826 in TX
Livability — DeSoto
- Score
- 66/100
- State rank
- #589
- US rank
- #11236
Category grades
Schools grade is shown separately in the Schools card above.
Census & demographics
- Census place
- DeSoto, TX
- County
- Dallas County · 2,612,404 people
- City population
- 56,211
- Metro
- Dallas-Fort Worth-Arlington, TX
- Population (ZIP)
- 56,211
- Household income
- $82,782
- Rent vs Own
- Severe rent burden
- 1867.0
Population outlook (Dallas County) Hauer SSP2
- Today (2025)
- 2,979,839 people
- By 2030
- 3,191,823 · +7.1%
- By 2040
- 3,619,611 · +21.5%
- By 2050
- 4,026,915 · +35.1%
- By 2075
- 4,957,073 · +66.4%
- By 2100
- 5,508,725 · +84.9%
Race, ethnicity, and origin ACS 2023
- Neighborhood character
- Predominantly Black (68%)
- Race & ethnicity
- Black 68% Hispanic / Latino 19% Two or more races 11% White 8%
- Hispanic origin (detail)
- Mexican 17%
- Common ancestry
- Swedish 1%
- Foreign-born
- 9% · Canada, Dominican Republic
- Languages at home
- 83% English-only · Spanish 15% French/Haitian/Cajun 1%
Political lean MEDSL · Dallas
- 2024 margin
- Strong D (+22.2) · D 60.2% · R 38.0% · Other 1.8%
- 2008→2024 swing
- +6.9pp toward D · 2008: 15.3pp · 2024: 22.2pp
- All cycles
- 2024: D+22.2 2020: D+31.6 2016: D+26.2 2012: D+15.4 2008: D+15.3
Not yet ingested
- Civics
- —
Market trends
- HPI YoY
- ▼ -170.49%
- Current HPI
- 272.1565
- Rent YoY
- ▼ -2.60%
- Metro
- Dallas-Fort Worth-Arlington, TX
- State GDP YoY
- ▲ 3.95%
- F500 in state
- 110
Industry mix (Fortune 500 HQ in TX)
| Industry | F500 HQs | Revenue |
|---|---|---|
| Energy | 16 | $1,198B |
|
||
| Technology | 5 | $198B |
|
||
| Engineering / Construction | 4 | $72B |
|
||
| Energy Services | 3 | $60B |
|
||
| Utilities | 3 | $41B |
|
||
| Healthcare | 2 | $330B |
|
||
Price history
2 events — show timeline
- 2026-03-25 Listed $429,999 NTREIS
- 2024-09-25 Sold (Public Records) — Public Records
Property tax history
+5.9%/yrLatest (2025): $774 · -0.1% YoY. Source: county tax records.
Cash-flow waterfall
monthlySold comps — $/sqft
last 12 mo · ≤1 miLoading sold comps…