 Triplex
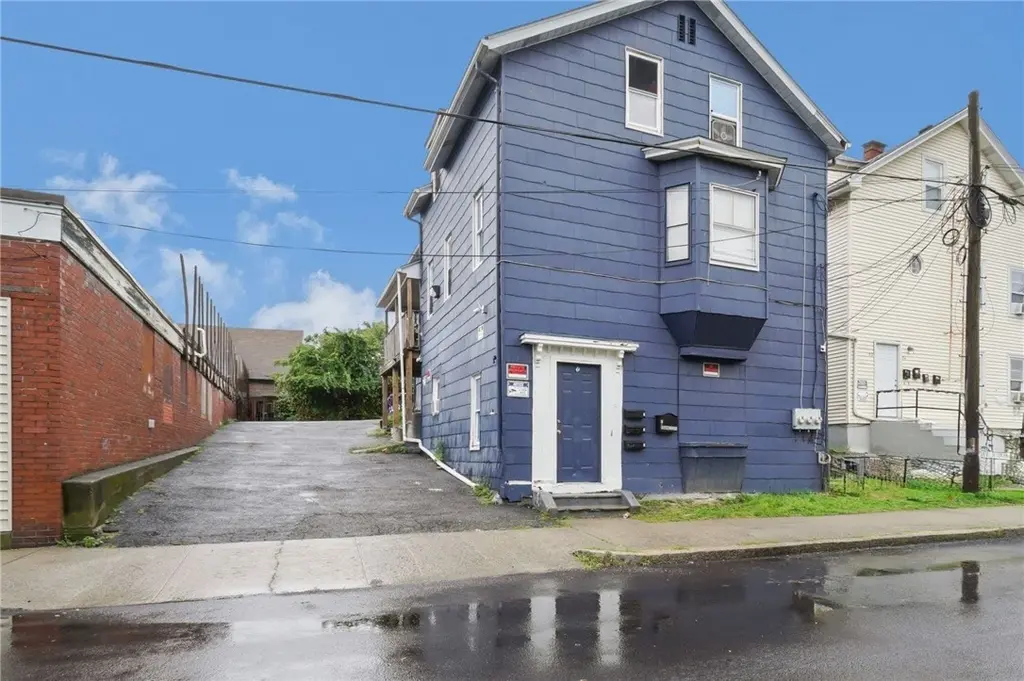
50 Jefferson Ave · Pawtucket, RI
Flood risk 1/10 · Minimal
- FEMA flood zone
- X (unshaded)
- Chance of flooding over 30 yrs
- 0.0%
- Est. flood insurance / yr
- $473 – $860
Fire risk 1/10 · Minimal
- Est. fire insurance / yr
- $835 – $1,551
Heat risk 6/10 · Moderate
- Hot days now (above 96°F)
- 7 days/yr
- Hot days in 30 yrs
- 15 days/yr
Wind risk 6/10 · Moderate
- Chance of severe wind over 30 yrs
- 70.0%
Air-quality risk 2/10 · Minimal
- Unhealthy air days now
- 1 days/yr
- Unhealthy air days in 30 yrs
- 2 days/yr
Risk factors via First Street. Map © Google.
Why this score? — see what drove the B- grade
The composite is a weighted blend of 9 inputs, each scored 0–100. Each bar is that input's sub-score; the figure is the points it added to the 100-point composite (weight × sub-score).
- Cash flow +26.1/30.0
- ARV discount +15.0/15.0
- DSCR +8.8/10.0
- 1% rule +6.4/10.0
- Livability +3.6/5.0
- Rent growth +3.4/5.0
- Condition / age +2.5/5.0
- Schools +1.1/10.0
- Appreciation +0.0/10.0
$474,900
🖨 Deal sheet 📄 Offer letter ✓ Due diligence
Multi-family units
County records classify this as Multi-Family (2-4 Unit). Listing-text estimate: 3 units. confirmed
Listing remarks
Great opportunity for a first time home buyer owner-occupied! Legal 3 family property located near the new Pawtucket train station, new middle school and right across playground. This property features 2 units with 2 bedrooms and 1 unit with one bedroom, plenty of parking for your tenants, many recent updates, new roof installed back in 2018. Schedule a showing today!!
Key facts
- Recent updates
- Plenty of parking
- Across playground
Tags
Property features AI
Finance
- Other: Three-unit investment property (3 units total)
- HOA & community: Nearby amenities include highway access, hospital, schools, public transportation, recreation area, restaurants and shopping
Exterior
- Parking: No garage; Space for about 6 vehicles (total)
- Utilities: Sewer connected; Water connected; Electric service approximately 100 amps; Gas available (gas water heater)
- Home design: Two-story multifamily building; Single building with three residential units; Above-grade finished area approximately 2,865
- Construction: Aluminum siding exterior; Brick/mortar foundation; Built with two stories
- Exterior features: Lot roughly 0.1 acre; Public sewer and connected water
Interior
- Kitchen: Kitchens present in each unit
- Bedrooms: Three units: two 2-bedroom units and one 1-bedroom unit
- Flooring: Ceramic tile; Hardwood; Laminate
- Bathrooms: Three full bathrooms (one in each unit)
- Heating & cooling: Heating: baseboard, electric and gas
- Interior features: Tub/shower; Full, finished basement with walk-out access; 14 total rooms
- Laundry & utility: Utility room
Neighborhood map
What this means for you Summary
Snapshot
- This is a 2×2bd/1ba + 1×1bd/1ba units multifamily listed at $475k.
Deal economics
- At list price, monthly cash flow is $1k ($14k/yr) — positive. Per door: $399/mo.
- The deal already cash-flows at list — no discount required.
- Meets the 1% rule at list price ($5k rent vs $475k).
- Recommended offer: $468k (1.5% below list) — sets the bar for market timing.
- Cap rate 9.3% vs local median 3.8% in Pawtucket — top-decile yield for the area; either an underpriced asset or a hidden risk that comps aren't pricing in. Stress-test before assuming the spread holds.
Location & tenants
- Location reads 71/100 on livability (#16 in RI) — a middle-class / working-renter tenant base. Strengths: housing A+, health & safety A+, cost of living B+; Watch: employment C-, schools D, amenities F.
- Pawtucket (suburban): math 7% / reading 19% proficiency, ranked #33 of 39 in RI (top 85%) — low school quality limits family demand, transient renter base, plan for 1-2y turnover; 67% free/reduced lunch — lower-income household profile, screen leases tightly.
- Market conditions: Rents rising (+3.5%/yr); 123 active listings in the ZIP; 3 comparable units currently listed for rent nearby; rentals at typical pace (median 17d on market — plan ~3-4 weeks tenant-placement turnaround); 776 units permitted in Providence County in 2024 (229 in 5+ unit buildings).
- At $5,434/mo this rent would consume 106% of the median local household income ($62k/yr) (locally 2528% of renters already pay >50% of income on rent) — very limited rent-growth headroom before tenants either downsize or default.
Forward outlook
- Local home prices are declining (-3.0%/yr); year-one equity from $3k of loan paydown is wiped out by about $14k of value loss. Plan a longer hold.
- Providence County population projected at +5% by 2050 — modest demand growth; plan on rents tracking national, not racing it.
- At projected returns (-3.0% appreciation + 3.5% rent growth), your $133k cash investment doubles in ~10 years — after that, you're playing with house money.
Negotiation context
- It's been on market 29 days — a 2% lower offer ($468k) is reasonable based on typical stale-listing flexibility.
- 14 sale attempts since 16y ago with the ask held roughly flat each time — persistent listings suggest the price (not the market) is what's stuck; bring a comps-based counter.
- Current owner paid $330k; 44% above their basis — modest negotiation headroom, anchor on the comps not their cost.
Risks & watch-outs
- Watch-outs: built in 1900 — expect roof / HVAC / electrical / plumbing capex.
- Climate carrying-cost: major wind risk, 70% chance of damaging wind over 30y; extreme-heat days projected 7→15/yr by 2055 (HVAC capex compounding) — expect insurance premiums to compound above CPI over the hold.
Questions for the listing agent
- Can we see the unit-by-unit rent roll, current vacancy, and any below-market leases? What's the average tenancy length?
- What capital expenditures (roof, boiler, parking lot, exteriors) have been made in the last 5 years, and what's planned in the next 2?
- Built in 1900 — when were the roof, HVAC, electrical panel, plumbing, and water heater last replaced?
- Is there a deadline driving the sale (1031 exchange, divorce, estate, relocation)? That informs how much negotiation room exists.
- Schools are D-rated, which usually means shorter tenancies and higher turnover. Who's the typical renter profile here, and what's been the actual vacancy rate?
- What's the average days-on-market for RENTAL listings here right now (not sales)? A rising rental-DOM trend means longer vacancies and softer asking-rent achievability than the comps imply.
- What's the recent tenant-quality profile in this submarket — average credit score on applications, eviction rate, late-payment / NSF rate, and stable-employment percentage? A property-management company in the area should have these aggregated.
- How much new apartment / multifamily construction is in the pipeline within 1–3 miles? Heavy new supply (>2% of stock underway) typically softens rents 12–24 months out; light construction supports rent growth.
Investment metrics
- 1% rule
- 1.14% ✓
- Cap rate
- 9.32%
- Cash-on-cash
- 10.80%
- DSCR
- 1.48
- GRM
- 7.3
CMA / ARV
- ARV (median comp)
- $626,590
- List price
- $474,900
- Delta
- -24.21%
- Verdict
- UNDERPRICED
- Comps
- 20 within 1.0 mi
Show comp detail 2 sales within ~0.75 mi
| Address | Dist | Beds/Ba | Sqft | Sold | Price | $/sf | Match |
|---|---|---|---|---|---|---|---|
| 8 Rosewood St | 0.67mi | 4/2.0 (-1) | 1,481 (-5%) | 10mo | $480,000 | $324 | 44 |
| 250 Lowden St | 0.72mi | 4/2.0 (-1) | 1,632 (+5%) | 10mo | $550,000 | $337 | 41 |
Match score weights: distance 35% · size 25% · config 20% · recency 20%. Top-matched comps best support the ARV.
Projected returns pro-forma
-3.0% appreciation · 3.47% rent growth · sell at horizon
- IRR
- 0.4%
- Equity multiple
- 1.01×
- Total profit
- $1,800
- Equity at exit
- $70,809
- IRR
- 10.5%
- Equity multiple
- 1.83×
- Total profit
- $110,257
- Equity at exit
- $41,061
Cash invested: $132,972 (down + closing). Projections, not guarantees.
Landlord ↔ Tenant lean methodology
- Overall (STATE)
- 31 Tenant-Leaning
- State Rhode Island
- 31 Tenant-Leaning · D+8
- County
- — inherits STATE
- City
- — inherits STATE
ZIP-level market 02860
- Rents YoY
- 3.5%
- Active inventory
- 123
- Price-to-rent
- 20.8×
Monthly cashflow live
- Estimated rent
- $5,434 high interval (Pro) →
- Mortgage (P&I)
- −$2,490
- Tax from tax record
- −$408 /mo · $4,897/yr
- Insurance
- −$198
- HOA
- −$0
- Vacancy / Maint / Mgmt
- −$1,141
- Net cashflow
- $1,196
Break-even live
3-unit breakdown (identical units grouped — click to expand)
| Units | Beds | Baths | Est. rent |
|---|---|---|---|
| 2× units | 2 | 1 | $3,802 |
| #1 | 2 | 1 | $1,901 |
| #2 | 2 | 1 | $1,901 |
| 1× unit | 1 | 1 | $1,632 |
| Total (3 units) | $5,434 | ||
UW: 25.0% down · 7.5% · 30yr · 1.5% tax · 5.0% vac · 8.0% maint · 8.0% mgmt
Financing live
Cash to close
- Down payment
- $118,725
- Closing costs
- $14,247
- Reserves months
- —
- Total cash needed
- —
Loan-product check · same deal, 3 products live
Conventional
25% down · 7.5% · 30yr
- Down + closing
- —
- Monthly P&I
- —
- Monthly cashflow
- —
- DSCR
- —
- Eligible?
- —
Personal DTI + credit; lowest rate.
DSCR
20% down · 8.5% · 30yr
- Down + closing
- —
- Monthly P&I
- —
- Monthly cashflow
- —
- DSCR
- —
- Eligible?
- —
No personal income docs; deal must DSCR.
Hard money
10% down · 12.0% · 12mo
- Down + closing
- —
- Monthly P&I
- —
- Monthly cashflow
- —
- DSCR
- —
- Eligible?
- —
Short-term bridge; refi at stabilization.
Rent comps 3 comps
| Address | Beds | Baths | Sqft | Rent | $/sqft | DOM | Units | Dist |
|---|---|---|---|---|---|---|---|---|
| 0 Lonsdale Ave Pawtucket, RI | 4.0 | 2.5 | 1079 | $2,000 | $1.85 | 17d | 1 | 0.40mi |
| 130 Smart St Providence, RI | 4.0 | 2.0 | 1743 | $3,500 | $2.01 | 1d | 1 | 1.42mi |
| 71 Daniels St Unit 3rd floor Pawtucket, RI | 4.0 | 1.0 | 1200 | $2,400 | $2.00 | 43d | 1 | 1.43mi |
Listing history 50 events
-
2026-06-13statusdays on market $474,900 Pending 29 DOM
-
2026-06-09days on market $474,900 Active Under Contract 28 DOM
-
2026-06-08days on market $474,900 Active Under Contract 27 DOM
-
2026-06-07days on market $474,900 Active Under Contract 26 DOM
-
2026-06-05days on market $474,900 Active Under Contract 23 DOM
-
2026-06-03days on market $474,900 Active Under Contract 22 DOM
-
2026-06-02days on market $474,900 Active Under Contract 21 DOM
-
2026-06-01days on market $474,900 Active Under Contract 20 DOM
-
2026-05-31days on market $474,900 Active Under Contract 19 DOM
-
2026-05-12$474,900 Active 373-char remark
-
2026-04-03status Pending
-
2026-04-03historical
-
2026-03-24$479,000 Active
-
2026-03-16historical
-
2026-02-20historical Active Under Contract
-
2026-02-04status Active
-
2026-01-21historical Active Under Contract
-
2026-01-05$479,000 Active
-
2025-12-25historical
-
2025-10-29$500,000 Active
-
2025-10-27price $500,000
-
2025-10-27historical
-
2025-09-25price $510,000
-
2025-09-09$525,000 Active
-
2021-08-26soldstatus $330,000
-
2021-08-25soldstatus $320,000 Closed
-
2021-07-06status Pending
-
2021-06-24$325,000 Active
-
2021-06-15status Pending
-
2021-06-15historical
-
2021-05-21$325,000 Active
-
2018-04-06historical
-
2018-03-30soldstatus $105,000 Sold
-
2018-03-30soldstatus $105,000
-
2018-02-16historical Under Contract: Inspection Period
-
2018-02-01$114,000 Active
-
2016-08-09historical
-
2016-07-07status Active - New
-
2016-07-07historical
-
2016-07-06$129,000 Active - New
-
2015-03-12historical
-
2015-01-13price $129,900
-
2014-11-25$143,500 Active - New
-
2013-12-19price $105,900
-
2013-12-19price $57,900
-
2012-08-10historical
-
2012-01-22$119,900
-
2011-08-17soldstatus $88,000
-
2011-05-16soldstatus $46,000
-
2011-05-04historical
ⓘ Source: listings_history table (triggers on properties + properties_extension) + one-shot
backfill from property_details.listing_events for pre-trigger history.
Tax reassessment forecast RI · Partial reset (capped growth)
- Current annual tax
- $4,897 · $408/mo
- Projected year-2 tax
- $6,319 · $527/mo
- Expected delta
- +$1,422/yr (+$118/mo · 29.0%)
ⓘ Screening estimate from a state-policy table — verify with the county assessor before closing.
Climate risk First Street
- Flood 1/10 Low FEMA zone X (unshaded) · 0% chance over 30 yrs
- Wildfire 1/10 Low
- Heat 6/10 Major 7 d/yr ≥96°F today · 15 d/yr by 30 yrs out
- Wind 6/10 Major 70% chance of damaging wind over 30 yrs
- Air quality 2/10 Low 1 unhealthy d/yr today · 2 by 30 yrs out
Nearby sold comps map
Loading sold comps map…
Walkable amenities ~0.75 mi
Loading nearby amenities…
Taxation est. · year 1
- Rental income
- $65,208
- − Mortgage interest
- −$26,602
- − Property taxes
- −$4,897
- − Insurance
- −$2,374
- − Repairs & maintenance
- −$5,217
- − Management
- −$5,217
- − Depreciation
- −$13,815
- Taxable income
- $7,086
- Est. tax owed @ 24.0%
- −$1,701
- After-tax cash flow
- $12,657/yr
For passive investors: Depreciation is non-cash, so a rental often shows a tax loss while cash-flowing — sheltering income. Rental losses are passive: they offset passive income freely, and up to $25,000/yr can offset ordinary (W-2) income if you actively participate and your MAGI is under $100k (phasing out to $0 by $150k); unused losses carry forward. On sale, claimed depreciation is recaptured at up to 25%, and gains may owe capital-gains tax (a 1031 exchange can defer both). Figures are a year-1 estimate at your 24.0% rate — not tax advice; consult a CPA.
Schools (NCES district)
- District
- Pawtucket
- NCES district ID
- 4400840
- Math proficiency
- 7% ▼ -10.00%
- Reading proficiency
- 19% ▼ -5.00%
- Median HH income
- $41,838
- Composite
- 11.29/100
- National rank
- #9718
- State rank
- #33 of 39 in RI
Livability — Pawtucket
- Score
- 71/100
- State rank
- #16
- US rank
- #7037
Category grades
Schools grade is shown separately in the Schools card above.
Census & demographics
- Census place
- Pawtucket, RI
- County
- Providence County · 548,917 people
- City population
- 75,942
- Metro
- Providence-Warwick, RI-MA
- Population (ZIP)
- 47,818
- Household income
- $61,539
- Rent vs Own
- Severe rent burden
- 2528.0
Population outlook (Providence County) Hauer SSP2
- Today (2025)
- 653,469 people
- By 2030
- 660,819 · +1.1%
- By 2040
- 672,747 · +3.0%
- By 2050
- 683,741 · +4.6%
- By 2075
- 720,435 · +10.2%
- By 2100
- 741,582 · +13.5%
Race, ethnicity, and origin ACS 2023
- Neighborhood character
- Highly diverse neighborhood (Simpson 0.74)
- Race & ethnicity
- White 40% Hispanic / Latino 29% Two or more races 22% Black 14% Asian 1%
- Hispanic origin (detail)
- Mexican 2% Puerto Rican 9% Dominican 6%
- Common ancestry
- Russian 9% Lithuanian 4% Romanian 2%
- Foreign-born
- 28% · Canada, Jamaica
- Languages at home
- 57% English-only · Spanish 22% Other Indo-European 9% French/Haitian/Cajun 9%
Political lean MEDSL · Providence
- 2024 margin
- D (+14.4) · D 56.1% · R 41.7% · Other 2.2%
- 2008→2024 swing
- -20.0pp toward R · 2008: 34.4pp · 2024: 14.4pp
- All cycles
- 2024: D+14.4 2020: D+22.9 2016: D+21.2 2012: D+34.9 2008: D+34.4
Not yet ingested
- Civics
- —
Market trends
- HPI YoY
- ▼ -215.00%
- Current HPI
- 355.0152
- Rent YoY
- ▲ 3.47%
- Metro
- Providence-Warwick, RI-MA
- State GDP YoY
- ▲ 2.25%
- F500 in state
- 10
Industry mix (Fortune 500 HQ in RI)
| Industry | F500 HQs | Revenue |
|---|---|---|
| Healthcare | 1 | $373B |
|
||
| Food Distribution | 1 | $31B |
|
||
| Aerospace / Defense | 1 | $14B |
|
||
| Financial Services | 1 | $8B |
|
||
| Consumer Goods | 1 | $4B |
|
||
Price history
+692.8% since first listed44 events — show timeline
- 2026-06-10 Pending — RIS
- 2026-05-27 Contingent — RIS
- 2026-05-12 Listed $474,900 RIS
- 2026-04-03 Pending — RIS
- 2026-04-03 Listing Removed — RIS
- 2026-03-24 Listed $479,000 RIS
- 2026-03-16 Listing Removed — RIS
- 2026-02-20 Contingent — RIS
- 2026-02-04 Relisted — RIS
- 2026-01-21 Contingent — RIS
- 2026-01-05 Listed $479,000 RIS
- 2025-12-25 Listing Removed — RIS
- 2025-10-29 Listed $500,000 RIS
- 2025-10-27 Price Changed $500,000 RIS
- 2025-10-27 Listing Removed — RIS
- 2025-09-25 Price Changed $510,000 RIS
- 2025-09-09 Listed $525,000 RIS
- 2021-08-26 Sold (Public Records) $330,000 Public Records
- 2021-08-25 Sold (MLS) $320,000 RIS
- 2021-07-06 Pending — RIS
- 2021-06-24 Listed $325,000 RIS
- 2021-06-15 Pending — RIS
- 2021-06-15 Listing Removed — RIS
- 2021-05-21 Listed $325,000 RIS
- 2018-04-06 Listing Removed — RIS
- 2018-03-30 Sold (Public Records) $105,000 Public Records
- 2018-03-30 Sold (MLS) $105,000 RIS
- 2018-02-16 Contingent — RIS
- 2018-02-01 Listed $114,000 RIS
- 2016-08-09 Listing Removed — RIS
- 2016-07-07 Relisted — RIS
- 2016-07-07 Listing Removed — RIS
- 2016-07-06 Listed $129,000 RIS
- 2015-03-12 Listing Removed — RIS
- 2015-01-13 Price Changed $129,900 RIS
- 2014-11-25 Listed $143,500 RIS
- 2013-12-19 Price Changed $105,900 RIS
- 2013-12-19 Price Changed $57,900 RIS
- 2012-08-10 Listing Removed — RIS
- 2012-01-22 Listed $119,900 RIS
- 2011-08-17 Sold (Public Records) $88,000 Public Records
- 2011-05-16 Sold (MLS) $46,000 RIS
- 2011-05-04 Listing Removed — RIS
- 2010-09-26 Listed $59,900 RIS
Property tax history
+5.8%/yrLatest (2025): $4,897 · +6.6% YoY. Source: county tax records.
Cash-flow waterfall
monthlySold comps — $/sqft
last 12 mo · ≤1 miLoading sold comps…