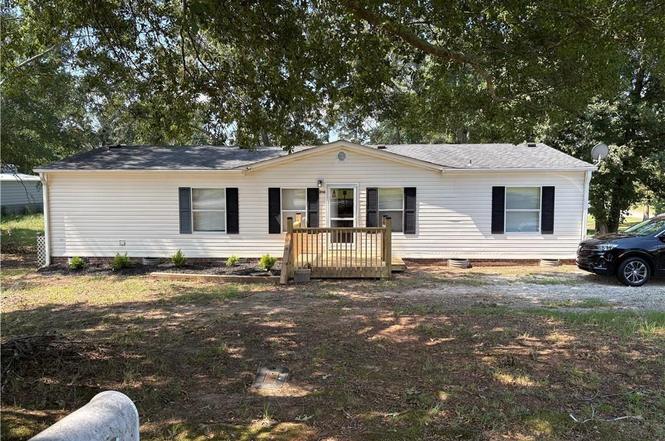
200 Sullivan Rd · Reed Creek, GA
Flood risk No data
- FEMA flood zone
- —
- Chance of flooding over 30 yrs
- —
- Est. flood insurance / yr
- —
Fire risk No data
- Est. fire insurance / yr
- —
Heat risk No data
- Hot days now (above threshold)
- —
- Hot days in 30 yrs
- —
Wind risk No data
- Chance of severe wind over 30 yrs
- —
Air-quality risk No data
- Unhealthy air days now
- —
- Unhealthy air days in 30 yrs
- —
Risk factors via First Street. Map © Google.
Why this score? — see what drove the C+ grade
The composite is a weighted blend of 9 inputs, each scored 0–100. Each bar is that input's sub-score; the figure is the points it added to the 100-point composite (weight × sub-score).
- Cash flow +23.7/30.0
- ARV discount +15.0/15.0
- DSCR +7.6/10.0
- 1% rule +5.0/10.0
- Schools +4.9/10.0
- Livability +3.2/5.0
- Rent growth +2.5/5.0
- Condition / age +2.5/5.0
- Appreciation +0.0/10.0
$172,500
🖨 Deal sheet (PDF) 📄 Offer letter ✓ Due diligence
Listing remarks
Seller will contribute to closing costs Official appraisal from 7/2025 is at $220,000 New HVAC, Appliances, Ceiling Fans and Led lighting We have financial experts that will work with you to obtain your financing
Key facts
- 0.5 acre lot
- Garage
- Listed 236 days
Property features AI
Finance
- Other: Property on/near Lake Hartwell; Lot dimensions approximately 100 x 181 x 76 x 181 (about 1/2 acre)
- HOA & community: No HOA fees or community amenities listed
Exterior
- Parking: Gravel driveway
- Utilities: Public water; Septic sewer; Electric power; No garbage pickup listed
- Home design: Single-story home; Corner lot; Approximately 21-30 years old; Slab foundation
- Construction: Vinyl siding construction; Composition shingle roof; Slab foundation; Built approximately 21-30 years ago
- Exterior features: Other/See remarks (additional exterior details referenced in remarks); Composition shingle roof; Vinyl siding
Interior
- Kitchen: Kitchen about 13 x 14; Dishwasher, refrigerator, electric cooktop, electric oven
- Bedrooms: Three main-level bedrooms; Primary bedroom includes a garden tub; Primary bedroom about 13 x 13; two other bedrooms about 10 x 13
- Flooring: Carpet; Laminate flooring
- Bathrooms: Two full bathrooms (both on the main level)
- Heating & cooling: Electric heating system; Electric cooling system; Electric water heater
- Interior features: Second living quarters with a kitchen/kitchenette on the main level; Other/See remarks (additional interior details referenced in remarks); No fireplace
- Laundry & utility: No laundry room listed
Neighborhood map
What this means for you Summary
Snapshot
- This is a 3-bed/2.0-bath manufactured listed at $172k.
Deal economics
- At list price, monthly cash flow is $327 ($4k/yr) — positive.
- The deal already cash-flows at list — no discount required.
- Meets the 1% rule at list price ($2k rent vs $172k).
- Recommended offer: $152k (12.0% below list) — sets the bar for market timing.
- Cap rate 8.6% vs local median 1.5% in Reed Creek — top-decile yield for the area; either an underpriced asset or a hidden risk that comps aren't pricing in. Stress-test before assuming the spread holds.
Location & tenants
- Location reads 65/100 on livability (#218 in GA) — a middle-class / working-renter tenant base. Strengths: crime A+, housing B+; Watch: health & safety C-, employment D, amenities F.
- Anderson 04 (rural): math 56% / reading 60% proficiency, ranked #4 of 80 in SC (top 5%) — acceptable for families but not a draw, mixed tenant base, ~2y average lease.
- Zoned schools: Pendleton Elementary (math 32% / reading 37%, grade F, #344 of 597 statewide, top 60%, 479 students, 100% FRL); Riverside Middle (math 48% / reading 55%, grade C, #34 of 229 statewide, top 15%, 426 students, 63% FRL); Pendleton High (math 72% / reading 92%, grade A, #19 of 196 statewide, top 10%, 880 students, 59% FRL) — zoned schools average 74% FRL vs 46% district-wide (28 pts higher); higher-poverty schools than district average — tighter screening recommended.
- Market conditions: 1,255 units permitted in Anderson County in 2024 (0 in 5+ unit buildings).
Forward outlook
- Local home prices are declining (-3.0%/yr); year-one equity from $1k of loan paydown is wiped out by about $5k of value loss. Plan a longer hold.
- Anderson County population projected at +14% by 2050 — modest demand growth; plan on rents tracking national, not racing it.
Negotiation context
- It's been on market 236 days — a 12% lower offer ($152k) is reasonable based on typical stale-listing flexibility.
- 6 sale attempts; this cycle's ask has dropped $18k (9%) from the opening price — seller is motivated, your offer sets the floor, not the list.
- Current owner paid $30k; list at $172k implies a 475% gain — meaningful room to come down on a strong offer.
Questions for the listing agent
- It's been on market 236 days. Have you received any prior offers? Is the seller open to a 12% concession, seller financing, or rate buy-down credit?
- Why hasn't it sold? Are there any deal-killer items the seller is aware of (foundation, flood, title, zoning, code violations)?
- Is there a deadline driving the sale (1031 exchange, divorce, estate, relocation)? That informs how much negotiation room exists.
- Schools are F-rated, which usually means shorter tenancies and higher turnover. Who's the typical renter profile here, and what's been the actual vacancy rate?
- What's the average days-on-market for RENTAL listings here right now (not sales)? A rising rental-DOM trend means longer vacancies and softer asking-rent achievability than the comps imply.
- What's the recent tenant-quality profile in this submarket — average credit score on applications, eviction rate, late-payment / NSF rate, and stable-employment percentage? A property-management company in the area should have these aggregated.
- How much new for-sale + rental construction is in the pipeline within 1–3 miles? Heavy new supply typically softens prices + rents 12–24 months out; constrained supply supports both.
Investment metrics
- 1% rule
- 1.00% ✓
- Cap rate
- 8.57%
- Cash-on-cash
- 8.12%
- DSCR
- 1.36
- GRM
- 8.3
CMA / ARV
- ARV (on-the-fly)
- $224,224
- Comps found
- 3
Show comp detail 3 sales within ~0.75 mi
| Address | Dist | Beds/Ba | Sqft | Sold | Price | $/sf | Match |
|---|---|---|---|---|---|---|---|
| 105 Viewmont Dr | 0.32mi | 3/2.0 | 1,456 (0%) | 1mo | $189,900 | $130 | 84 |
| 104 Cove Dr | 0.05mi | 3/2.0 | 1,400 (-4%) | 11mo | $380,000 | $271 | 82 |
| 109 Viewmont Dr | 0.30mi | 3/2.0 | 1,264 (-13%) | 13mo | $195,000 | $154 | 53 |
Match score weights: distance 35% · size 25% · config 20% · recency 20%. Top-matched comps best support the ARV.
Projected returns pro-forma
-3.0% appreciation · 3.0% rent growth · sell at horizon
- IRR
- -4.0%
- Equity multiple
- 0.85×
- Total profit
- $-7,193
- Equity at exit
- $25,720
- IRR
- 5.7%
- Equity multiple
- 1.42×
- Total profit
- $20,278
- Equity at exit
- $14,915
Cash invested: $48,300 (down + closing). Projections, not guarantees.
Landlord ↔ Tenant lean methodology
- Overall (STATE)
- 90 Strongly Landlord-Friendly
- State Georgia
- 90 Strongly Landlord-Friendly · R+3
- County
- — inherits STATE
- City
- — inherits STATE
ZIP-level market 29643
- Home prices YoY
- -13.3%
- Price-to-rent
- 8.3×
Monthly cashflow live
- Estimated rent
- $1,729 medium interval (Pro) →
- Mortgage (P&I)
- −$905
- Tax from tax record
- −$62 /mo · $747/yr
- Insurance
- −$72
- HOA
- −$0
- Vacancy / Maint / Mgmt
- −$363
- Net cashflow
- $327
Break-even live
Sensitivity live
| Price | -10% $425 | -5% $376 | +0% $327 | +5% $278 | +10% $229 |
|---|---|---|---|---|---|
| Rent | -10% $190 | -5% $259 | +0% $327 | +5% $395 | +10% $464 |
| Rate | -1.0pp $414 | -0.5pp $371 | base $327 | +0.5pp $282 | +1.0pp $237 |
UW: 25.0% down · 7.5% · 30yr · 1.5% tax · 5.0% vac · 8.0% maint · 8.0% mgmt
Financing live
Cash to close
- Down payment
- $43,125
- Closing costs
- $5,175
- Reserves months
- —
- Total cash needed
- —
Loan-product check · same deal, 3 products live
Conventional
25% down · 7.5% · 30yr
- Down + closing
- —
- Monthly P&I
- —
- Monthly cashflow
- —
- DSCR
- —
- Eligible?
- —
Personal DTI + credit; lowest rate.
DSCR
20% down · 8.5% · 30yr
- Down + closing
- —
- Monthly P&I
- —
- Monthly cashflow
- —
- DSCR
- —
- Eligible?
- —
No personal income docs; deal must DSCR.
Hard money
10% down · 12.0% · 12mo
- Down + closing
- —
- Monthly P&I
- —
- Monthly cashflow
- —
- DSCR
- —
- Eligible?
- —
Short-term bridge; refi at stabilization.
Listing history 38 events
-
2026-06-22days on market $172,500 Active 236 DOM
-
2026-06-18days on market $172,500 Active 233 DOM
-
2026-06-17days on market $172,500 Active 232 DOM
-
2026-06-16days on market $172,500 Active 231 DOM
-
2026-06-15days on market $172,500 Active 230 DOM
-
2026-06-13days on market $172,500 Active 228 DOM
-
2026-06-13days on market $172,500 Active 227 DOM
-
2026-06-10days on market $172,500 Active 225 DOM
-
2026-06-09days on market $172,500 Active 224 DOM
-
2026-06-08days on market $172,500 Active 223 DOM
-
2026-06-07days on market $172,500 Active 222 DOM
-
2026-06-05days on market $172,500 Active 219 DOM
-
2026-06-03days on market $172,500 Active 218 DOM
-
2026-06-03days on market $172,500 Active 217 DOM
-
2026-06-01days on market $172,500 Active 216 DOM
-
2026-05-31days on market $172,500 Active 215 DOM
-
2026-04-29price $172,500
-
2026-04-28status Active
-
2026-04-21price $172,500
-
2026-04-11historical
-
2026-04-09price $179,000
-
2026-03-06price $182,000
-
2026-03-05price $180,200
-
2025-12-30price $190,500
-
2025-12-03historical
-
2025-11-03$190,500 Active
-
2025-11-02$195,000 Active
-
2025-10-10price $195,000
-
2025-10-10$195,000,000 Active
-
2025-10-01historical
-
2025-09-30historical
-
2025-09-22price $195,300
-
2025-07-07$195,500 Active
-
2025-07-07$195,500 Active
-
2010-11-03soldstatus $30,000
-
2007-09-24soldstatus $17,000
-
2004-03-31soldstatus $14,000
-
1995-06-01soldstatus $35,000
ⓘ Source: listings_history table (triggers on properties + properties_extension) + one-shot
backfill from property_details.listing_events for pre-trigger history.
Tax reassessment forecast GA · Resets to sale price
- Current annual tax
- $747 · $62/mo
- Projected year-2 tax
- $1,587 · $132/mo
- Expected delta
- +$840/yr (+$70/mo · 112.4%)
ⓘ Screening estimate from a state-policy table — verify with the county assessor before closing.
Nearby sold comps map
Loading sold comps map…
Walkable amenities ~0.75 mi
Loading nearby amenities…
Taxation est. · year 1
- Rental income
- $20,746
- − Mortgage interest
- −$9,663
- − Property taxes
- −$747
- − Insurance
- −$862
- − Repairs & maintenance
- −$1,660
- − Management
- −$1,660
- − Depreciation
- −$5,018
- Taxable income
- $1,136
- Est. tax owed @ 24.0%
- −$273
- After-tax cash flow
- $3,652/yr
For passive investors: Depreciation is non-cash, so a rental often shows a tax loss while cash-flowing — sheltering income. Rental losses are passive: they offset passive income freely, and up to $25,000/yr can offset ordinary (W-2) income if you actively participate and your MAGI is under $100k (phasing out to $0 by $150k); unused losses carry forward. On sale, claimed depreciation is recaptured at up to 25%, and gains may owe capital-gains tax (a 1031 exchange can defer both). Figures are a year-1 estimate at your 24.0% rate — not tax advice; consult a CPA.
Schools (NCES district)
- District
- Anderson 04
- NCES district ID
- 4500870
- Math proficiency
- 56% ▼ -5.00%
- Reading proficiency
- 60% ▼ -1.00%
- Median HH income
- $48,338
- Composite
- 49.25/100
- National rank
- #2030
- State rank
- #4 of 80 in SC
Livability — Reed Creek
- Score
- 65/100
- State rank
- #218
- US rank
- #12917
Category grades
Schools grade is shown separately in the Schools card above.
Census & demographics
- Population (ZIP)
- 2,887
Population outlook (Anderson County) Hauer SSP2
- Today (2025)
- 210,546 people
- By 2030
- 217,791 · +3.4%
- By 2040
- 230,643 · +9.5%
- By 2050
- 240,220 · +14.1%
- By 2075
- 259,518 · +23.3%
- By 2100
- 258,696 · +22.9%
Race, ethnicity, and origin ACS 2023
- Neighborhood character
- Predominantly White (95%)
- Race & ethnicity
- White 95% Hispanic / Latino 3% Asian 2% Two or more races 1%
- Common ancestry
- Serbian 9% Romanian 5% Polish 4%
- Foreign-born
- 2% · Canada
- Languages at home
- 97% English-only · German/W. Germanic 1% Spanish 1% Korean 1%
Political lean MEDSL · Anderson
- 2024 margin
- Solid R (+47.4) · D 25.7% · R 73.1% · Other 1.2%
- 2008→2024 swing
- -14.1pp toward R · 2008: -33.3pp · 2024: -47.4pp
- All cycles
- 2024: R+47.4 2020: R+42.0 2016: R+43.7 2012: R+36.4 2008: R+33.3
Not yet ingested
- Civics
- —
Market trends
- HPI YoY
- ▼ -40.87%
- Current HPI
- 265.6967
- Rent YoY
- —
- Metro
- —
- State GDP YoY
- ▲ 2.66%
- F500 in state
- 28
Industry mix (Fortune 500 HQ in GA)
| Industry | F500 HQs | Revenue |
|---|---|---|
| Paper / Packaging | 2 | $29B |
|
||
| Retail | 1 | $160B |
|
||
| Transportation / Logistics | 1 | $91B |
|
||
| Airlines | 1 | $62B |
|
||
| Consumer Goods | 1 | $47B |
|
||
| Utilities | 1 | $25B |
|
||
Price history
+392.9% since first listed22 events — show timeline
- 2026-04-29 Price Changed $172,500 WUMLS
- 2026-04-28 Relisted — Greater Greenville MLS
- 2026-04-21 Price Changed $172,500 Greater Greenville MLS
- 2026-04-11 Listing Removed — Greater Greenville MLS
- 2026-04-09 Price Changed $179,000 Greater Greenville MLS
- 2026-03-06 Price Changed $182,000 Greater Greenville MLS
- 2026-03-05 Price Changed $180,200 WUMLS
- 2025-12-30 Price Changed $190,500 Greater Greenville MLS
- 2025-12-03 Listing Removed — Greater Greenville MLS
- 2025-11-03 Listed $190,500 WUMLS
- 2025-11-02 Listed $195,000 Greater Greenville MLS
- 2025-10-10 Price Changed $195,000 Greater Greenville MLS
- 2025-10-10 Listed $195,000,000 Greater Greenville MLS
- 2025-10-01 Listing Removed — Greater Greenville MLS
- 2025-09-30 Listing Removed — WUMLS
- 2025-09-22 Price Changed $195,300 WUMLS
- 2025-07-07 Listed $195,500 WUMLS
- 2025-07-07 Listed $195,500 Greater Greenville MLS
- 2010-11-03 Sold (Public Records) $30,000 Public Records
- 2007-09-24 Sold (Public Records) $17,000 Public Records
- 2004-03-31 Sold (Public Records) $14,000 Public Records
- 1995-06-01 Sold (Public Records) $35,000 Public Records
Property tax history
+1.6%/yrLatest (2022): $747 · +7.5% YoY. Source: county tax records.
Cash-flow waterfall
monthlySold comps — $/sqft
last 12 mo · ≤1 miLoading sold comps…