2632 Prima Vista Dr · Fort Worth, TX
Flood risk No data
- FEMA flood zone
- —
- Chance of flooding over 30 yrs
- —
- Est. flood insurance / yr
- —
Fire risk No data
- Est. fire insurance / yr
- —
Heat risk No data
- Hot days now (above threshold)
- —
- Hot days in 30 yrs
- —
Wind risk No data
- Chance of severe wind over 30 yrs
- —
Air-quality risk No data
- Unhealthy air days now
- —
- Unhealthy air days in 30 yrs
- —
Risk factors via First Street. Map © Google.
Why this score? — see what drove the D- grade
The composite is a weighted blend of 9 inputs, each scored 0–100. Each bar is that input's sub-score; the figure is the points it added to the 100-point composite (weight × sub-score).
- Cash flow +13.5/30.0
- ARV discount +7.5/15.0
- DSCR +4.1/10.0
- Livability +4.0/5.0
- 1% rule +2.9/10.0
- Rent growth +2.5/5.0
- Condition / age +2.5/5.0
- Schools +2.0/10.0
- Appreciation +0.0/10.0
$293,999
🖨 Deal sheet (PDF) 📄 Offer letter ✓ Due diligence
Listing remarks
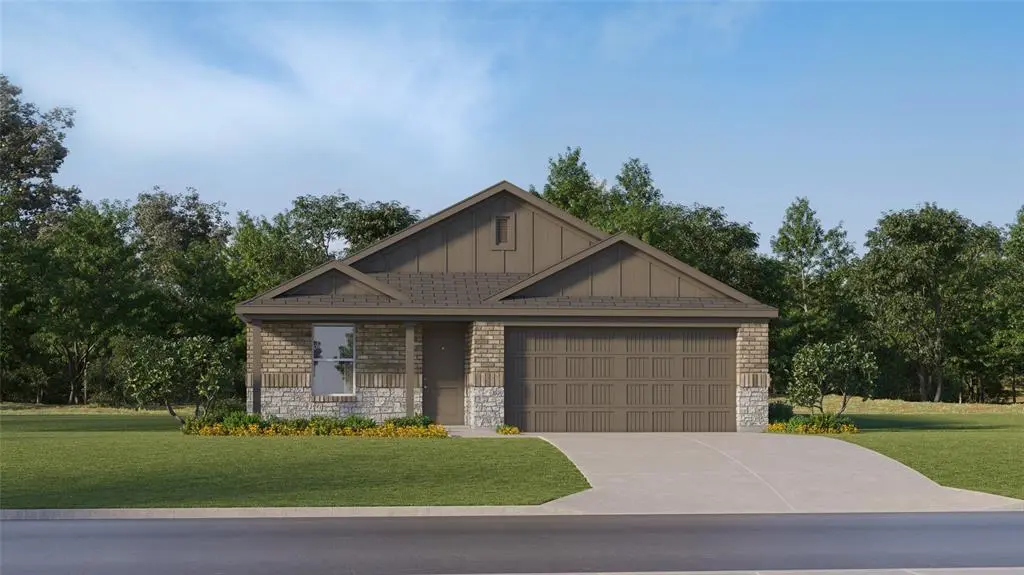
West Square - Ramsey Floorplan
Key facts
- 5,750 sq ft lot
- 2 garage spots
- Built 2025
Neighborhood map
What this means for you Summary
Snapshot
- This is a 4-bed/2.0-bath other listed at $294k.
Deal economics
- At list price, monthly cash flow is $9 ($102/yr) — positive.
- The deal already cash-flows at list — no discount required.
- To meet the 1% rule (rent ≥ 1% of price), the offer needs to be $233k (20.6% below list).
- Recommended offer: $233k (20.6% below list) — sets the bar for 1% rule.
- Cap rate 6.3% vs local median 3.9% in Fort Worth — top-decile yield for the area; either an underpriced asset or a hidden risk that comps aren't pricing in. Stress-test before assuming the spread holds.
Location & tenants
- Location reads 80/100 on livability (#49 in TX, #1,954 nationally) — a professional / high-income tenant draw. Strengths: amenities A+, cost of living A+, housing A+; Watch: crime F.
- Fort Worth ISD (urban): math 18% / reading 28% proficiency, ranked #742 of 826 in TX (top 90%) — low school quality limits family demand, transient renter base, plan for 1-2y turnover; 73% free/reduced lunch — lower-income household profile, screen leases tightly.
- Zoned schools: Western Hills El (math 10% / reading 18%, grade F, #4,127 of 4,322 statewide, top 96%, 548 students, 97% FRL) — zoned schools average 97% FRL vs 73% district-wide (24 pts higher); higher-poverty schools than district average — tighter screening recommended.
- Market conditions: Rents soft (-0.2%/yr); 553 active listings in the ZIP; 40 comparable units currently listed for rent nearby; rentals at typical pace (median 23d on market — plan ~3-4 weeks tenant-placement turnaround); solid renter incomes; 18,938 units permitted in Tarrant County in 2024 (8,336 in 5+ unit buildings).
- This rent runs 35% of the median local income ($80k/yr) — at the standard rent-burdened threshold; future hikes will face affordability resistance.
Forward outlook
- Local home prices are declining (-3.0%/yr); year-one equity from $2k of loan paydown is wiped out by about $9k of value loss. Plan a longer hold.
- Tarrant County population projected at +41% by 2050 — long-run rental-demand tailwind backs the buy-and-hold thesis.
Negotiation context
- It's been on market 15 days — a 2% lower offer ($290k) is reasonable based on typical stale-listing flexibility.
Questions for the listing agent
- What does the HOA fee cover, when was the last increase, and are there any pending special assessments or reserve-fund shortfalls?
- Is there a deadline driving the sale (1031 exchange, divorce, estate, relocation)? That informs how much negotiation room exists.
- Schools are D-rated, which usually means shorter tenancies and higher turnover. Who's the typical renter profile here, and what's been the actual vacancy rate?
- Crime grade is F in this area — have there been break-ins, vandalism, or insurance claims at this property in the last 3 years? What carrier currently insures it and at what premium?
- The area grade is low — what's the realistic commute time and amenity access for the typical tenant pool here? Any planned neighborhood developments (good or bad) we should know about?
- What's the average days-on-market for RENTAL listings here right now (not sales)? A rising rental-DOM trend means longer vacancies and softer asking-rent achievability than the comps imply.
- What's the recent tenant-quality profile in this submarket — average credit score on applications, eviction rate, late-payment / NSF rate, and stable-employment percentage? A property-management company in the area should have these aggregated.
- How much new for-sale + rental construction is in the pipeline within 1–3 miles? Heavy new supply typically softens prices + rents 12–24 months out; constrained supply supports both.
Investment metrics
- 1% rule
- 0.79% ✗
- Cap rate
- 6.33%
- Cash-on-cash
- 0.12%
- DSCR
- 1.01
- GRM
- 10.5
CMA / ARV
No comps found within radius.
Projected returns pro-forma
-3.0% appreciation · 0.0% rent growth · sell at horizon
- IRR
- -19.2%
- Equity multiple
- 0.34×
- Total profit
- $-54,021
- Equity at exit
- $43,836
- IRR
- -18.9%
- Equity multiple
- 0.11×
- Total profit
- $-73,115
- Equity at exit
- $25,420
Cash invested: $82,320 (down + closing). Projections, not guarantees.
Landlord ↔ Tenant lean methodology
- Overall (STATE)
- 87 Strongly Landlord-Friendly
- State Texas
- 87 Strongly Landlord-Friendly · R+5
- County
- — inherits STATE
- City
- — inherits STATE
ZIP-level market 76108
- Home prices YoY
- -32.5%
- Rents YoY
- -0.2%
- Active inventory
- 553
- Price-to-rent
- 10.5×
Monthly cashflow live
- Estimated rent
- $2,333 high interval (Pro) →
- Mortgage (P&I)
- −$1,542
- Tax from tax record
- −$89 /mo · $1,073/yr
- Insurance
- −$122
- HOA
- −$81
- Vacancy / Maint / Mgmt
- −$490
- Net cashflow
- $9
Break-even live
Sensitivity live
| Price | -10% $175 | -5% $92 | +0% $9 | +5% $-75 | +10% $-158 |
|---|---|---|---|---|---|
| Rent | -10% $-176 | -5% $-84 | +0% $9 | +5% $101 | +10% $193 |
| Rate | -1.0pp $157 | -0.5pp $83 | base $9 | +0.5pp $-68 | +1.0pp $-145 |
UW: 25.0% down · 7.5% · 30yr · 1.5% tax · 5.0% vac · 8.0% maint · 8.0% mgmt
Financing live
Cash to close
- Down payment
- $73,500
- Closing costs
- $8,820
- Reserves months
- —
- Total cash needed
- —
Loan-product check · same deal, 3 products live
Conventional
25% down · 7.5% · 30yr
- Down + closing
- —
- Monthly P&I
- —
- Monthly cashflow
- —
- DSCR
- —
- Eligible?
- —
Personal DTI + credit; lowest rate.
DSCR
20% down · 8.5% · 30yr
- Down + closing
- —
- Monthly P&I
- —
- Monthly cashflow
- —
- DSCR
- —
- Eligible?
- —
No personal income docs; deal must DSCR.
Hard money
10% down · 12.0% · 12mo
- Down + closing
- —
- Monthly P&I
- —
- Monthly cashflow
- —
- DSCR
- —
- Eligible?
- —
Short-term bridge; refi at stabilization.
Rent comps 40 comps
| Address | Beds | Baths | Sqft | Rent | $/sqft | DOM | Units | Dist |
|---|---|---|---|---|---|---|---|---|
| 10116 Dalgreen Cir Fort Worth, TX | 4.0 | 2.0 | 1667 | $2,420 | $1.45 | 45d | 1 | 0.15mi |
| 2713 Center Creek Ln Fort Worth, TX | 3.0 | 2.0 | 1464 | $2,340 | $1.60 | 7d | 1 | 0.18mi |
| 10136 Dalgreen Cir Fort Worth, TX | 3.0–4.0 | 2.0–2.5 | 1575 | $2,475 | $1.57 | 0d | 1 | 0.20mi |
| 2408 Edisto Beach Dr Fort Worth, TX | 4.0 | 2.0 | 1773 | $2,199 | $1.24 | 7d | 1 | 0.20mi |
| 10140 Dalgreen Cir Fort Worth, TX | 4.0 | 2.0 | 1660 | $2,420 | $1.46 | 8d | 1 | 0.21mi |
| 2708 River Knoll Ln Fort Worth, TX | 4.0 | 2.0 | 1667 | $2,365 | $1.42 | 45d | 1 | 0.21mi |
| 2712 River Knoll Ln Fort Worth, TX | 3.0 | 2.0 | 1260 | $2,099 | $1.67 | 17d | 1 | 0.22mi |
| 2636 Mistwood Dr Fort Worth, TX | 3.0 | 2.0 | 2160 | $2,210 | $1.02 | 7d | 1 | 0.23mi |
| 2716 River Knoll Ln Fort Worth, TX | 3.0 | 2.0 | 1260 | $2,099 | $1.67 | 22d | 1 | 0.23mi |
| 2656 Mistwood Dr Fort Worth, TX | 3.0 | 2.0 | 1260 | $2,245 | $1.78 | 4d | 1 | 0.23mi |
| 2745 Center Creek Ln Fort Worth, TX | 3.0 | 2.0 | 1260 | $2,225 | $1.77 | 45d | 1 | 0.24mi |
| 2205 Sadlers Creek Ln Fort Worth, TX | 3.0 | 2.0 | 2132 | $2,105 | $0.99 | 26d | 1 | 0.24mi |
| 2205 Sadlers Creek Ln Fort Worth, TX | 3.0 | 2.0 | 1802 | $2,326 | $1.29 | 45d | 1 | 0.24mi |
| 2712 Mistwood Dr Fort Worth, TX | 3.0 | 2.0 | 1474 | $2,309 | $1.57 | 45d | 1 | 0.25mi |
| 2712 Mistwood Dr Fort Worth, TX | 3.0 | 2.0 | 1474 | $2,295 | $1.56 | 21d | 1 | 0.25mi |
| 2316 Stallings Rd Fort Worth, TX | 3.0 | 2.0 | 1429 | $2,295 | $1.61 | 26d | 1 | 0.29mi |
| 2757 Mistwood Dr Fort Worth, TX | 4.0 | 2.0 | 1707 | $2,375 | $1.39 | 4d | 1 | 0.29mi |
| 9704 Calhoun Falls Dr Fort Worth, TX | 3.0 | 2.0 | 1469 | $2,175 | $1.48 | 26d | 1 | 0.30mi |
| 2765 Mistwood Dr Fort Worth, TX | 3.0 | 2.0 | 1474 | $2,275 | $1.54 | 45d | 1 | 0.31mi |
| 2220 Barnwell Dr Fort Worth, TX | 3.0 | 2.0 | 1463 | $2,200 | $1.50 | 12d | 1 | 0.34mi |
| 9724 Apex Dr Fort Worth, TX | 4.0 | 2.0 | 1880 | $2,350 | $1.25 | 45d | 1 | 0.37mi |
| 9708 Apex Dr Fort Worth, TX | 4.0 | 2.0 | 1776 | $2,300 | $1.30 | 45d | 1 | 0.40mi |
| 10241 Pleasant Mound Dr Fort Worth, TX | 3.0 | 2.0 | 1765 | $2,090 | $1.18 | 14d | 1 | 0.45mi |
| 9732 Walnut Cove Dr Fort Worth, TX | 4.0 | 2.0 | 1584 | $2,074 | $1.31 | 22d | 1 | 0.45mi |
| 10240 Dawson Trl Fort Worth, TX | 3.0 | 2.5 | 1844 | $1,871 | $1.01 | 45d | 1 | 0.50mi |
| 10061 Pronghorn Ln Fort Worth, TX | 3.0 | 2.0 | 1694 | $1,995 | $1.18 | 3d | 1 | 0.52mi |
| 9749 Fallston Dr Fort Worth, TX | 4.0 | 2.0 | 1773 | $2,550 | $1.44 | 46d | 1 | 0.53mi |
| 10221 Dallam Ln Fort Worth, TX | 3.0 | 2.0 | 1464 | $1,969 | $1.34 | 45d | 1 | 0.54mi |
| 3104 Middleview Rd Fort Worth, TX | 3.0 | 2.0 | 1540 | $1,995 | $1.30 | 26d | 1 | 0.54mi |
| 2521 Ensenada Ln Fort Worth, TX | 3.0 | 2.0 | 1600 | $1,950 | $1.22 | 45d | 1 | 0.57mi |
| 3120 Middleview Rd Fort Worth, TX | 3.0 | 2.5 | 1543 | $1,899 | $1.23 | 0d | 1 | 0.58mi |
| 2213 Rolling Creek Run Fort Worth, TX | 3.0 | 2.0 | 1244 | $2,095 | $1.68 | 0d | 1 | 0.58mi |
| 10409 Pleasant Mound Dr Fort Worth, TX | 3.0 | 2.0 | 1441 | $1,925 | $1.34 | 45d | 1 | 0.59mi |
| 9925 Amaryllis Ln Fort Worth, TX | 3.0 | 2.0 | 1556 | $2,195 | $1.41 | 17d | 1 | 0.60mi |
| 2732 Brea Canyon Rd Fort Worth, TX | 3.0 | 2.0 | 1582 | $2,100 | $1.33 | 18d | 1 | 0.61mi |
| 9721 Cherryville Rd Fort Worth, TX | 4.0 | 2.0 | 1814 | $2,500 | $1.38 | 18d | 1 | 0.61mi |
| 2516 Concina Way Fort Worth, TX | 3.0 | 2.0 | 1464 | $1,879 | $1.28 | 21d | 1 | 0.64mi |
| 3213 Westland Ave Fort Worth, TX | 3.0 | 2.0 | 1509 | $1,995 | $1.32 | 45d | 1 | 0.67mi |
| 9413 Fallston Dr Fort Worth, TX | 4.0 | 2.0 | 1649 | $2,455 | $1.49 | 45d | 1 | 0.73mi |
| 1625 Gatesville Ct Fort Worth, TX | 4.0 | 2.0 | 1729 | $2,510 | $1.45 | 7d | 1 | 0.77mi |
HOA detail
- Monthly dues
- $81 · $972/yr
Listing history 7 events
-
2026-06-21days on market $293,999 Active 15 DOM
-
2026-06-18days on market $293,999 Active 12 DOM
-
2026-06-17days on market $293,999 Active 11 DOM
-
2026-06-16days on market $293,999 Active 10 DOM
-
2026-06-15pricestatus $293,999 Active 9 DOM
-
2026-03-29status Pending
-
2026-03-20$297,199 Active
ⓘ Source: listings_history table (triggers on properties + properties_extension) + one-shot
backfill from property_details.listing_events for pre-trigger history.
Tax reassessment forecast TX · Resets to sale price
- Current annual tax
- $1,073 · $89/mo
- Projected year-2 tax
- $5,380 · $448/mo
- Expected delta
- +$4,308/yr (+$359/mo · 401.6%)
ⓘ Screening estimate from a state-policy table — verify with the county assessor before closing.
Nearby sold comps map
Loading sold comps map…
Walkable amenities ~0.75 mi
Loading nearby amenities…
Taxation est. · year 1
- Rental income
- $27,998
- − Mortgage interest
- −$16,469
- − Property taxes
- −$1,073
- − Insurance
- −$1,470
- − Repairs & maintenance
- −$2,240
- − Management
- −$2,240
- − HOA
- −$972
- − Depreciation
- −$8,553
- Taxable loss
- −$5,018
- Est. tax savings @ 24.0%
- +$1,204
- After-tax cash flow
- $1,307/yr
For passive investors: Depreciation is non-cash, so a rental often shows a tax loss while cash-flowing — sheltering income. Rental losses are passive: they offset passive income freely, and up to $25,000/yr can offset ordinary (W-2) income if you actively participate and your MAGI is under $100k (phasing out to $0 by $150k); unused losses carry forward. On sale, claimed depreciation is recaptured at up to 25%, and gains may owe capital-gains tax (a 1031 exchange can defer both). Figures are a year-1 estimate at your 24.0% rate — not tax advice; consult a CPA.
Schools (NCES district)
- District
- Fort Worth ISD
- NCES district ID
- 4819700
- Math proficiency
- 18% ▼ -16.00%
- Reading proficiency
- 28% ▼ -6.00%
- Median HH income
- $42,109
- Composite
- 19.61/100
- National rank
- #8753
- State rank
- #742 of 826 in TX
Livability — Fort Worth
- Score
- 80/100
- State rank
- #49
- US rank
- #1954
Category grades
Schools grade is shown separately in the Schools card above.
Census & demographics
- Census place
- Fort Worth, TX
- County
- Tarrant County · 2,033,669 people
- City population
- 911,619
- Metro
- Dallas-Fort Worth-Arlington, TX
- Population (ZIP)
- 45,537
- Household income
- $80,412
- Rent vs Own
- Severe rent burden
- 774.0
Population outlook (Tarrant County) Hauer SSP2
- Today (2025)
- 2,380,417 people
- By 2030
- 2,578,900 · +8.3%
- By 2040
- 2,974,995 · +25.0%
- By 2050
- 3,350,489 · +40.8%
- By 2075
- 4,216,909 · +77.2%
- By 2100
- 4,741,527 · +99.2%
Race, ethnicity, and origin ACS 2023
- Neighborhood character
- Diverse neighborhood (Simpson 0.62)
- Race & ethnicity
- White 52% Hispanic / Latino 32% Two or more races 17% Black 8% Asian 3% Native American 1%
- Hispanic origin (detail)
- Mexican 26% Puerto Rican 1%
- Common ancestry
- Slovak 2% Lithuanian 1% Romanian 1%
- Foreign-born
- 11% · Canada, Vietnam
- Languages at home
- 76% English-only · Spanish 21% Vietnamese 1% Tagalog/Filipino 1%
Political lean MEDSL · Tarrant
- 2024 margin
- Lean R (+5.1) · D 46.7% · R 51.9% · Other 1.4%
- 2008→2024 swing
- +6.6pp toward D · 2008: -11.7pp · 2024: -5.1pp
- All cycles
- 2024: R+5.1 2020: D+0.2 2016: R+8.7 2012: R+15.7 2008: R+11.7
Not yet ingested
- Civics
- —
Market trends
- HPI YoY
- ▼ -141.39%
- Current HPI
- 294.2459
- Rent YoY
- ▼ -0.18%
- Metro
- Dallas-Fort Worth-Arlington, TX
- State GDP YoY
- ▲ 3.95%
- F500 in state
- 110
Industry mix (Fortune 500 HQ in TX)
| Industry | F500 HQs | Revenue |
|---|---|---|
| Energy | 16 | $1,198B |
|
||
| Technology | 5 | $198B |
|
||
| Engineering / Construction | 4 | $72B |
|
||
| Energy Services | 3 | $60B |
|
||
| Utilities | 3 | $41B |
|
||
| Healthcare | 2 | $330B |
|
||
Price history
2 events — show timeline
- 2026-03-29 Pending — NTREIS
- 2026-03-20 Listed $297,199 NTREIS
Cash-flow waterfall
monthlySold comps — $/sqft
last 12 mo · ≤1 miLoading sold comps…