203 W Cincinnati St · Fort Towson, OK
Flood risk 1/10 · Minimal
- FEMA flood zone
- —
- Chance of flooding over 30 yrs
- 0.0%
- Est. flood insurance / yr
- —
Fire risk 5/10 · Moderate
- Est. fire insurance / yr
- $2,463 – $4,575
Heat risk 6/10 · Moderate
- Hot days now (above 111°F)
- 7 days/yr
- Hot days in 30 yrs
- 21 days/yr
Wind risk 4/10 · Minor
- Chance of severe wind over 30 yrs
- 11.0%
Air-quality risk 2/10 · Minimal
- Unhealthy air days now
- 0 days/yr
- Unhealthy air days in 30 yrs
- 1 days/yr
Risk factors via First Street. Map © Google.
Why this score? — see what drove the B- grade
The composite is a weighted blend of 9 inputs, each scored 0–100. Each bar is that input's sub-score; the figure is the points it added to the 100-point composite (weight × sub-score).
- Cash flow +30.0/30.0
- DSCR +10.0/10.0
- 1% rule +7.9/10.0
- ARV discount +7.5/15.0
- Appreciation +4.8/10.0
- Livability +3.1/5.0
- Rent growth +2.5/5.0
- Condition / age +2.5/5.0
- Schools +1.6/10.0
$99,000
🖨 Deal sheet 📄 Offer letter ✓ Due diligence
Listing remarks
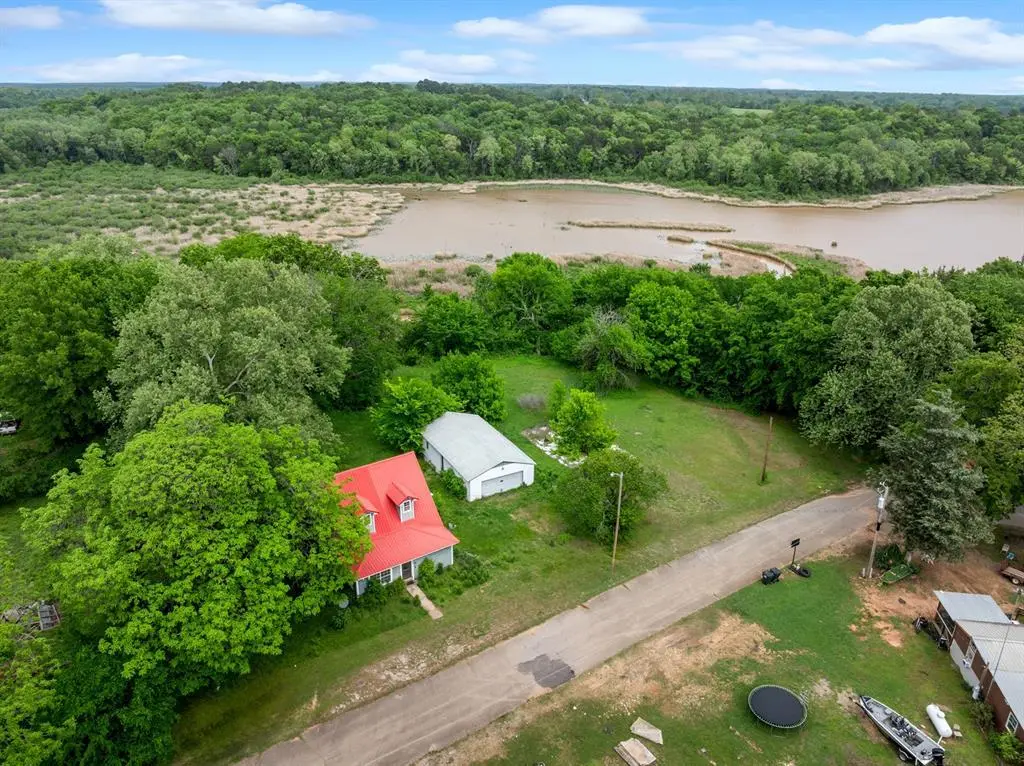
INVESTOR OPPORTUNITY call 713-628-6154 for appointments Located at 203 E Cincinnati St in Fort Towson, Oklahoma, this 4 bedroom, 2 bathroom property is ready for its next chapter. Whether you’re looking to renovate, hold, or resell, this home presents a solid opportunity to add value. Easily recognizable by its red metal roof, this cottage-style home offers flexibility and strong potential for investors looking to maximize value. With the right vision, this property can be transformed into a strong income-producing asset or resale project. Being sold AS-IS, this home is priced with opportunity in mind and is ideal for investors, flippers, or buyers looking for their next project. Pro
Key facts
- Red metal roof
- Cottage-style home
- 0.32 acre lot
Tags
Property features AI
Finance
- Other: Homestead exempt; Vacant and currently unoccupied
- Financial info: Sold as-is; cash offers accepted; Not assumable
- HOA & community: No mandatory association dues
Exterior
- Utilities: Electricity available; Public utilities
- Home design: One-and-one-half level residential single-family home; Located in Fort Towson Original addition
- Construction: Frame and other construction materials; Metal roof; Slab foundation; Built as an existing property
- Exterior features: Outbuildings; Wooded lot; Waterfront lot; Other lot features
Interior
- Bedrooms: 4 bedrooms
- Bathrooms: 2 full bathrooms
- Heating & cooling: Electric heating
- Interior features: Seven living areas; No fireplace
Neighborhood map
What this means for you Summary
Snapshot
- This is a 3-bed/1.0-bath single-family listed at $99k.
Deal economics
- At list price, monthly cash flow is $398 ($5k/yr) — positive.
- The deal already cash-flows at list — no discount required.
- Meets the 1% rule at list price ($1k rent vs $99k).
- Recommended offer: $96k (3.0% below list) — sets the bar for market timing.
Location & tenants
- Location reads 62/100 on livability (#250 in OK) — a middle-class / working-renter tenant base. Strengths: crime A+, cost of living A+, housing A+; Watch: amenities F, commute F, employment F.
- Fort Towson (rural): math 10% / reading 20% proficiency, ranked #477 of 513 in OK (top 93%) — low school quality limits family demand, transient renter base, plan for 1-2y turnover; 75% free/reduced lunch — lower-income household profile, screen leases tightly.
- Zoned schools: Fort Towson Es (math 12% / reading 8%, grade F, #711 of 845 statewide, top 87%, 177 students, 0% FRL); Fort Towson Hs (math 10% / reading 10%, grade F, #361 of 447 statewide, top 94%, 81 students, 0% FRL) — zoned schools average 0% FRL vs 75% district-wide (75 pts lower); this property's tenant base skews higher-income than the district average.
- Market conditions: 28 active listings in the ZIP.
Forward outlook
- In year one you build about $321 of equity ($684 loan paydown + $-363 appreciation (-0.4% local appreciation)).
- Choctaw County population projected to shrink 5% by 2050 — rents likely to lag national; underwrite the cash flow, not the appreciation.
- At projected returns (-0.4% appreciation + 3.0% rent growth), your $28k cash investment doubles in ~5 years — after that, you're playing with house money.
Negotiation context
- It's been on market 45 days — a 3% lower offer ($96k) is reasonable based on typical stale-listing flexibility.
Risks & watch-outs
- Climate carrying-cost: moderate wildfire risk; extreme-heat days projected 7→21/yr by 2055 (HVAC capex compounding) — expect insurance premiums to compound above CPI over the hold.
Questions for the listing agent
- It's been on market 45 days. Have you received any prior offers? Is the seller open to a 3% concession, seller financing, or rate buy-down credit?
- Is there a deadline driving the sale (1031 exchange, divorce, estate, relocation)? That informs how much negotiation room exists.
- Schools are F-rated, which usually means shorter tenancies and higher turnover. Who's the typical renter profile here, and what's been the actual vacancy rate?
- What's the average days-on-market for RENTAL listings here right now (not sales)? A rising rental-DOM trend means longer vacancies and softer asking-rent achievability than the comps imply.
- What's the recent tenant-quality profile in this submarket — average credit score on applications, eviction rate, late-payment / NSF rate, and stable-employment percentage? A property-management company in the area should have these aggregated.
- How much new for-sale + rental construction is in the pipeline within 1–3 miles? Heavy new supply typically softens prices + rents 12–24 months out; constrained supply supports both.
Investment metrics
- 1% rule
- 1.29% ✓
- Cap rate
- 11.12%
- Cash-on-cash
- 17.25%
- DSCR
- 1.77
- GRM
- 6.4
CMA / ARV
- ARV (on-the-fly)
- $623,070
- Comps found
- 2
Show comp detail 2 sales within ~0.75 mi
| Address | Dist | Beds/Ba | Sqft | Sold | Price | $/sf | Match |
|---|---|---|---|---|---|---|---|
| 845 Tram Rd | 0.53mi | 3/2.0 | 1,988 (-4%) | 20mo | $599,000 | $301 | 48 |
| 984 Ridgepoint | 0.55mi | 4/2.5 (+1) | 2,351 (+14%) | 6mo | $249,900 | $106 | 35 |
Match score weights: distance 35% · size 25% · config 20% · recency 20%. Top-matched comps best support the ARV.
Projected returns pro-forma
-0.37% appreciation · 3.0% rent growth · sell at horizon
- IRR
- 15.9%
- Equity multiple
- 1.75×
- Total profit
- $20,762
- Equity at exit
- $26,947
- IRR
- 20.8%
- Equity multiple
- 3.23×
- Total profit
- $61,762
- Equity at exit
- $30,989
Cash invested: $27,720 (down + closing). Projections, not guarantees.
Landlord ↔ Tenant lean methodology
- Overall (STATE)
- 83 Strongly Landlord-Friendly
- State Oklahoma
- 83 Strongly Landlord-Friendly · R+20
- County
- — inherits STATE
- City
- — inherits STATE
ZIP-level market 74735
- Home prices YoY
- -0.1%
- Active inventory
- 28
- Price-to-rent
- 6.4×
Monthly cashflow live
- Estimated rent
- $1,281 medium interval (Pro) →
- Mortgage (P&I)
- −$519
- Tax from tax record
- −$53 /mo · $639/yr
- Insurance
- −$41
- HOA
- −$0
- Vacancy / Maint / Mgmt
- −$269
- Net cashflow
- $398
Break-even live
UW: 25.0% down · 7.5% · 30yr · 1.5% tax · 5.0% vac · 8.0% maint · 8.0% mgmt
Financing live
Cash to close
- Down payment
- $24,750
- Closing costs
- $2,970
- Reserves months
- —
- Total cash needed
- —
Loan-product check · same deal, 3 products live
Conventional
25% down · 7.5% · 30yr
- Down + closing
- —
- Monthly P&I
- —
- Monthly cashflow
- —
- DSCR
- —
- Eligible?
- —
Personal DTI + credit; lowest rate.
DSCR
20% down · 8.5% · 30yr
- Down + closing
- —
- Monthly P&I
- —
- Monthly cashflow
- —
- DSCR
- —
- Eligible?
- —
No personal income docs; deal must DSCR.
Hard money
10% down · 12.0% · 12mo
- Down + closing
- —
- Monthly P&I
- —
- Monthly cashflow
- —
- DSCR
- —
- Eligible?
- —
Short-term bridge; refi at stabilization.
Listing history 15 events
-
2026-06-18days on market $99,000 Active 45 DOM
-
2026-06-17days on market $99,000 Active 44 DOM
-
2026-06-16days on market $99,000 Active 43 DOM
-
2026-06-15days on market $99,000 Active 42 DOM
-
2026-06-13days on market $99,000 Active 40 DOM
-
2026-06-12days on market $99,000 Active 39 DOM
-
2026-06-09days on market $99,000 Active 36 DOM
-
2026-06-08days on market $99,000 Active 35 DOM
-
2026-06-08days on market $99,000 Active 34 DOM
-
2026-06-07days on market $99,000 Active 33 DOM
-
2026-06-04days on market $99,000 Active 30 DOM
-
2026-06-02days on market $99,000 Active 29 DOM
-
2026-06-01days on market $99,000 Active 28 DOM
-
2026-05-31days on market $99,000 Active 27 DOM
-
2026-05-04$99,000 Active
ⓘ Source: listings_history table (triggers on properties + properties_extension) + one-shot
backfill from property_details.listing_events for pre-trigger history.
Tax reassessment forecast OK · Resets to sale price
- Current annual tax
- $639 · $53/mo
- Projected year-2 tax
- $891 · $74/mo
- Expected delta
- +$252/yr (+$21/mo · 39.4%)
ⓘ Screening estimate from a state-policy table — verify with the county assessor before closing.
Climate risk First Street
- Flood 1/10 Low 0% chance over 30 yrs
- Wildfire 5/10 Major
- Heat 6/10 Major 7 d/yr ≥111°F today · 21 d/yr by 30 yrs out
- Wind 4/10 Moderate 11% chance of damaging wind over 30 yrs
- Air quality 2/10 Low 0 unhealthy d/yr today · 1 by 30 yrs out
Nearby sold comps map
Loading sold comps map…
Walkable amenities ~0.75 mi
Loading nearby amenities…
Taxation est. · year 1
- Rental income
- $15,373
- − Mortgage interest
- −$5,546
- − Property taxes
- −$639
- − Insurance
- −$495
- − Repairs & maintenance
- −$1,230
- − Management
- −$1,230
- − Depreciation
- −$2,880
- Taxable income
- $3,354
- Est. tax owed @ 24.0%
- −$805
- After-tax cash flow
- $3,976/yr
For passive investors: Depreciation is non-cash, so a rental often shows a tax loss while cash-flowing — sheltering income. Rental losses are passive: they offset passive income freely, and up to $25,000/yr can offset ordinary (W-2) income if you actively participate and your MAGI is under $100k (phasing out to $0 by $150k); unused losses carry forward. On sale, claimed depreciation is recaptured at up to 25%, and gains may owe capital-gains tax (a 1031 exchange can defer both). Figures are a year-1 estimate at your 24.0% rate — not tax advice; consult a CPA.
Schools (NCES district)
- District
- Fort Towson
- NCES district ID
- 4012300
- Math proficiency
- 10% ▬ 0.00%
- Reading proficiency
- 20% ▬ 0.00%
- Median HH income
- $34,759
- Composite
- 15.74/100
- National rank
- #14326
- State rank
- #477 of 513 in OK
Livability — Fort Towson
- Score
- 62/100
- State rank
- #250
- US rank
- #16654
Category grades
Schools grade is shown separately in the Schools card above.
Census & demographics
- Census place
- Fort Towson, OK
- Population (ZIP)
- 2,075
Population outlook (Choctaw County) Hauer SSP2
- Today (2025)
- 14,744 people
- By 2030
- 14,568 · -1.2%
- By 2040
- 14,225 · -3.5%
- By 2050
- 13,960 · -5.3%
- By 2075
- 13,775 · -6.6%
- By 2100
- 13,408 · -9.1%
Race, ethnicity, and origin ACS 2023
- Neighborhood character
- Predominantly White (69%)
- Race & ethnicity
- White 69% Native American 16% Two or more races 11% Black 3% Hispanic / Latino 1%
- Common ancestry
- Slovak 3% Serbian 2% Iranian 1%
- Foreign-born
- 1%
- Languages at home
- 96% English-only · Other Asian/Pacific 1%
Political lean MEDSL · Choctaw
- 2024 margin
- Solid R (+65.4) · D 16.7% · R 82.2% · Other 1.1%
- 2008→2024 swing
- -32.0pp toward R · 2008: -33.5pp · 2024: -65.4pp
- All cycles
- 2024: R+65.4 2020: R+62.0 2016: R+57.9 2012: R+41.0 2008: R+33.5
Not yet ingested
- Civics
- —
Market trends
- HPI YoY
- ▼ -0.37%
- Current HPI
- 344.316
- Rent YoY
- —
- Metro
- —
- State GDP YoY
- ▲ 1.55%
- F500 in state
- 6
Industry mix (Fortune 500 HQ in OK)
| Industry | F500 HQs | Revenue |
|---|---|---|
| Energy | 3 | $48B |
|
||
Price history
1 event — show timeline
- 2026-05-04 Listed $99,000 MLSOK
Property tax history
+21.5%/yrLatest (2025): $639 · +1.8% YoY. Source: county tax records.
Cash-flow waterfall
monthlySold comps — $/sqft
last 12 mo · ≤1 miLoading sold comps…