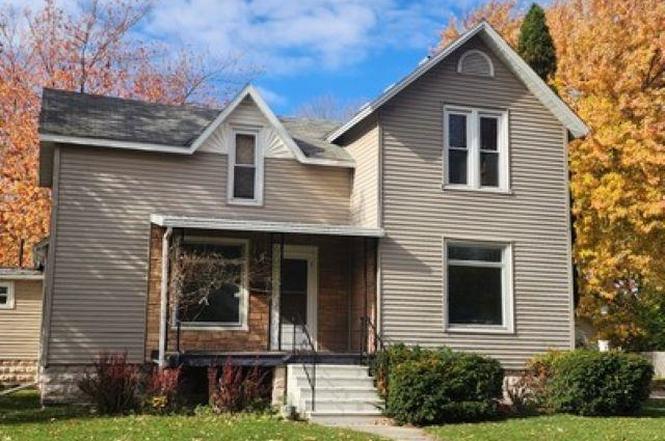
600 Wilson St · Bay City, MI
Flood risk 1/10 · Minimal
- FEMA flood zone
- X (unshaded)
- Chance of flooding over 30 yrs
- 0.0%
- Est. flood insurance / yr
- $473 – $860
Fire risk 1/10 · Minimal
- Est. fire insurance / yr
- $784 – $1,456
Heat risk 3/10 · Minor
- Hot days now (above 97°F)
- 7 days/yr
- Hot days in 30 yrs
- 14 days/yr
Wind risk 1/10 · Minimal
- Chance of severe wind over 30 yrs
- —
Air-quality risk 2/10 · Minimal
- Unhealthy air days now
- 1 days/yr
- Unhealthy air days in 30 yrs
- 2 days/yr
Risk factors via First Street. Map © Google.
Why this score? — see what drove the B- grade
The composite is a weighted blend of 9 inputs, each scored 0–100. Each bar is that input's sub-score; the figure is the points it added to the 100-point composite (weight × sub-score).
- Cash flow +30.0/30.0
- 1% rule +10.0/10.0
- DSCR +10.0/10.0
- ARV discount +7.5/15.0
- Livability +3.4/5.0
- Schools +2.8/10.0
- Rent growth +2.5/5.0
- Condition / age +2.5/5.0
- Appreciation +0.0/10.0
$47,500
🖨 Deal sheet 📄 Offer letter ✓ Due diligence
Listing remarks
3 bedroom 1 bath home offers room to grow. Make it your own! Deck for summer relaxation. Det garage for storage. Full basement. Vinyl siding. Needs some plumbing. prime candidate for a rehab to make it your own. NO UTILITIES ARE ON. Currently at auction, go to HUBZU.com for details.
Key facts
- 7,405 sq ft lot
- Garage
- Built 1880
Property features AI
Exterior
- Parking: Detached garage with 1 parking space
- Utilities: Public water; Public sanitary sewer; Natural gas
- Home design: Residential property; 1½-story structure; Built in 1880; Facing information not provided
- Construction: Vinyl siding exterior; Basement foundation; Originally built in 1880
- Exterior features: Vinyl siding; Road frontage
Interior
- Kitchen: Kitchen on first level — 11 x 10, linoleum flooring; Dining room on first level with laminate flooring
- Bedrooms: Bedroom 1 (first level) — 11 x 12, carpet; Bedroom 2 (second level) — 10 x 11; Bedroom 3 (first level) — approx. width 11, carpet
- Flooring: Carpet in living room and bedrooms; Laminate in dining room; Linoleum in kitchen
- Bathrooms: 1 full bathroom (first level)
- Heating & cooling: Natural gas heat; Forced air heating
- Interior features: 7 total rooms; Full basement
- Laundry & utility: Basement utility access
Neighborhood map
What this means for you Summary
Snapshot
- This is a 3-bed/1.0-bath single-family listed at $48k.
Deal economics
- At list price, monthly cash flow is $606 ($7k/yr) — positive.
- The deal already cash-flows at list — no discount required.
- Meets the 1% rule at list price ($1k rent vs $48k).
- Recommended offer: $42k (12.0% below list) — sets the bar for market timing.
- Cap rate 21.6% vs local median 5.5% in Bay City — top-decile yield for the area; either an underpriced asset or a hidden risk that comps aren't pricing in. Stress-test before assuming the spread holds.
Location & tenants
- Location reads 68/100 on livability (#360 in MI) — a middle-class / working-renter tenant base. Strengths: cost of living A+, housing A+, health & safety A+; Watch: schools D+, amenities D, crime F.
- Bay City School District (urban): math 27% / reading 40% proficiency, ranked #317 of 540 in MI (top 59%) — families likely to look elsewhere, expect single-tenant / working-renter base with shorter leases.
- Market conditions: 148 active listings in the ZIP; 1 comparable units currently listed for rent nearby; 39 units permitted in Bay County in 2024 (0 in 5+ unit buildings).
Forward outlook
- Local home prices are declining (-3.0%/yr); year-one equity from $328 of loan paydown is wiped out by about $1k of value loss. Plan a longer hold.
- Bay County population projected at -21% by 2050 — secular population decline; favor cash flow + early exit over multi-decade hold.
- At projected returns (-3.0% appreciation + 3.0% rent growth), your $13k cash investment doubles in ~3 years — after that, you're playing with house money.
Negotiation context
- It's been on market 168 days — a 12% lower offer ($42k) is reasonable based on typical stale-listing flexibility.
- 2 sale attempts; this cycle's ask has dropped $10k (17%) from the opening price — seller is motivated, your offer sets the floor, not the list.
Risks & watch-outs
- Watch-outs: property tax is 2.7% of price; built in 1880 — expect roof / HVAC / electrical / plumbing capex.
Questions for the listing agent
- It's been on market 168 days. Have you received any prior offers? Is the seller open to a 12% concession, seller financing, or rate buy-down credit?
- Built in 1880 — when were the roof, HVAC, electrical panel, plumbing, and water heater last replaced?
- Property tax is high relative to price — has the assessment been appealed recently, and will the sale trigger a re-assessment?
- Why hasn't it sold? Are there any deal-killer items the seller is aware of (foundation, flood, title, zoning, code violations)?
- Is there a deadline driving the sale (1031 exchange, divorce, estate, relocation)? That informs how much negotiation room exists.
- Schools are D-rated, which usually means shorter tenancies and higher turnover. Who's the typical renter profile here, and what's been the actual vacancy rate?
- Crime grade is F in this area — have there been break-ins, vandalism, or insurance claims at this property in the last 3 years? What carrier currently insures it and at what premium?
- What's the average days-on-market for RENTAL listings here right now (not sales)? A rising rental-DOM trend means longer vacancies and softer asking-rent achievability than the comps imply.
- What's the recent tenant-quality profile in this submarket — average credit score on applications, eviction rate, late-payment / NSF rate, and stable-employment percentage? A property-management company in the area should have these aggregated.
- How much new for-sale + rental construction is in the pipeline within 1–3 miles? Heavy new supply typically softens prices + rents 12–24 months out; constrained supply supports both.
Investment metrics
- 1% rule
- 2.62% ✓
- Cap rate
- 21.61%
- Cash-on-cash
- 54.71%
- DSCR
- 3.43
- GRM
- 3.2
CMA / ARV
- ARV (on-the-fly)
- $109,359
- Comps found
- 12
Show comp detail 12 sales within ~0.75 mi
| Address | Dist | Beds/Ba | Sqft | Sold | Price | $/sf | Match |
|---|---|---|---|---|---|---|---|
| 606 Wilson St | 0.03mi | 3/1.0 | 1,128 (-10%) | 6mo | $130,000 | $115 | 77 |
| 609 McCormick St | 0.17mi | 3/1.0 | 1,156 (-8%) | 3mo | $75,000 | $65 | 76 |
| 115 Webster St | 0.13mi | 2/1.5 (-1) | 1,146 (-9%) | 2mo | $90,000 | $79 | 71 |
| 907 Michigan Ave | 0.56mi | 2/1.5 (-1) | 1,252 (-0%) | 3mo | $150,000 | $120 | 63 |
| 1423 Stanton St | 0.74mi | 3/1.0 | 1,310 (+4%) | 2mo | $113,650 | $87 | 57 |
| 1301 Marsac St | 0.47mi | 3/1.5 | 1,128 (-10%) | 5mo | $75,000 | $66 | 55 |
| 1500 Wilson St | 0.61mi | 4/2.0 (+1) | 1,160 (-8%) | 0mo | $175,000 | $151 | 49 |
| 808 19th St | 0.60mi | 3/1.0 | 1,439 (+14%) | 2mo | $95,700 | $67 | 46 |
| 1707 S Monroe St | 0.65mi | 4/1.0 (+1) | 1,390 (+11%) | 2mo | $151,000 | $109 | 46 |
| 732 S Madison Ave | 0.62mi | 3/1.0 | 1,068 (-15%) | 3mo | $117,100 | $110 | 44 |
| 901 S Monroe St | 0.66mi | 4/1.0 (+1) | 1,104 (-12%) | 4mo | $41,500 | $38 | 41 |
| 1609 S VanBuren St | 0.72mi | 3/1.5 | 1,104 (-12%) | 5mo | $50,000 | $45 | 39 |
Match score weights: distance 35% · size 25% · config 20% · recency 20%. Top-matched comps best support the ARV.
Projected returns pro-forma
-3.0% appreciation · 3.0% rent growth · sell at horizon
- IRR
- 53.0%
- Equity multiple
- 3.33×
- Total profit
- $30,969
- Equity at exit
- $7,082
- IRR
- 58.2%
- Equity multiple
- 6.78×
- Total profit
- $76,887
- Equity at exit
- $4,107
Cash invested: $13,300 (down + closing). Projections, not guarantees.
Landlord ↔ Tenant lean methodology
- Overall (STATE)
- 62 Landlord-Friendly
- State Michigan
- 62 Landlord-Friendly · EVEN
- County
- — inherits STATE
- City
- — inherits STATE
ZIP-level market 48708
- Home prices YoY
- -30.9%
- Active inventory
- 148
- Price-to-rent
- 3.2×
Monthly cashflow live
- Estimated rent
- $1,243 medium interval (Pro) →
- Mortgage (P&I)
- −$249
- Tax from tax record
- −$106 /mo · $1,277/yr
- Insurance
- −$20
- HOA
- −$0
- Vacancy / Maint / Mgmt
- −$261
- Net cashflow
- $606
Break-even live
UW: 25.0% down · 7.5% · 30yr · 1.5% tax · 5.0% vac · 8.0% maint · 8.0% mgmt
Financing live
Cash to close
- Down payment
- $11,875
- Closing costs
- $1,425
- Reserves months
- —
- Total cash needed
- —
Loan-product check · same deal, 3 products live
Conventional
25% down · 7.5% · 30yr
- Down + closing
- —
- Monthly P&I
- —
- Monthly cashflow
- —
- DSCR
- —
- Eligible?
- —
Personal DTI + credit; lowest rate.
DSCR
20% down · 8.5% · 30yr
- Down + closing
- —
- Monthly P&I
- —
- Monthly cashflow
- —
- DSCR
- —
- Eligible?
- —
No personal income docs; deal must DSCR.
Hard money
10% down · 12.0% · 12mo
- Down + closing
- —
- Monthly P&I
- —
- Monthly cashflow
- —
- DSCR
- —
- Eligible?
- —
Short-term bridge; refi at stabilization.
Rent comps 1 comps
| Address | Beds | Baths | Sqft | Rent | $/sqft | DOM | Units | Dist |
|---|---|---|---|---|---|---|---|---|
| 600 18th St Bay City, MI | 2.0 | 1.0 | 1000 | $950 | $0.95 | 43d | 1 | 0.58mi |
Listing history 22 events
-
2026-06-19days on market $47,500 Active 168 DOM
-
2026-06-18days on market $47,500 Active 167 DOM
-
2026-06-17days on market $47,500 Active 166 DOM
-
2026-06-16days on market $47,500 Active 165 DOM
-
2026-06-15days on market $47,500 Active 164 DOM
-
2026-06-14days on market $47,500 Active 162 DOM
-
2026-06-12days on market $47,500 Active 161 DOM
-
2026-06-09days on market $47,500 Active 158 DOM
-
2026-06-08days on market $47,500 Active 157 DOM
-
2026-06-07days on market $47,500 Active 156 DOM
-
2026-06-05days on market $47,500 Active 153 DOM
-
2026-06-03days on market $47,500 Active 152 DOM
-
2026-06-02days on market $47,500 Active 151 DOM
-
2026-06-01days on market $47,500 Active 150 DOM
-
2026-05-31days on market $47,500 Active 149 DOM
-
2026-05-30days on market $47,500 Active 148 DOM
-
2026-05-22status Active
-
2026-04-20status Pending
-
2026-04-01historical
-
2026-02-14price $47,500
-
2025-12-18price $52,500
-
2025-11-12$57,200 Active
ⓘ Source: listings_history table (triggers on properties + properties_extension) + one-shot
backfill from property_details.listing_events for pre-trigger history.
Tax reassessment forecast MI · Partial reset (capped growth)
- Current annual tax
- $1,277 · $106/mo
- Projected year-2 tax
- $1,277 · $106/mo
- Expected delta
- $0/yr ($0/mo · 0.0%)
ⓘ Screening estimate from a state-policy table — verify with the county assessor before closing.
Climate risk First Street
- Flood 1/10 Low FEMA zone X (unshaded) · 0% chance over 30 yrs
- Wildfire 1/10 Low
- Heat 3/10 Moderate 7 d/yr ≥97°F today · 14 d/yr by 30 yrs out
- Wind 1/10 Low
- Air quality 2/10 Low 1 unhealthy d/yr today · 2 by 30 yrs out
Nearby sold comps map
Loading sold comps map…
Walkable amenities ~0.75 mi
Loading nearby amenities…
Taxation est. · year 1
- Rental income
- $14,910
- − Mortgage interest
- −$2,661
- − Property taxes
- −$1,277
- − Insurance
- −$238
- − Repairs & maintenance
- −$1,193
- − Management
- −$1,193
- − Depreciation
- −$1,382
- Taxable income
- $6,968
- Est. tax owed @ 24.0%
- −$1,672
- After-tax cash flow
- $5,604/yr
For passive investors: Depreciation is non-cash, so a rental often shows a tax loss while cash-flowing — sheltering income. Rental losses are passive: they offset passive income freely, and up to $25,000/yr can offset ordinary (W-2) income if you actively participate and your MAGI is under $100k (phasing out to $0 by $150k); unused losses carry forward. On sale, claimed depreciation is recaptured at up to 25%, and gains may owe capital-gains tax (a 1031 exchange can defer both). Figures are a year-1 estimate at your 24.0% rate — not tax advice; consult a CPA.
Schools (NCES district)
- District
- Bay City School District
- NCES district ID
- 2604260
- Math proficiency
- 27% ▼ -8.00%
- Reading proficiency
- 40% ▼ -4.00%
- Median HH income
- $43,833
- Composite
- 28.47/100
- National rank
- #6743
- State rank
- #317 of 540 in MI
Livability — Bay City
- Score
- 68/100
- State rank
- #360
- US rank
- #8912
Category grades
Schools grade is shown separately in the Schools card above.
Census & demographics
- Census place
- Bay City, MI
- County
- Bay County · 36,975 people
- City population
- 25,635
- Metro
- Bay City, MI
- Population (ZIP)
- 25,635
- Household income
- $50,518
- Rent vs Own
- Severe rent burden
- 528.0
Population outlook (Bay County) Hauer SSP2
- Today (2025)
- 101,476 people
- By 2030
- 98,152 · -3.3%
- By 2040
- 89,711 · -11.6%
- By 2050
- 80,614 · -20.6%
- By 2075
- 60,544 · -40.3%
- By 2100
- 41,603 · -59.0%
Race, ethnicity, and origin ACS 2023
- Neighborhood character
- Predominantly White (81%)
- Race & ethnicity
- White 81% Hispanic / Latino 11% Two or more races 10% Black 3%
- Hispanic origin (detail)
- Mexican 9%
- Common ancestry
- Romanian 17% Lithuanian 7% Slovak 2%
- Foreign-born
- 2% · Canada, South Korea
- Languages at home
- 96% English-only · Spanish 2% German/W. Germanic 1%
Political lean MEDSL · Bay
- 2024 margin
- R (+14.7) · D 42.0% · R 56.7% · Other 1.3%
- 2008→2024 swing
- -30.0pp toward R · 2008: 15.3pp · 2024: -14.7pp
- All cycles
- 2024: R+14.7 2020: R+11.6 2016: R+12.6 2012: D+6.0 2008: D+15.3
Not yet ingested
- Civics
- —
Market trends
- HPI YoY
- ▼ -82.21%
- Current HPI
- 183.5774
- Rent YoY
- —
- Metro
- Bay City, MI
- State GDP YoY
- ▲ 1.37%
- F500 in state
- 28
Industry mix (Fortune 500 HQ in MI)
| Industry | F500 HQs | Revenue |
|---|---|---|
| Automotive Parts | 3 | $48B |
|
||
| Automotive | 2 | $372B |
|
||
| Chemicals | 1 | $45B |
|
||
| Automotive Retail | 1 | $29B |
|
||
| Healthcare / Medical Devices | 1 | $23B |
|
||
| Automotive Technology | 1 | $20B |
|
||
Price history
-17.0% since first listed6 events — show timeline
- 2026-05-22 Relisted — MiRealSource-MiMLS
- 2026-04-20 Pending — MiRealSource-MiMLS
- 2026-04-01 Listing Removed — MiRealSource-MiMLS
- 2026-02-14 Price Changed $47,500 MiRealSource-MiMLS
- 2025-12-18 Price Changed $52,500 MiRealSource-MiMLS
- 2025-11-12 Listed $57,200 MiRealSource-MiMLS
Property tax history
+2.6%/yrLatest (2025): $1,277 · +24.5% YoY. Source: county tax records.
Cash-flow waterfall
monthlySold comps — $/sqft
last 12 mo · ≤1 miLoading sold comps…