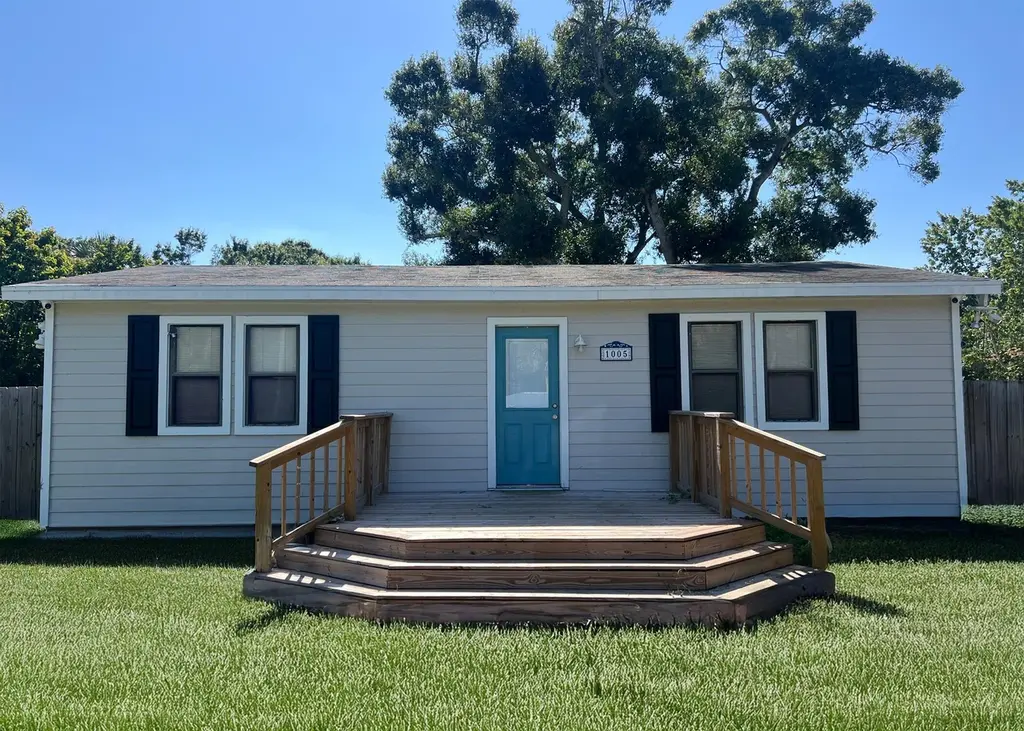
1005 20th Ave · Vero Beach South, FL
Flood risk 1/10 · Minimal
- FEMA flood zone
- X (unshaded)
- Chance of flooding over 30 yrs
- 0.0%
- Est. flood insurance / yr
- $507 – $1,088
Fire risk 1/10 · Minimal
- Est. fire insurance / yr
- $947 – $1,759
Heat risk 10/10 · Severe
- Hot days now (above 105°F)
- 7 days/yr
- Hot days in 30 yrs
- 24 days/yr
Wind risk 10/10 · Severe
- Chance of severe wind over 30 yrs
- 99.0%
Air-quality risk 1/10 · Minimal
- Unhealthy air days now
- 0 days/yr
- Unhealthy air days in 30 yrs
- 0 days/yr
Risk factors via First Street. Map © Google.
Why this score? — see what drove the D+ grade
The composite is a weighted blend of 9 inputs, each scored 0–100. Each bar is that input's sub-score; the figure is the points it added to the 100-point composite (weight × sub-score).
- Cash flow +14.6/30.0
- ARV discount +13.6/15.0
- DSCR +4.5/10.0
- Schools +4.2/10.0
- Livability +3.9/5.0
- 1% rule +3.6/10.0
- Condition / age +2.5/5.0
- Rent growth +2.1/5.0
- Appreciation +0.0/10.0
$219,000
🖨 Deal sheet (PDF) 📄 Offer letter ✓ Due diligence
Listing remarks MLS
Welcome home to a worry, free home that features a large fenced in backyard perfect for any outdoor enthusiast home has been completely remodeled all the big ticket items have been done Best house in Vero Beach for the money
Key facts
- Completely remodeled
- Fenced in backyard
- 0.36 acre lot
Tags
Property features AI
Finance
- Other: Pets allowed (cats and dogs OK)
Exterior
- Parking: No carport
- Utilities: Public water; Septic tank sewer; Electricity available
- Home design: Single family residence; One-story home; Resale property; Faces east
- Construction: Built with other construction materials; Composition/shingle roof
- Exterior features: Not waterfront
Interior
- Kitchen: Includes dishwasher, electric range, microwave, and refrigerator
- Bedrooms: 2 bedrooms on the main level
- Flooring: Wood flooring
- Bathrooms: 1 full bathroom (main level)
- Heating & cooling: Central electric heating; Central air conditioning; Ceiling fans
- Interior features: Dishwasher; Electric range; Microwave; Refrigerator; Wood flooring
Neighborhood map
What this means for you Summary
Snapshot
- This is a 2-bed/1.0-bath single-family listed at $219k.
Deal economics
- At list price, monthly cash flow is $53 ($634/yr) — positive.
- The deal already cash-flows at list — no discount required.
- To meet the 1% rule (rent ≥ 1% of price), the offer needs to be $188k (14.2% below list).
- Recommended offer: $188k (14.2% below list) — sets the bar for 1% rule.
- Cap rate 6.6% vs local median 4.3% in Vero Beach South — top-decile yield for the area; either an underpriced asset or a hidden risk that comps aren't pricing in. Stress-test before assuming the spread holds.
Location & tenants
- Location reads 78/100 on livability (#163 in FL, #2,445 nationally) — a middle-class / working-renter tenant base. Strengths: commute A+, housing A+, health & safety A; Watch: amenities F.
- Indian River (other): math 48% / reading 52% proficiency, ranked #35 of 73 in FL (top 48%) — acceptable for families but not a draw, mixed tenant base, ~2y average lease.
- Zoned schools: Vero Beach Elementary School (math 39% / reading 36%, grade F, #1,596 of 2,144 statewide, top 75%, 599 students, 80% FRL); Gifford Middle School (math 46% / reading 45%, grade D+, #305 of 571 statewide, top 54%, 582 students, 72% FRL); Vero Beach High School (math 28% / reading 43%, grade F, #367 of 667 statewide, top 57%, 2,847 students, 50% FRL).
- Market conditions: Rents soft (-1.7%/yr); 208 active listings in the ZIP; 17 comparable units currently listed for rent nearby; rentals at typical pace (median 23d on market — plan ~3-4 weeks tenant-placement turnaround); 564 units permitted in Indian River County in 2024 (281 in 5+ unit buildings).
- This rent runs 41% of the median local income ($55k/yr) — at the standard rent-burdened threshold; future hikes will face affordability resistance.
Forward outlook
- Local home prices are declining (-3.0%/yr); year-one equity from $2k of loan paydown is wiped out by about $7k of value loss. Plan a longer hold.
- Indian River County population projected at +18% by 2050 — long-run rental-demand tailwind backs the buy-and-hold thesis.
Negotiation context
- Only 10 days on market — expect competitive offers; lowballing is unlikely to land.
- 6 sale attempts with the ask held roughly flat each time — persistent listings suggest the price (not the market) is what's stuck; bring a comps-based counter.
- Current owner paid $140k; list at $219k implies a 56% gain — meaningful room to come down on a strong offer.
Risks & watch-outs
- Watch-outs: built in 1951 — expect roof / HVAC / electrical / plumbing capex.
- Climate carrying-cost: severe wind risk, 99% chance of damaging wind over 30y; extreme-heat days projected 7→24/yr by 2055 (HVAC capex compounding) — expect insurance premiums to compound above CPI over the hold.
Questions for the listing agent
- Built in 1951 — when were the roof, HVAC, electrical panel, plumbing, and water heater last replaced?
- Is there a deadline driving the sale (1031 exchange, divorce, estate, relocation)? That informs how much negotiation room exists.
- The area grade is low — what's the realistic commute time and amenity access for the typical tenant pool here? Any planned neighborhood developments (good or bad) we should know about?
- What's the average days-on-market for RENTAL listings here right now (not sales)? A rising rental-DOM trend means longer vacancies and softer asking-rent achievability than the comps imply.
- What's the recent tenant-quality profile in this submarket — average credit score on applications, eviction rate, late-payment / NSF rate, and stable-employment percentage? A property-management company in the area should have these aggregated.
- How much new for-sale + rental construction is in the pipeline within 1–3 miles? Heavy new supply typically softens prices + rents 12–24 months out; constrained supply supports both.
Investment metrics
- 1% rule
- 0.86% ✗
- Cap rate
- 6.58%
- Cash-on-cash
- 1.03%
- DSCR
- 1.05
- GRM
- 9.7
CMA / ARV
- ARV (on-the-fly)
- $253,656
- Comps found
- 12
Show comp detail 12 sales within ~0.75 mi
| Address | Dist | Beds/Ba | Sqft | Sold | Price | $/sf | Match |
|---|---|---|---|---|---|---|---|
| 1955 10th Pl | 0.07mi | 2/1.0 | 864 (-8%) | 10mo | $215,000 | $249 | 76 |
| 1711 11th Pl | 0.18mi | 2/2.0 | 984 (+5%) | 5mo | $190,000 | $193 | 75 |
| 2630 11th Pl | 0.47mi | 1/1.0 (-1) | 912 (-3%) | 10mo | $130,000 | $143 | 61 |
| 506 20th Ct | 0.60mi | 2/1.5 | 1,009 (+8%) | 1mo | $265,000 | $263 | 56 |
| 925 27th Ave | 0.51mi | 2/1.0 | 1,040 (+11%) | 3mo | $330,000 | $317 | 55 |
| 545 22nd Ct | 0.59mi | 3/1.5 (+1) | 954 (+2%) | 8mo | $265,000 | $278 | 55 |
| 1110 10th Pl | 0.64mi | 2/2.0 | 1,006 (+8%) | 9mo | $294,000 | $292 | 46 |
| 1225 28th Ave | 0.63mi | 2/1.5 | 1,020 (+9%) | 12mo | $240,000 | $235 | 44 |
| 3056 12th St | 0.73mi | 2/2.0 | 1,025 (+10%) | 7mo | $210,000 | $205 | 40 |
| 1545 20th Ave | 0.73mi | 2/2.0 | 840 (-10%) | 10mo | $260,000 | $310 | 36 |
| 536 23rd Ave | 0.62mi | 3/2.0 (+1) | 1,052 (+12%) | 9mo | $285,000 | $271 | 34 |
| 1503 25th Ave | 0.74mi | 2/2.0 | 1,060 (+13%) | 9mo | $320,000 | $302 | 32 |
Match score weights: distance 35% · size 25% · config 20% · recency 20%. Top-matched comps best support the ARV.
Projected returns pro-forma
-3.0% appreciation · 0.0% rent growth · sell at horizon
- IRR
- -17.9%
- Equity multiple
- 0.39×
- Total profit
- $-37,649
- Equity at exit
- $32,654
- IRR
- -16.8%
- Equity multiple
- 0.19×
- Total profit
- $-49,817
- Equity at exit
- $18,935
Cash invested: $61,320 (down + closing). Projections, not guarantees.
Landlord ↔ Tenant lean methodology
- Overall (STATE)
- 87 Strongly Landlord-Friendly
- State Florida
- 87 Strongly Landlord-Friendly · R+3
- County
- — inherits STATE
- City
- — inherits STATE
ZIP-level market 32960
- Home prices YoY
- -25.5%
- Rents YoY
- -1.7%
- Active inventory
- 208
- Price-to-rent
- 9.7×
Monthly cashflow live
- Estimated rent
- $1,879 high interval (Pro) →
- Mortgage (P&I)
- −$1,148
- Tax from tax record
- −$192 /mo · $2,300/yr
- Insurance
- −$91
- HOA
- −$0
- Vacancy / Maint / Mgmt
- −$395
- Net cashflow
- $53
Break-even live
Sensitivity live
| Price | -10% $177 | -5% $115 | +0% $53 | +5% $-9 | +10% $-71 |
|---|---|---|---|---|---|
| Rent | -10% $-96 | -5% $-21 | +0% $53 | +5% $127 | +10% $201 |
| Rate | -1.0pp $163 | -0.5pp $109 | base $53 | +0.5pp $-4 | +1.0pp $-62 |
UW: 25.0% down · 7.5% · 30yr · 1.5% tax · 5.0% vac · 8.0% maint · 8.0% mgmt
Financing live
Cash to close
- Down payment
- $54,750
- Closing costs
- $6,570
- Reserves months
- —
- Total cash needed
- —
Loan-product check · same deal, 3 products live
Conventional
25% down · 7.5% · 30yr
- Down + closing
- —
- Monthly P&I
- —
- Monthly cashflow
- —
- DSCR
- —
- Eligible?
- —
Personal DTI + credit; lowest rate.
DSCR
20% down · 8.5% · 30yr
- Down + closing
- —
- Monthly P&I
- —
- Monthly cashflow
- —
- DSCR
- —
- Eligible?
- —
No personal income docs; deal must DSCR.
Hard money
10% down · 12.0% · 12mo
- Down + closing
- —
- Monthly P&I
- —
- Monthly cashflow
- —
- DSCR
- —
- Eligible?
- —
Short-term bridge; refi at stabilization.
Rent comps 17 comps
| Address | Beds | Baths | Sqft | Rent | $/sqft | DOM | Units | Dist |
|---|---|---|---|---|---|---|---|---|
| 1306 12th St Unit B Vero Beach, FL | 2.0 | 1.0 | 1000 | $1,600 | $1.60 | 23d | 1 | 0.51mi |
| 405 27th Ct Vero Beach, FL | 3.0 | 2.0 | 1100 | $1,850 | $1.68 | 15d | 1 | 0.91mi |
| 974 14th Ln Vero Beach, FL | 1.0–3.0 | 1.0–3.0 | 1828 | $4,049 | $2.21 | 15d | 32 | 1.13mi |
| 1936 18th Ave Unit A Vero Beach, FL | 2.0 | 1.0 | 1100 | $2,000 | $1.82 | 23d | 1 | 1.17mi |
| 1200 6th Dr Vero Beach, FL | 2.0 | 2.0 | 800 | $1,550 | $1.94 | 15d | 1 | 1.19mi |
| 1429 19th Pl #4 Vero Beach, FL | 2.0 | 1.0 | 873 | $1,800 | $2.06 | 23d | 1 | 1.25mi |
| 939 19th St Unit 961 Vero Beach, FL | 2.0 | 2.0 | 1000 | $1,850 | $1.85 | 23d | 1 | 1.39mi |
| 522 7th Pl Unit 522 Vero Beach, FL | 1.0 | 1.0 | 550 | $1,500 | $2.73 | 23d | 1 | 1.41mi |
| 2624 2nd St SW Vero Beach, FL | 2.0 | 1.0 | 748 | $1,750 | $2.34 | 15d | 1 | 1.42mi |
| 1505 40th Ave Vero Beach, FL | 2.0 | 1.0 | 770 | $1,650 | $2.14 | 23d | 2 | 1.43mi |
| 516 13th Pl Vero Beach, FL | 3.0 | 2.0 | 1102 | $1,800 | $1.63 | 23d | 1 | 1.45mi |
| 462 7th Pl Vero Beach, FL | 1.0 | 1.0 | 550 | $1,400 | $2.55 | 23d | 1 | 1.47mi |
| 686 17th St Vero Beach, FL | 2.0 | 1.0 | 950 | $1,700 | $1.79 | 15d | 2 | 1.47mi |
| 528 7th Sq #102 Vero Beach, FL | 2.0 | 2.0 | 1095 | $3,000 | $2.74 | 23d | 1 | 1.48mi |
| 441 7th Pl #441 Vero Beach, FL | 1.0 | 1.0 | 550 | $1,250 | $2.27 | 23d | 1 | 1.49mi |
| 1450 5th Ave Vero Beach, FL | 3.0 | 2.0 | 1124 | $2,400 | $2.14 | 23d | 1 | 1.49mi |
| 248 27th Ave SW Vero Beach, FL | 3.0 | 2.0 | 836 | $1,700 | $2.03 | 23d | 1 | 1.50mi |
Listing history 28 events
-
2026-05-12status Pending 224-char remark
Show marketing remark (224 chars)
Welcome home to a worry, free home that features a large fenced in backyard perfect for any outdoor enthusiast home has been completely remodeled all the big ticket items have been done Best house in Vero Beach for the money
-
2026-05-12status Pending
Show marketing remark (224 chars)
Welcome home to a worry, free home that features a large fenced in backyard perfect for any outdoor enthusiast home has been completely remodeled all the big ticket items have been done Best house in Vero Beach for the money
-
2026-05-02$219,000 Active 224-char remark
Show marketing remark (224 chars)
Welcome home to a worry, free home that features a large fenced in backyard perfect for any outdoor enthusiast home has been completely remodeled all the big ticket items have been done Best house in Vero Beach for the money
-
2026-05-02$219,000 Active
Show marketing remark (224 chars)
Welcome home to a worry, free home that features a large fenced in backyard perfect for any outdoor enthusiast home has been completely remodeled all the big ticket items have been done Best house in Vero Beach for the money
-
2026-01-05historical
-
2026-01-05historical
-
2025-11-24price $209,000
-
2025-11-24price $209,000
-
2025-11-04price $215,000
-
2025-11-03price $215,000
-
2025-10-27price $219,000
-
2025-10-27price $219,000
-
2025-10-23status Active
-
2025-10-20historical Active Under Contract
-
2025-10-16price $229,000
-
2025-10-16price $229,000
-
2025-09-30price $222,500
-
2025-09-30price $222,500
-
2025-09-30status Active
-
2025-08-26historical Active Under Contract
-
2025-08-22price $214,900
-
2025-08-22price $214,900
-
2025-08-19$229,000 Active
-
2025-08-07$229,000 Active
-
2025-08-01historical $229,000
-
2025-07-30soldstatus $140,000
-
2007-03-02soldstatus $80,000
-
1985-09-01soldstatus $40,000
ⓘ Source: listings_history table (triggers on properties + properties_extension) + one-shot
backfill from property_details.listing_events for pre-trigger history.
Tax reassessment forecast FL · Resets to sale price
- Current annual tax
- $2,300 · $192/mo
- Projected year-2 tax
- $2,300 · $192/mo
- Expected delta
- $0/yr ($0/mo · 0.0%)
ⓘ Screening estimate from a state-policy table — verify with the county assessor before closing.
Climate risk First Street
- Flood 1/10 Low FEMA zone X (unshaded) · 0% chance over 30 yrs
- Wildfire 1/10 Low
- Heat 10/10 Extreme 7 d/yr ≥105°F today · 24 d/yr by 30 yrs out
- Wind 10/10 Extreme 99% chance of damaging wind over 30 yrs
- Air quality 1/10 Low 0 unhealthy d/yr today · 0 by 30 yrs out
Nearby sold comps map
Loading sold comps map…
Walkable amenities ~0.75 mi
Loading nearby amenities…
Taxation est. · year 1
- Rental income
- $22,545
- − Mortgage interest
- −$12,267
- − Property taxes
- −$2,300
- − Insurance
- −$1,095
- − Repairs & maintenance
- −$1,804
- − Management
- −$1,804
- − Depreciation
- −$6,371
- Taxable loss
- −$3,095
- Est. tax savings @ 24.0%
- +$743
- After-tax cash flow
- $1,377/yr
For passive investors: Depreciation is non-cash, so a rental often shows a tax loss while cash-flowing — sheltering income. Rental losses are passive: they offset passive income freely, and up to $25,000/yr can offset ordinary (W-2) income if you actively participate and your MAGI is under $100k (phasing out to $0 by $150k); unused losses carry forward. On sale, claimed depreciation is recaptured at up to 25%, and gains may owe capital-gains tax (a 1031 exchange can defer both). Figures are a year-1 estimate at your 24.0% rate — not tax advice; consult a CPA.
Schools (NCES district)
- District
- Indian River
- NCES district ID
- 1200930
- Math proficiency
- 48% ▼ -9.00%
- Reading proficiency
- 52% ▼ -3.00%
- Median HH income
- $46,597
- Composite
- 42.45/100
- National rank
- #3218
- State rank
- #35 of 73 in FL
Livability — Vero Beach South
- Score
- 78/100
- State rank
- #163
- US rank
- #2445
Category grades
Schools grade is shown separately in the Schools card above.
Census & demographics
- Census place
- Vero Beach South, FL
- County
- Indian River County · 143,738 people
- Metro
- Sebastian-Vero Beach, FL
- Population (ZIP)
- 25,259
- Household income
- $54,682
- Rent vs Own
- Severe rent burden
- 1166.0
Population outlook (Indian River County) Hauer SSP2
- Today (2025)
- 165,104 people
- By 2030
- 172,869 · +4.7%
- By 2040
- 185,640 · +12.4%
- By 2050
- 194,465 · +17.8%
- By 2075
- 211,115 · +27.9%
- By 2100
- 211,781 · +28.3%
Race, ethnicity, and origin ACS 2023
- Neighborhood character
- Majority White (65%)
- Race & ethnicity
- White 65% Hispanic / Latino 16% Two or more races 12% Black 10% Asian 4% Native American 1%
- Hispanic origin (detail)
- Mexican 6% Puerto Rican 3% Cuban 2%
- Common ancestry
- Italian 4% Slovak 3% Romanian 3%
- Foreign-born
- 11% · Canada, Jamaica, Vietnam
- Languages at home
- 82% English-only · Spanish 13% French/Haitian/Cajun 2% Other Asian/Pacific 1%
Political lean MEDSL · Indian River
- 2024 margin
- Strong R (+27.4) · D 36.0% · R 63.4%
- 2008→2024 swing
- -12.5pp toward R · 2008: -14.8pp · 2024: -27.4pp
- All cycles
- 2024: R+27.4 2020: R+21.6 2016: R+24.5 2012: R+22.3 2008: R+14.8
Not yet ingested
- Civics
- —
Market trends
- HPI YoY
- ▼ -103.20%
- Current HPI
- 302.0029
- Rent YoY
- ▼ -1.66%
- Metro
- Sebastian-Vero Beach, FL
- State GDP YoY
- ▲ 3.28%
- F500 in state
- 36
Industry mix (Fortune 500 HQ in FL)
| Industry | F500 HQs | Revenue |
|---|---|---|
| Industrial Technology | 2 | $29B |
|
||
| Insurance | 2 | $17B |
|
||
| Retail | 1 | $60B |
|
||
| Technology Distribution | 1 | $58B |
|
||
| Homebuilding | 1 | $35B |
|
||
| Technology Manufacturing | 1 | $35B |
|
||
Price history
+447.5% since first listed28 events — show timeline
- 2026-05-12 Pending — RAIRCMLS
- 2026-05-12 Pending — Beaches MLS
- 2026-05-02 Listed $219,000 Beaches MLS
- 2026-05-02 Listed $219,000 RAIRCMLS
- 2026-01-05 Listing Removed — SCMLS
- 2026-01-05 Listing Removed — Beaches MLS
- 2025-11-24 Price Changed $209,000 Beaches MLS
- 2025-11-24 Price Changed $209,000 SCMLS
- 2025-11-04 Price Changed $215,000 Beaches MLS
- 2025-11-03 Price Changed $215,000 SCMLS
- 2025-10-27 Price Changed $219,000 Beaches MLS
- 2025-10-27 Price Changed $219,000 SCMLS
- 2025-10-23 Relisted — SCMLS
- 2025-10-20 Contingent — SCMLS
- 2025-10-16 Price Changed $229,000 Beaches MLS
- 2025-10-16 Price Changed $229,000 SCMLS
- 2025-09-30 Price Changed $222,500 Beaches MLS
- 2025-09-30 Price Changed $222,500 SCMLS
- 2025-09-30 Relisted — SCMLS
- 2025-08-26 Contingent — SCMLS
- 2025-08-22 Price Changed $214,900 Beaches MLS
- 2025-08-22 Price Changed $214,900 SCMLS
- 2025-08-19 Listed $229,000 Beaches MLS
- 2025-08-07 Listed $229,000 SCMLS
- 2025-08-01 Coming Soon $229,000 SCMLS
- 2025-07-30 Sold (Public Records) $140,000 Public Records
- 2007-03-02 Sold (Public Records) $80,000 Public Records
- 1985-09-01 Sold (Public Records) $40,000 Public Records
Property tax history
+21.7%/yrLatest (2025): $2,300 · +10.4% YoY. Source: county tax records.
Cash-flow waterfall
monthlySold comps — $/sqft
last 12 mo · ≤1 miLoading sold comps…