3120 Live Oak Blvd #76 · Yuba City, CA
Flood risk 1/10 · Minimal
- FEMA flood zone
- —
- Chance of flooding over 30 yrs
- 0.0%
- Est. flood insurance / yr
- —
Fire risk 8/10 · Major
- Est. fire insurance / yr
- $659 – $1,223
Heat risk 7/10 · Major
- Hot days now (above 105°F)
- 7 days/yr
- Hot days in 30 yrs
- 18 days/yr
Wind risk 1/10 · Minimal
- Chance of severe wind over 30 yrs
- —
Air-quality risk 10/10 · Severe
- Unhealthy air days now
- 28 days/yr
- Unhealthy air days in 30 yrs
- 32 days/yr
Risk factors via First Street. Map © Google.
Why this score? — see what drove the C grade
The composite is a weighted blend of 9 inputs, each scored 0–100. Each bar is that input's sub-score; the figure is the points it added to the 100-point composite (weight × sub-score).
- Cash flow +22.6/30.0
- ARV discount +7.5/15.0
- DSCR +7.3/10.0
- 1% rule +5.9/10.0
- Livability +3.8/5.0
- Schools +3.2/10.0
- Rent growth +2.9/5.0
- Condition / age +2.5/5.0
- Appreciation +0.0/10.0
$134,500
🖨 Deal sheet (PDF) 📄 Offer letter ✓ Due diligence
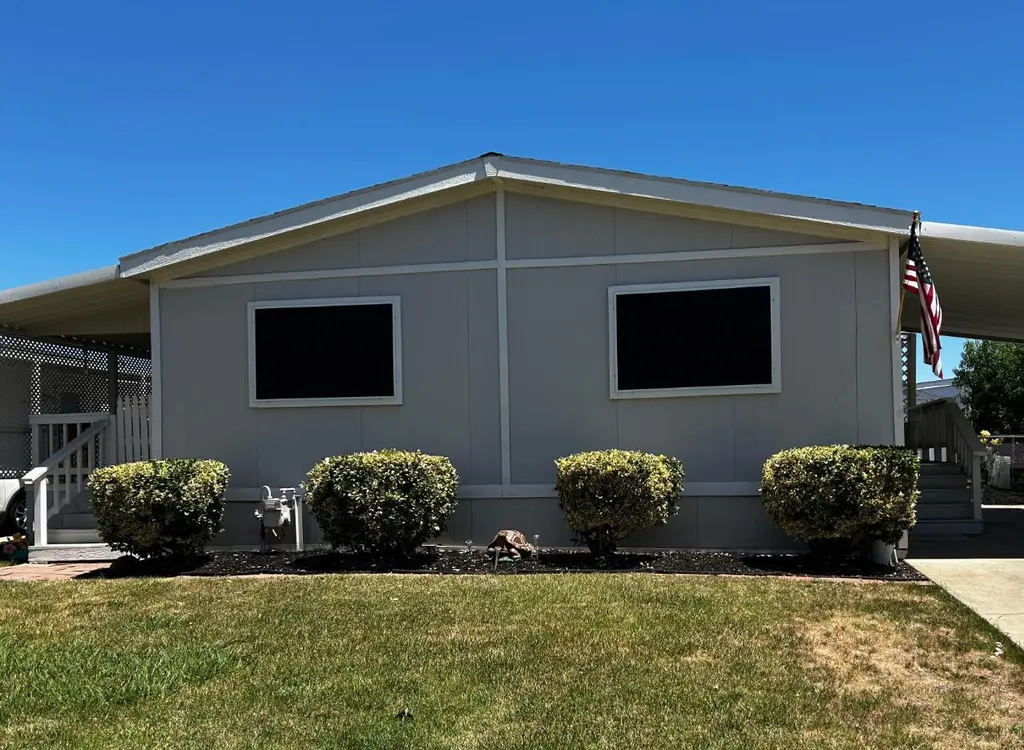
Listing remarks
Welcome home to the immaculately maintained Dell Wayne Mobile Home Estates! This lovely home is available to all ages! It features a front yard, back yard and great covered deck to sit out on during the summer evenings or morning coffee, anytime you like. Many updates have recently been completed so all you have to do is move in. Dual pane windows with sun screens, siding, Tuff Shed, new roof, washer & dryer, refrigerator, stove, beautiful flooring throughout, too much to list. This home is a must see!
Key facts
- Covered deck
- Back yard
- Sun screens
Tags
Property features AI
Finance
- Other: Located in Yuba City, CA (Live Oak Blvd #76); Best to use GPS for directions; Cross street: Pease Rd
- Financial info: Land lease amount listed separately (not land-lease)
- HOA & community: No association; Not a senior community; Not land-lease
Exterior
- Parking: Covered parking (no garage)
- Utilities: Public water; Public sewer; Natural gas connected; Cable connected; 220 volts available in laundry
- Home design: Manufactured home in park; Double wide; Built in 1990
- Construction: Wood skirting; Composition roof; Made by Fleetwood
- Exterior features: Porch awning; Dog run; Backyard and front yard landscaping; Automatic sprinkler system (front and rear); Shed(s)
Interior
- Kitchen: Free-standing gas range; Free-standing refrigerator; Laminate countertops
- Bedrooms: 2 bedrooms
- Flooring: Carpet
- Bathrooms: 1 full bathroom; 1 half bathroom; Tub with shower over
- Heating & cooling: Central heating; Central cooling
- Interior features: Covered and enclosed deck; Deck attached to living area / great room; Dual-pane full windows; Pets allowed
- Laundry & utility: Washer and dryer included (inside laundry); 220V in laundry
Neighborhood map
What this means for you Summary
Snapshot
- This is a 2-bed/1.5-bath manufactured listed at $134k.
Deal economics
- At list price, monthly cash flow is $230 ($3k/yr) — positive.
- The deal already cash-flows at list — no discount required.
- Meets the 1% rule at list price ($1k rent vs $134k).
- Cap rate 8.3% vs local median 3.5% in Yuba City — top-decile yield for the area; either an underpriced asset or a hidden risk that comps aren't pricing in. Stress-test before assuming the spread holds.
Location & tenants
- Location reads 75/100 on livability (#111 in CA, #3,863 nationally) — a middle-class / working-renter tenant base. Strengths: commute A+, housing A+, health & safety A+; Watch: crime D+, schools D, cost of living F.
- Yuba City Unified (urban): math 20% / reading 53% proficiency, ranked #263 of 517 in CA (top 51%) — families likely to look elsewhere, expect single-tenant / working-renter base with shorter leases.
- Market conditions: Rents rising (+1.8%/yr); 149 active listings in the ZIP; 17 comparable units currently listed for rent nearby; rentals at typical pace (median 22d on market — plan ~3-4 weeks tenant-placement turnaround); 47% of comp listings sitting > 30 days — soft ceiling on asking rent; 73 units permitted in Sutter County in 2024 (0 in 5+ unit buildings).
Forward outlook
- Local home prices are declining (-3.0%/yr); year-one equity from $930 of loan paydown is wiped out by about $4k of value loss. Plan a longer hold.
- Sutter County population projected to shrink 4% by 2050 — rents likely to lag national; underwrite the cash flow, not the appreciation.
Negotiation context
- Only 10 days on market — expect competitive offers; lowballing is unlikely to land.
Risks & watch-outs
- Climate carrying-cost: severe wildfire risk; extreme-heat days projected 7→18/yr by 2055 (HVAC capex compounding) — expect insurance premiums to compound above CPI over the hold.
Questions for the listing agent
- Is there a deadline driving the sale (1031 exchange, divorce, estate, relocation)? That informs how much negotiation room exists.
- Schools are D-rated, which usually means shorter tenancies and higher turnover. Who's the typical renter profile here, and what's been the actual vacancy rate?
- Crime grade is D in this area — have there been break-ins, vandalism, or insurance claims at this property in the last 3 years? What carrier currently insures it and at what premium?
- What's the average days-on-market for RENTAL listings here right now (not sales)? A rising rental-DOM trend means longer vacancies and softer asking-rent achievability than the comps imply.
- What's the recent tenant-quality profile in this submarket — average credit score on applications, eviction rate, late-payment / NSF rate, and stable-employment percentage? A property-management company in the area should have these aggregated.
- How much new for-sale + rental construction is in the pipeline within 1–3 miles? Heavy new supply typically softens prices + rents 12–24 months out; constrained supply supports both.
Investment metrics
- 1% rule
- 1.09% ✓
- Cap rate
- 8.34%
- Cash-on-cash
- 7.32%
- DSCR
- 1.33
- GRM
- 7.6
CMA / ARV
- ARV (on-the-fly)
- $88,992
- Comps found
- 6
Show comp detail 6 sales within ~0.75 mi
| Address | Dist | Beds/Ba | Sqft | Sold | Price | $/sf | Match |
|---|---|---|---|---|---|---|---|
| 3120 Live Oak Blvd #76 | 0.00mi | 2/1.5 | 864 (0%) | 8mo | $134,000 | $155 | 93 |
| 1155 Pease Rd #526 | 0.10mi | 2/1.0 | 864 (0%) | 8mo | $65,000 | $75 | 87 |
| 3120 Live Oak #51 | 0.06mi | 2/1.0 | 850 (-2%) | 13mo | $91,500 | $108 | 82 |
| 1155 Pease Rd #430 | 0.13mi | 2/1.0 | 837 (-3%) | 12mo | $86,000 | $103 | 76 |
| 1155 Pease Rd #530 | 0.11mi | 2/1.0 | 780 (-10%) | 19mo | $33,000 | $42 | 61 |
| 1155 Pease Rd #29 | 0.18mi | 2/1.0 | 775 (-10%) | 19mo | $60,000 | $77 | 57 |
Match score weights: distance 35% · size 25% · config 20% · recency 20%. Top-matched comps best support the ARV.
Projected returns pro-forma
-3.0% appreciation · 1.79% rent growth · sell at horizon
- IRR
- -6.5%
- Equity multiple
- 0.76×
- Total profit
- $-8,905
- Equity at exit
- $20,054
- IRR
- 1.6%
- Equity multiple
- 1.11×
- Total profit
- $4,108
- Equity at exit
- $11,629
Cash invested: $37,660 (down + closing). Projections, not guarantees.
Landlord ↔ Tenant lean methodology
- Overall (STATE)
- 18 Strongly Tenant-Friendly
- State California
- 18 Strongly Tenant-Friendly · D+13
- County
- — inherits STATE
- City
- — inherits STATE
ZIP-level market 95991
- Rents YoY
- 1.8%
- Active inventory
- 149
- Price-to-rent
- 7.6×
Monthly cashflow live
- Estimated rent
- $1,467 high interval (Pro) →
- Mortgage (P&I)
- −$705
- Tax est. 1.5%
- −$168 /mo · $2,018/yr
- Insurance
- −$56
- HOA
- −$0
- Vacancy / Maint / Mgmt
- −$308
- Net cashflow
- $230
Break-even live
Sensitivity live
| Price | -10% $323 | -5% $276 | +0% $230 | +5% $183 | +10% $137 |
|---|---|---|---|---|---|
| Rent | -10% $114 | -5% $172 | +0% $230 | +5% $288 | +10% $346 |
| Rate | -1.0pp $297 | -0.5pp $264 | base $230 | +0.5pp $195 | +1.0pp $159 |
UW: 25.0% down · 7.5% · 30yr · 1.5% tax · 5.0% vac · 8.0% maint · 8.0% mgmt
Financing live
Cash to close
- Down payment
- $33,625
- Closing costs
- $4,035
- Reserves months
- —
- Total cash needed
- —
Loan-product check · same deal, 3 products live
Conventional
25% down · 7.5% · 30yr
- Down + closing
- —
- Monthly P&I
- —
- Monthly cashflow
- —
- DSCR
- —
- Eligible?
- —
Personal DTI + credit; lowest rate.
DSCR
20% down · 8.5% · 30yr
- Down + closing
- —
- Monthly P&I
- —
- Monthly cashflow
- —
- DSCR
- —
- Eligible?
- —
No personal income docs; deal must DSCR.
Hard money
10% down · 12.0% · 12mo
- Down + closing
- —
- Monthly P&I
- —
- Monthly cashflow
- —
- DSCR
- —
- Eligible?
- —
Short-term bridge; refi at stabilization.
Rent comps 17 comps
| Address | Beds | Baths | Sqft | Rent | $/sqft | DOM | Units | Dist |
|---|---|---|---|---|---|---|---|---|
| 1290 Northgate Dr Unit 28 Yuba City, CA | 2.0 | 1.0 | 872 | $1,450 | $1.66 | 22d | 1 | 0.97mi |
| 1290 Northgate Dr Unit 81 Yuba City, CA | 2.0 | 2.0 | 941 | $1,500 | $1.59 | 45d | 1 | 1.00mi |
| 1290 Northgate Dr Unit 80 Yuba City, CA | 1.0 | 1.0 | 678 | $1,250 | $1.84 | 22d | 1 | 1.00mi |
| 1290 Northgate Dr Unit 14 Yuba City, CA | 1.0 | 1.0 | 680 | $1,200 | $1.76 | 45d | 1 | 1.00mi |
| 1138 Forestwood Dr Yuba City, CA | 2.0 | 2.0 | 964 | $2,025 | $2.10 | 22d | 1 | 1.09mi |
| 1290 Forestwood Dr Unit 13 Yuba City, CA | 1.0 | 1.0 | 655 | $1,240 | $1.89 | 22d | 1 | 1.12mi |
| 1290 Forestwood Dr Yuba City, CA | 1.0 | 1.0 | 655 | $1,240 | $1.89 | 14d | 1 | 1.12mi |
| 1250 Melton Dr Yuba City, CA | 1.0–2.0 | 1.0 | 646 | $1,300 | $2.01 | 14d | 2 | 1.17mi |
| 1199 Casita Dr #1 Yuba City, CA | 2.0 | 1.0 | 896 | $1,500 | $1.67 | 22d | 1 | 1.19mi |
| 1188 Casita Dr Yuba City, CA | 2.0 | 1.0 | 840 | $1,399 | $1.67 | 45d | 1 | 1.22mi |
| 1171 Kenny Dr Yuba City, CA | 2.0 | 1.0 | 900 | $1,500 | $1.67 | 45d | 1 | 1.24mi |
| 1171 Kenny Dr Unit 10 Yuba City, CA | 2.0 | 1.0 | 900 | $1,375 | $1.53 | 45d | 1 | 1.25mi |
| 1211 Kenny Dr Unit 19 Yuba City, CA | 1.0 | 1.0 | 750 | $1,195 | $1.59 | 45d | 1 | 1.25mi |
| 1210 Kenny Dr Unit 95991 Yuba City, CA | 1.0 | 1.0 | 650 | $1,225 | $1.88 | 45d | 1 | 1.28mi |
| 1570 Gray Ave Unit 16 Yuba City, CA | 1.0 | 1.0 | 700 | $1,275 | $1.82 | 22d | 1 | 1.28mi |
| 1170 Kenny Dr Yuba City, CA | 1.0 | 1.0 | 544 | $1,100 | $2.02 | 14d | 2 | 1.29mi |
| 1518 Upland Dr Unit 1518 Yuba City, CA | 2.0 | 1.0 | 1084 | $1,900 | $1.75 | 45d | 1 | 1.35mi |
Listing history 9 events
-
2026-06-21days on market $134,500 Active 10 DOM
-
2026-06-19days on market $134,500 Active 8 DOM
-
2026-06-18days on market $134,500 Active 7 DOM
-
2026-06-17days on market $134,500 Active 6 DOM
-
2026-06-16days on market $134,500 Active 5 DOM
-
2026-06-15days on market $134,500 Active 4 DOM
-
2026-06-14days on market $134,500 Active 2 DOM
-
2026-06-13remarks 509-char remark
-
2026-06-13$134,500 Active 1 DOM
ⓘ Source: listings_history table (triggers on properties + properties_extension) + one-shot
backfill from property_details.listing_events for pre-trigger history.
Climate risk First Street
- Flood 1/10 Low 0% chance over 30 yrs
- Wildfire 8/10 Severe
- Heat 7/10 Severe 7 d/yr ≥105°F today · 18 d/yr by 30 yrs out
- Wind 1/10 Low
- Air quality 10/10 Extreme 28 unhealthy d/yr today · 32 by 30 yrs out
Nearby sold comps map
Loading sold comps map…
Walkable amenities ~0.75 mi
Loading nearby amenities…
Taxation est. · year 1
- Rental income
- $17,609
- − Mortgage interest
- −$7,534
- − Property taxes
- −$2,018
- − Insurance
- −$672
- − Repairs & maintenance
- −$1,409
- − Management
- −$1,409
- − Depreciation
- −$3,913
- Taxable income
- $655
- Est. tax owed @ 24.0%
- −$157
- After-tax cash flow
- $2,600/yr
For passive investors: Depreciation is non-cash, so a rental often shows a tax loss while cash-flowing — sheltering income. Rental losses are passive: they offset passive income freely, and up to $25,000/yr can offset ordinary (W-2) income if you actively participate and your MAGI is under $100k (phasing out to $0 by $150k); unused losses carry forward. On sale, claimed depreciation is recaptured at up to 25%, and gains may owe capital-gains tax (a 1031 exchange can defer both). Figures are a year-1 estimate at your 24.0% rate — not tax advice; consult a CPA.
Schools (NCES district)
- District
- Yuba City Unified
- NCES district ID
- 0643470
- Math proficiency
- 20% ▼ -10.00%
- Reading proficiency
- 53% ▲ 5.00%
- Median HH income
- $50,923
- Composite
- 31.55/100
- National rank
- #5956
- State rank
- #263 of 517 in CA
Livability — Yuba City
- Score
- 75/100
- State rank
- #111
- US rank
- #3863
Category grades
Schools grade is shown separately in the Schools card above.
Census & demographics
- Census place
- Yuba City, CA
- County
- Sutter County · 81,625 people
- City population
- 81,625
- Metro
- Yuba City, CA
- Population (ZIP)
- 42,579
- Household income
- $70,590
- Rent vs Own
- Severe rent burden
- 1674.0
Population outlook (Sutter County) Hauer SSP2
- Today (2025)
- 97,244 people
- By 2030
- 97,170 · -0.1%
- By 2040
- 96,137 · -1.1%
- By 2050
- 93,604 · -3.7%
- By 2075
- 85,008 · -12.6%
- By 2100
- 71,584 · -26.4%
Race, ethnicity, and origin ACS 2023
- Neighborhood character
- Diverse neighborhood (Simpson 0.68)
- Race & ethnicity
- Hispanic / Latino 41% White 37% Two or more races 19% Asian 12% Black 2% Native American 2%
- Hispanic origin (detail)
- Mexican 36% Puerto Rican 2%
- Common ancestry
- Slovak 2% Russian 1% Portuguese 1%
- Foreign-born
- 24% · Canada, Jamaica
- Languages at home
- 60% English-only · Spanish 28% Other Indo-European 10% Other Asian/Pacific 1%
Political lean MEDSL · Sutter
- 2024 margin
- Solid R (+31.4) · D 33.1% · R 64.5% · Other 2.4%
- 2008→2024 swing
- -14.7pp toward R · 2008: -16.7pp · 2024: -31.4pp
- All cycles
- 2024: R+31.4 2020: R+16.4 2016: R+16.3 2012: R+21.8 2008: R+16.7
Not yet ingested
- Civics
- —
Market trends
- HPI YoY
- ▼ -343.11%
- Current HPI
- 240.3835
- Rent YoY
- ▲ 1.79%
- Metro
- Yuba City, CA
- State GDP YoY
- ▲ 3.21%
- F500 in state
- 116
Industry mix (Fortune 500 HQ in CA)
| Industry | F500 HQs | Revenue |
|---|---|---|
| Technology | 27 | $1,492B |
|
||
| Financial Services | 3 | $174B |
|
||
| Retail | 3 | $44B |
|
||
| Insurance | 3 | $26B |
|
||
| Media / Entertainment | 2 | $115B |
|
||
| Pharmaceuticals / Biotech | 2 | $62B |
|
||
Cash-flow waterfall
monthlySold comps — $/sqft
last 12 mo · ≤1 miLoading sold comps…