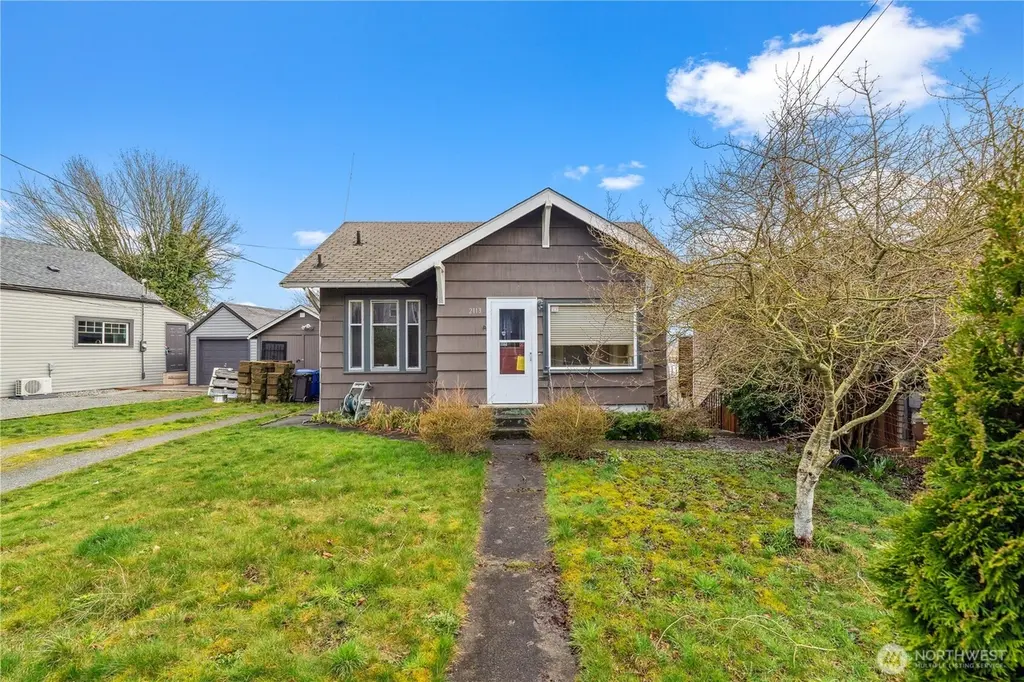
2113 E grand Ave · Everett, WA
Flood risk 1/10 · Minimal
- FEMA flood zone
- X (unshaded)
- Chance of flooding over 30 yrs
- 0.0%
- Est. flood insurance / yr
- $473 – $860
Fire risk 1/10 · Minimal
- Est. fire insurance / yr
- $604 – $1,122
Heat risk 3/10 · Minor
- Hot days now (above 85°F)
- 7 days/yr
- Hot days in 30 yrs
- 16 days/yr
Wind risk 1/10 · Minimal
- Chance of severe wind over 30 yrs
- —
Air-quality risk 6/10 · Moderate
- Unhealthy air days now
- 9 days/yr
- Unhealthy air days in 30 yrs
- 10 days/yr
Risk factors via First Street. Map © Google.
Why this score? — see what drove the D grade
The composite is a weighted blend of 9 inputs, each scored 0–100. Each bar is that input's sub-score; the figure is the points it added to the 100-point composite (weight × sub-score).
- ARV discount +15.0/15.0
- Cash flow +8.1/30.0
- Schools +5.9/10.0
- Livability +3.7/5.0
- Rent growth +3.2/5.0
- Condition / age +2.5/5.0
- DSCR +2.2/10.0
- 1% rule +2.1/10.0
- Appreciation +0.0/10.0
$375,000
🖨 Deal sheet 📄 Offer letter ✓ Due diligence
Listing remarks
River Views & Massive Potential! Wake up to sweeping, unobstructed views of the Snohomish River, the valley, and the majestic Cascade Mountains. This 1,852 sq. ft. home is a designer’s dream canvas, featuring classic architectural details like graceful archways, a spacious 3-bedroom + bonus room layout, and a fully finished basement. Whether you’re looking to restore a classic or create a modern masterpiece, the bones—including skylights and walk-in closets—are ready for a second life. Ideally located near Everett's best parks and schools. Note: Property is currently condemned due to an 8x20 unfinished extension of the house, simple foundation project with bid
Key facts
- Covered front porch
- Enclosed kitchen
- Walkin closets
Tags
Neighborhood map
What this means for you Summary
Snapshot
- This is a 3-bed/2.0-bath single-family listed at $375k.
Deal economics
- At list price, monthly cash flow is $-360 ($-4k/yr) — negative.
- To cash-flow at today's rent, offer at most $311k (17.0% below list).
- To meet the 1% rule (rent ≥ 1% of price), the offer needs to be $265k (29.4% below list).
- Recommended offer: $265k (29.4% below list) — sets the bar for 1% rule.
- Cap rate 5.1% vs local median 2.5% in Everett — top-decile yield for the area; either an underpriced asset or a hidden risk that comps aren't pricing in. Stress-test before assuming the spread holds.
Location & tenants
- Location reads 73/100 on livability (#199 in WA) — a middle-class / working-renter tenant base. Strengths: commute A+, housing A, health & safety A; Watch: schools C-, crime D+, amenities F.
- Everett School District (urban): math 60% / reading 72% proficiency, ranked #26 of 291 in WA (top 9%) — acceptable for families but not a draw, mixed tenant base, ~2y average lease.
- Market conditions: Rents rising (+3.0%/yr); 149 active listings in the ZIP; 16 comparable units currently listed for rent nearby; rentals at typical pace (median 17d on market — plan ~3-4 weeks tenant-placement turnaround); 3,982 units permitted in Snohomish County in 2024 (1,492 in 5+ unit buildings).
- This rent runs 43% of the median local income ($75k/yr) — at the standard rent-burdened threshold; future hikes will face affordability resistance.
Forward outlook
- Local home prices are declining (-3.0%/yr); year-one equity from $3k of loan paydown is wiped out by about $11k of value loss. Plan a longer hold.
- Snohomish County population projected at +30% by 2050 — long-run rental-demand tailwind backs the buy-and-hold thesis.
Negotiation context
- It's been on market 83 days — a 6% lower offer ($352k) is reasonable based on typical stale-listing flexibility.
- 3 sale attempts since 9y ago; this cycle's ask has dropped $25k (6%) from the opening price — seller is motivated, your offer sets the floor, not the list.
- Current owner paid $258k; 46% above their basis — modest negotiation headroom, anchor on the comps not their cost.
Risks & watch-outs
- Watch-outs: built in 1915 — expect roof / HVAC / electrical / plumbing capex.
Questions for the listing agent
- What do current leases actually rent for vs. the listed asking? Can we see a recent rent roll and the last 12 months of T-12 income?
- It's been on market 83 days. Have you received any prior offers? Is the seller open to a 29% concession, seller financing, or rate buy-down credit?
- Built in 1915 — when were the roof, HVAC, electrical panel, plumbing, and water heater last replaced?
- Why hasn't it sold? Are there any deal-killer items the seller is aware of (foundation, flood, title, zoning, code violations)?
- Is there a deadline driving the sale (1031 exchange, divorce, estate, relocation)? That informs how much negotiation room exists.
- Crime grade is D in this area — have there been break-ins, vandalism, or insurance claims at this property in the last 3 years? What carrier currently insures it and at what premium?
- The area grade is low — what's the realistic commute time and amenity access for the typical tenant pool here? Any planned neighborhood developments (good or bad) we should know about?
- What's the average days-on-market for RENTAL listings here right now (not sales)? A rising rental-DOM trend means longer vacancies and softer asking-rent achievability than the comps imply.
- What's the recent tenant-quality profile in this submarket — average credit score on applications, eviction rate, late-payment / NSF rate, and stable-employment percentage? A property-management company in the area should have these aggregated.
- How much new for-sale + rental construction is in the pipeline within 1–3 miles? Heavy new supply typically softens prices + rents 12–24 months out; constrained supply supports both.
Investment metrics
- 1% rule
- 0.71% ✗
- Cap rate
- 5.14%
- Cash-on-cash
- -4.11%
- DSCR
- 0.82
- GRM
- 11.8
CMA / ARV
- ARV (median comp)
- $584,028
- List price
- $375,000
- Delta
- -35.79%
- Verdict
- UNDERPRICED
- Comps
- 20 within 1.0 mi
Show comp detail 12 sales within ~0.75 mi
| Address | Dist | Beds/Ba | Sqft | Sold | Price | $/sf | Match |
|---|---|---|---|---|---|---|---|
| 3715 22nd St | 0.06mi | 4/2.0 (+1) | 1,680 (+2%) | 13mo | $604,000 | $360 | 78 |
| 3510 19th St | 0.25mi | 3/2.0 | 1,554 (-6%) | 3mo | $700,000 | $450 | 77 |
| 2018 Highland Ave | 0.27mi | 3/1.0 | 1,718 (+4%) | 14mo | $615,000 | $358 | 64 |
| 2001 State St | 0.31mi | 3/1.0 | 1,468 (-11%) | 2mo | $570,000 | $388 | 62 |
| 2123 Harrison Ave | 0.11mi | 4/3.0 (+1) | 1,493 (-9%) | 14mo | $632,000 | $423 | 59 |
| 2521 Chestnut St | 0.53mi | 3/2.0 | 1,541 (-6%) | 8mo | $585,000 | $380 | 58 |
| 2231 Highland Ave | 0.26mi | 3/1.5 | 1,439 (-12%) | 9mo | $450,000 | $313 | 58 |
| 2210 Summit Ave | 0.21mi | 3/1.0 | 1,422 (-14%) | 10mo | $425,000 | $299 | 56 |
| 2418 Chestnut St | 0.48mi | 4/2.0 (+1) | 1,550 (-6%) | 14mo | $585,000 | $377 | 51 |
| 1721 Cedar St | 0.71mi | 4/1.5 (+1) | 1,542 (-6%) | 3mo | $545,000 | $353 | 47 |
| 2608 23rd St | 0.72mi | 3/2.0 | 1,560 (-5%) | 14mo | $529,950 | $340 | 46 |
| 2301 Cedar St | 0.64mi | 3/2.0 | 1,448 (-12%) | 14mo | $675,677 | $467 | 39 |
Match score weights: distance 35% · size 25% · config 20% · recency 20%. Top-matched comps best support the ARV.
Projected returns pro-forma
-3.0% appreciation · 2.95% rent growth · sell at horizon
- IRR
- -23.3%
- Equity multiple
- 0.20×
- Total profit
- $-83,865
- Equity at exit
- $55,914
- IRR
- -18.2%
- Equity multiple
- 0.02×
- Total profit
- $-103,275
- Equity at exit
- $32,423
Cash invested: $105,000 (down + closing). Projections, not guarantees.
Landlord ↔ Tenant lean methodology
- Overall (STATE)
- 28 Tenant-Leaning
- State Washington
- 28 Tenant-Leaning · D+8
- County
- — inherits STATE
- City
- — inherits STATE
ZIP-level market 98201
- Rents YoY
- 3.0%
- Active inventory
- 149
- Price-to-rent
- 11.8×
Monthly cashflow live
- Estimated rent
- $2,646 high interval (Pro) →
- Mortgage (P&I)
- −$1,967
- Tax from tax record
- −$328 /mo · $3,931/yr
- Insurance
- −$156
- HOA
- −$0
- Vacancy / Maint / Mgmt
- −$556
- Net cashflow
- $-360
Break-even live
UW: 25.0% down · 7.5% · 30yr · 1.5% tax · 5.0% vac · 8.0% maint · 8.0% mgmt
Financing live
Cash to close
- Down payment
- $93,750
- Closing costs
- $11,250
- Reserves months
- —
- Total cash needed
- —
Loan-product check · same deal, 3 products live
Conventional
25% down · 7.5% · 30yr
- Down + closing
- —
- Monthly P&I
- —
- Monthly cashflow
- —
- DSCR
- —
- Eligible?
- —
Personal DTI + credit; lowest rate.
DSCR
20% down · 8.5% · 30yr
- Down + closing
- —
- Monthly P&I
- —
- Monthly cashflow
- —
- DSCR
- —
- Eligible?
- —
No personal income docs; deal must DSCR.
Hard money
10% down · 12.0% · 12mo
- Down + closing
- —
- Monthly P&I
- —
- Monthly cashflow
- —
- DSCR
- —
- Eligible?
- —
Short-term bridge; refi at stabilization.
Rent comps 16 comps
| Address | Beds | Baths | Sqft | Rent | $/sqft | DOM | Units | Dist |
|---|---|---|---|---|---|---|---|---|
| 2120 E Grand Ave Everett, WA | 3.0 | 1.0 | 1150 | $2,795 | $2.43 | 2d | 1 | 0.03mi |
| 1622 E Marine View Dr Everett, WA | 1.0–4.0 | 1.0–2.0 | 1158 | $2,657 | $2.29 | 2d | 1 | 0.49mi |
| 2820 21st St Everett, WA | 4.0 | 1.5 | 1118 | $2,500 | $2.24 | 24d | 1 | 0.58mi |
| 2431 Pine St Everett, WA | 2.0 | 1.0 | 1200 | $2,250 | $1.88 | 24d | 1 | 0.63mi |
| 1427 Virginia Ave Everett, WA | 3.0 | 2.5 | 1476 | $2,750 | $1.86 | 24d | 1 | 0.98mi |
| 1913 23rd St Unit 1 Everett, WA | 2.0 | 1.0 | 1300 | $2,195 | $1.69 | 20d | 1 | 1.09mi |
| 950 Maple St Unit C Everett, WA | 3.0 | 3.5 | 1700 | $3,200 | $1.88 | 17d | 1 | 1.16mi |
| 950 Maple St Everett, WA | 3.0 | 3.5 | 1699 | $3,300 | $1.94 | 11d | 1 | 1.16mi |
| 950 Maple St Unit F Everett, WA | 3.0 | 3.5 | 1811 | $3,400 | $1.88 | 18d | 1 | 1.16mi |
| 950 Maple St Unit B Everett, WA | 3.0 | 3.5 | 1700 | $3,300 | $1.94 | 17d | 1 | 1.16mi |
| 2209 Colby Ave Unit 4 Everett, WA | 2.0 | 1.0 | 1240 | $1,895 | $1.53 | 2d | 1 | 1.30mi |
| 1520 25th St Everett, WA | 2.0 | 1.0 | 902 | $1,799 | $1.99 | 2d | 2 | 1.38mi |
| 2314 Hoyt Ave Everett, WA | 2.0 | 1.0 | 1400 | $1,985 | $1.42 | 24d | 1 | 1.41mi |
| 3222 Lombard Ave Unit C Everett, WA | 3.0 | 2.5 | 1280 | $2,295 | $1.79 | 3d | 1 | 1.47mi |
| 2628 Hoyt Ave Everett, WA | 2.0 | 1.0–1.5 | 807 | $2,195 | $2.72 | 2d | 3 | 1.48mi |
| 1022 Oakes Ave Unit A Everett, WA | 3.0 | 2.0 | 1160 | $2,600 | $2.24 | 3d | 1 | 1.49mi |
Listing history 15 events
-
2026-06-04days on market $375,000 Active 83 DOM
-
2026-06-03days on market $375,000 Active 82 DOM
-
2026-06-02days on market $375,000 Active 81 DOM
-
2026-06-01days on market $375,000 Active 80 DOM
-
2026-05-31days on market $375,000 Active 79 DOM
-
2026-04-10price $390,000
-
2026-03-13$400,000 Active
-
2017-07-21soldstatus $257,500 Sold
-
2017-07-21soldstatus $257,500
-
2017-06-13status Pending
-
2017-06-01status Pending Inspection
-
2017-05-17status Active
-
2017-05-14status Pending Inspection
-
2017-05-10$265,000 Active
-
1989-09-18soldstatus $40,000
ⓘ Source: listings_history table (triggers on properties + properties_extension) + one-shot
backfill from property_details.listing_events for pre-trigger history.
Tax reassessment forecast WA · Resets to sale price
- Current annual tax
- $3,931 · $328/mo
- Projected year-2 tax
- $3,931 · $328/mo
- Expected delta
- $0/yr ($0/mo · -0.0%)
ⓘ Screening estimate from a state-policy table — verify with the county assessor before closing.
Climate risk First Street
- Flood 1/10 Low FEMA zone X (unshaded) · 0% chance over 30 yrs
- Wildfire 1/10 Low
- Heat 3/10 Moderate 7 d/yr ≥85°F today · 16 d/yr by 30 yrs out
- Wind 1/10 Low
- Air quality 6/10 Major 9 unhealthy d/yr today · 10 by 30 yrs out
Nearby sold comps map
Loading sold comps map…
Walkable amenities ~0.75 mi
Loading nearby amenities…
Taxation est. · year 1
- Rental income
- $31,755
- − Mortgage interest
- −$21,006
- − Property taxes
- −$3,931
- − Insurance
- −$1,875
- − Repairs & maintenance
- −$2,540
- − Management
- −$2,540
- − Depreciation
- −$10,909
- Taxable loss
- −$11,047
- Est. tax savings @ 24.0%
- +$2,651
- After-tax cash flow
- $-1,667/yr
For passive investors: Depreciation is non-cash, so a rental often shows a tax loss while cash-flowing — sheltering income. Rental losses are passive: they offset passive income freely, and up to $25,000/yr can offset ordinary (W-2) income if you actively participate and your MAGI is under $100k (phasing out to $0 by $150k); unused losses carry forward. On sale, claimed depreciation is recaptured at up to 25%, and gains may owe capital-gains tax (a 1031 exchange can defer both). Figures are a year-1 estimate at your 24.0% rate — not tax advice; consult a CPA.
Schools (NCES district)
- District
- Everett School District
- NCES district ID
- 5302670
- Math proficiency
- 60% ▲ 1.00%
- Reading proficiency
- 72% ▲ 1.00%
- Median HH income
- $66,815
- Composite
- 59.0/100
- National rank
- #1964
- State rank
- #26 of 291 in WA
Livability — Everett
- Score
- 73/100
- State rank
- #199
- US rank
- #5489
Category grades
Schools grade is shown separately in the Schools card above.
Census & demographics
- Census place
- Everett, WA
- County
- Snohomish County · 786,756 people
- City population
- 173,457
- Metro
- Seattle-Tacoma-Bellevue, WA
- Population (ZIP)
- 31,895
- Household income
- $74,554
- Rent vs Own
- Severe rent burden
- 2144.0
Population outlook (Snohomish County) Hauer SSP2
- Today (2025)
- 899,800 people
- By 2030
- 960,975 · +6.8%
- By 2040
- 1,074,447 · +19.4%
- By 2050
- 1,171,954 · +30.2%
- By 2075
- 1,384,849 · +53.9%
- By 2100
- 1,497,296 · +66.4%
Race, ethnicity, and origin ACS 2023
- Neighborhood character
- Predominantly White (71%)
- Race & ethnicity
- White 71% Hispanic / Latino 12% Two or more races 12% Asian 3% Pacific Islander 2% Black 2% Native American 1%
- Hispanic origin (detail)
- Mexican 7%
- Common ancestry
- Portuguese 6% Italian 4% Slovak 4%
- Foreign-born
- 10% · Canada, Jamaica, Vietnam
- Languages at home
- 87% English-only · Spanish 6% Russian/Polish/Slavic 2% Other Asian/Pacific 1%
Political lean MEDSL · Snohomish
- 2024 margin
- D (+19.0) · D 57.8% · R 38.9% · Other 3.3%
- 2008→2024 swing
- +0.1pp no change · 2008: 18.9pp · 2024: 19.0pp
- All cycles
- 2024: D+19.0 2020: D+20.6 2016: D+16.6 2012: D+16.2 2008: D+18.9
Not yet ingested
- Civics
- —
Market trends
- HPI YoY
- ▼ -793.56%
- Current HPI
- 339.2661
- Rent YoY
- ▲ 2.95%
- Metro
- Seattle-Tacoma-Bellevue, WA
- State GDP YoY
- ▲ 4.65%
- F500 in state
- 22
Industry mix (Fortune 500 HQ in WA)
| Industry | F500 HQs | Revenue |
|---|---|---|
| Retail | 2 | $269B |
|
||
| Technology / Retail | 1 | $638B |
|
||
| Technology | 1 | $245B |
|
||
| Telecommunications | 1 | $38B |
|
||
| Food / Beverage | 1 | $36B |
|
||
| Automotive / Trucks | 1 | $34B |
|
||
Price history
+875.0% since first listed10 events — show timeline
- 2026-04-10 Price Changed $390,000 NWMLS as Distributed by MLS Grid
- 2026-03-13 Listed $400,000 NWMLS as Distributed by MLS Grid
- 2017-07-21 Sold (Public Records) $257,500 Public Records
- 2017-07-21 Sold (MLS) $257,500 NWMLS as Distributed by MLS Grid
- 2017-06-13 Pending — NWMLS as Distributed by MLS Grid
- 2017-06-01 Pending — NWMLS as Distributed by MLS Grid
- 2017-05-17 Relisted — NWMLS as Distributed by MLS Grid
- 2017-05-14 Pending — NWMLS as Distributed by MLS Grid
- 2017-05-10 Listed $265,000 NWMLS as Distributed by MLS Grid
- 1989-09-18 Sold (Public Records) $40,000 Public Records
Property tax history
+21.4%/yrLatest (2026): $3,931 · +4.3% YoY. Source: county tax records.
Cash-flow waterfall
monthlySold comps — $/sqft
last 12 mo · ≤1 miLoading sold comps…