 Duplex
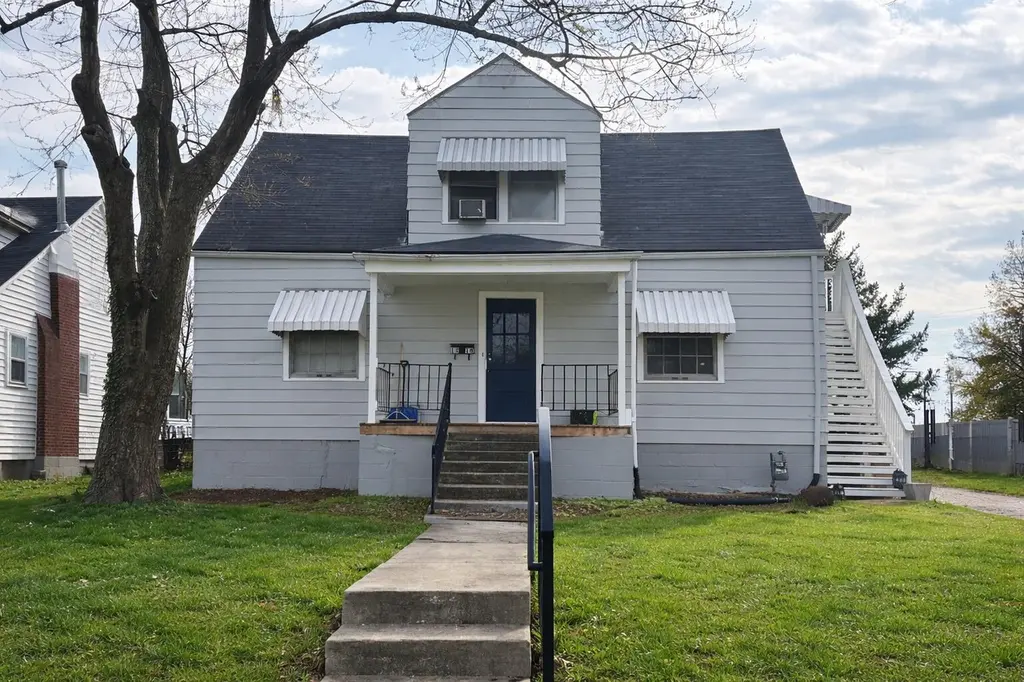
1318 Highland Park Dr · Lexington-Fayette, KY
Flood risk 1/10 · Minimal
- FEMA flood zone
- X (unshaded)
- Chance of flooding over 30 yrs
- 0.0%
- Est. flood insurance / yr
- $473 – $860
Fire risk 1/10 · Minimal
- Est. fire insurance / yr
- $839 – $1,559
Heat risk 4/10 · Minor
- Hot days now (above 101°F)
- 7 days/yr
- Hot days in 30 yrs
- 19 days/yr
Wind risk 2/10 · Minimal
- Chance of severe wind over 30 yrs
- 2.0%
Air-quality risk 2/10 · Minimal
- Unhealthy air days now
- 0 days/yr
- Unhealthy air days in 30 yrs
- 2 days/yr
Risk factors via First Street. Map © Google.
Why this score? — see what drove the B- grade
The composite is a weighted blend of 9 inputs, each scored 0–100. Each bar is that input's sub-score; the figure is the points it added to the 100-point composite (weight × sub-score).
- Cash flow +30.0/30.0
- DSCR +10.0/10.0
- 1% rule +8.2/10.0
- ARV discount +7.5/15.0
- Rent growth +3.6/5.0
- Schools +3.4/10.0
- Livability +2.5/5.0
- Condition / age +2.5/5.0
- Appreciation +0.0/10.0
$209,900
🖨 Deal sheet 📄 Offer letter ✓ Due diligence
Multi-family units
County records classify this as Multi-Family (2-4 Unit). Listing-text estimate: 2 units. confirmed
Listing remarks
Attention investors! Don't miss your next Lexington opportunity—this duplex offers 1,344 sq ft of living space plus 846 sq ft of unfinished basement space with strong value-add potential. The lower 2 bed / 1 bath unit is a spacious 894 sq ft and rented for $975/month through March 2027, while the upper 1 bed / 1 bath unit is 450 sq ft and rented for $910/month through June 2026. The property also features a large backyard, detached garage and off-street parking. Financial statements available on Flex documents.
Key facts
- 7,492 sq ft lot
- Built 1944
- Listed 53 days
Property features AI
Finance
- Other: Parcel number 12408200
Exterior
- Home design: Duplex; 2-story building; Total building area about 1,344
- Exterior features: Lot in The Meadows subdivision; Lot size about 0.17 acres
Interior
- Bathrooms: 2 full bathrooms
- Heating & cooling: Forced air heating; Central air conditioning; Window air conditioning units
- Interior features: Central air conditioning and window units; Forced air heating
Neighborhood map
What this means for you Summary
Snapshot
- This is a 2 × 3-bed/2.0-bath units multifamily listed at $210k.
Deal economics
- At list price, monthly cash flow is $927 ($11k/yr) — positive. Per door: $463/mo.
- The deal already cash-flows at list — no discount required.
- Meets the 1% rule at list price ($3k rent vs $210k).
- Recommended offer: $204k (3.0% below list) — sets the bar for market timing.
- Cap rate 11.6% vs local median 3.8% in Lexington-Fayette — top-decile yield for the area; either an underpriced asset or a hidden risk that comps aren't pricing in. Stress-test before assuming the spread holds.
Location & tenants
- Location reads: area grade B — affects rentability + tenant quality, not the cash-flow math above.
- Fayette County (urban): math 35% / reading 45% proficiency, ranked #27 of 165 in KY (top 16%) — families likely to look elsewhere, expect single-tenant / working-renter base with shorter leases.
- Zoned schools: Northern Elementary School (math 12% / reading 17%, grade F, #627 of 676 statewide, top 93%, 439 students, 71% FRL); Bryan Station Middle School (math 23% / reading 42%, grade F, #116 of 217 statewide, top 55%, 815 students, 56% FRL); Bryan Station High School (math 18% / reading 25%, grade F, #209 of 254 statewide, top 82%, 1,893 students, 59% FRL) — zoned schools average 62% FRL vs 44% district-wide (18 pts higher); higher-poverty schools than district average — tighter screening recommended.
- Zoned-school proficiency averages 23% at this address vs 40% district-wide (-17 pts) — the specific schools serving this property underperform the Fayette County average; the district grade overstates school quality for this exact location.
- Market conditions: Rents rising fast (+4.3%/yr); 68 active listings in the ZIP; 1,036 units permitted in Fayette County in 2024 (542 in 5+ unit buildings).
Forward outlook
- Local home prices are declining (-3.0%/yr); year-one equity from $1k of loan paydown is wiped out by about $6k of value loss. Plan a longer hold.
- Fayette County population projected at +35% by 2050 — long-run rental-demand tailwind backs the buy-and-hold thesis.
- At projected returns (-3.0% appreciation + 4.3% rent growth), your $59k cash investment doubles in ~6 years — after that, you're playing with house money.
Negotiation context
- It's been on market 53 days — a 3% lower offer ($204k) is reasonable based on typical stale-listing flexibility.
- 8 sale attempts since 18y ago with the ask held roughly flat each time — persistent listings suggest the price (not the market) is what's stuck; bring a comps-based counter.
- Current owner paid $105k; list at $210k implies a 100% gain — meaningful room to come down on a strong offer.
Risks & watch-outs
- Watch-outs: built in 1944 — expect roof / HVAC / electrical / plumbing capex.
Questions for the listing agent
- It's been on market 53 days. Have you received any prior offers? Is the seller open to a 3% concession, seller financing, or rate buy-down credit?
- Can we see the unit-by-unit rent roll, current vacancy, and any below-market leases? What's the average tenancy length?
- What capital expenditures (roof, boiler, parking lot, exteriors) have been made in the last 5 years, and what's planned in the next 2?
- Built in 1944 — when were the roof, HVAC, electrical panel, plumbing, and water heater last replaced?
- Is there a deadline driving the sale (1031 exchange, divorce, estate, relocation)? That informs how much negotiation room exists.
- What's the average days-on-market for RENTAL listings here right now (not sales)? A rising rental-DOM trend means longer vacancies and softer asking-rent achievability than the comps imply.
- What's the recent tenant-quality profile in this submarket — average credit score on applications, eviction rate, late-payment / NSF rate, and stable-employment percentage? A property-management company in the area should have these aggregated.
- How much new apartment / multifamily construction is in the pipeline within 1–3 miles? Heavy new supply (>2% of stock underway) typically softens rents 12–24 months out; light construction supports rent growth.
Investment metrics
- 1% rule
- 1.32% ✓
- Cap rate
- 11.59%
- Cash-on-cash
- 18.92%
- DSCR
- 1.84
- GRM
- 6.3
CMA / ARV
No comps found within radius.
Projected returns pro-forma
-3.0% appreciation · 4.31% rent growth · sell at horizon
- IRR
- 12.1%
- Equity multiple
- 1.49×
- Total profit
- $28,634
- Equity at exit
- $31,297
- IRR
- 22.0%
- Equity multiple
- 2.98×
- Total profit
- $116,249
- Equity at exit
- $18,148
Cash invested: $58,772 (down + closing). Projections, not guarantees.
Landlord ↔ Tenant lean methodology
- Overall (STATE)
- 83 Strongly Landlord-Friendly
- State Kentucky
- 83 Strongly Landlord-Friendly · R+16
- County
- — inherits STATE
- City
- — inherits STATE
ZIP-level market 40505
- Rents YoY
- 4.3%
- Active inventory
- 68
- Price-to-rent
- 12.6×
Monthly cashflow live
- Estimated rent
- $2,775 high interval (Pro) →
- Mortgage (P&I)
- −$1,101
- Tax from tax record
- −$77 /mo · $930/yr
- Insurance
- −$87
- HOA
- −$0
- Vacancy / Maint / Mgmt
- −$583
- Net cashflow
- $927
Break-even live
2-unit breakdown (identical units grouped — click to expand)
| Units | Beds | Baths | Est. rent |
|---|---|---|---|
| 2× units | 3 | 2 | $2,774 |
| #1 | 3 | 2 | $1,387 |
| #2 | 3 | 2 | $1,387 |
| Total (2 units) | $2,775 | ||
UW: 25.0% down · 7.5% · 30yr · 1.5% tax · 5.0% vac · 8.0% maint · 8.0% mgmt
Financing live
Cash to close
- Down payment
- $52,475
- Closing costs
- $6,297
- Reserves months
- —
- Total cash needed
- —
Loan-product check · same deal, 3 products live
Conventional
25% down · 7.5% · 30yr
- Down + closing
- —
- Monthly P&I
- —
- Monthly cashflow
- —
- DSCR
- —
- Eligible?
- —
Personal DTI + credit; lowest rate.
DSCR
20% down · 8.5% · 30yr
- Down + closing
- —
- Monthly P&I
- —
- Monthly cashflow
- —
- DSCR
- —
- Eligible?
- —
No personal income docs; deal must DSCR.
Hard money
10% down · 12.0% · 12mo
- Down + closing
- —
- Monthly P&I
- —
- Monthly cashflow
- —
- DSCR
- —
- Eligible?
- —
Short-term bridge; refi at stabilization.
Listing history 24 events
-
2026-06-18days on market $209,900 Active 53 DOM
-
2026-06-17days on market $209,900 Active 52 DOM
-
2026-06-16days on market $209,900 Active 51 DOM
-
2026-06-15days on market $209,900 Active 50 DOM
-
2026-06-14days on market $209,900 Active 48 DOM
-
2026-06-13statusdays on market $209,900 Active 47 DOM
-
2026-05-18status Active
-
2026-04-30status Pending
-
2026-04-16price $209,900
-
2026-03-26$219,900 Active
-
2022-09-29soldstatus $105,000
-
2011-04-12historical
-
2010-07-10historical
-
2010-01-13$87,500
-
2010-01-11$87,500
-
2010-01-09historical
-
2009-06-19historical
-
2009-01-19$92,000
-
2009-01-08$89,900
-
2008-12-09historical
-
2008-12-09historical
-
2008-11-03$96,000
-
2008-11-03$96,000
-
2008-07-02soldstatus $77,000
ⓘ Source: listings_history table (triggers on properties + properties_extension) + one-shot
backfill from property_details.listing_events for pre-trigger history.
Tax reassessment forecast KY · Resets to sale price
- Current annual tax
- $930 · $77/mo
- Projected year-2 tax
- $1,805 · $150/mo
- Expected delta
- +$875/yr (+$73/mo · 94.1%)
ⓘ Screening estimate from a state-policy table — verify with the county assessor before closing.
Climate risk First Street
- Flood 1/10 Low FEMA zone X (unshaded) · 0% chance over 30 yrs
- Wildfire 1/10 Low
- Heat 4/10 Moderate 7 d/yr ≥101°F today · 19 d/yr by 30 yrs out
- Wind 2/10 Low 2% chance of damaging wind over 30 yrs
- Air quality 2/10 Low 0 unhealthy d/yr today · 2 by 30 yrs out
Nearby sold comps map
Loading sold comps map…
Walkable amenities ~0.75 mi
Loading nearby amenities…
Taxation est. · year 1
- Rental income
- $33,300
- − Mortgage interest
- −$11,758
- − Property taxes
- −$930
- − Insurance
- −$1,050
- − Repairs & maintenance
- −$2,664
- − Management
- −$2,664
- − Depreciation
- −$6,106
- Taxable income
- $8,129
- Est. tax owed @ 24.0%
- −$1,951
- After-tax cash flow
- $9,168/yr
For passive investors: Depreciation is non-cash, so a rental often shows a tax loss while cash-flowing — sheltering income. Rental losses are passive: they offset passive income freely, and up to $25,000/yr can offset ordinary (W-2) income if you actively participate and your MAGI is under $100k (phasing out to $0 by $150k); unused losses carry forward. On sale, claimed depreciation is recaptured at up to 25%, and gains may owe capital-gains tax (a 1031 exchange can defer both). Figures are a year-1 estimate at your 24.0% rate — not tax advice; consult a CPA.
Schools (NCES district)
- District
- Fayette County
- NCES district ID
- 2101860
- Math proficiency
- 35% ▼ -16.00%
- Reading proficiency
- 45% ▼ -13.00%
- Median HH income
- $49,245
- Composite
- 34.38/100
- National rank
- #5211
- State rank
- #27 of 165 in KY
Livability — Lexington-Fayette
No livability data for this city. (Only ~50 U.S. cities are tracked.)
Census & demographics
- Census place
- Lexington-Fayette, KY
- County
- Fayette County · 317,143 people
- City population
- 321,882
- Metro
- Lexington-Fayette, KY
- Population (ZIP)
- 25,594
- Household income
- $58,206
- Rent vs Own
- Severe rent burden
- 1232.0
Population outlook (Fayette County) Hauer SSP2
- Today (2025)
- 363,454 people
- By 2030
- 388,270 · +6.8%
- By 2040
- 438,688 · +20.7%
- By 2050
- 490,667 · +35.0%
- By 2075
- 625,394 · +72.1%
- By 2100
- 721,354 · +98.5%
Race, ethnicity, and origin ACS 2023
- Neighborhood character
- Predominantly White (65%)
- Race & ethnicity
- White 65% Black 17% Hispanic / Latino 13% Two or more races 10%
- Hispanic origin (detail)
- Mexican 9% Cuban 2%
- Common ancestry
- Italian 3% Serbian 2% Slovak 1%
- Foreign-born
- 7% · Canada
- Languages at home
- 89% English-only · Spanish 10%
Political lean MEDSL · Fayette
- 2024 margin
- D (+18.1) · D 58.0% · R 39.9% · Other 2.1%
- 2008→2024 swing
- +13.3pp toward D · 2008: 4.8pp · 2024: 18.1pp
- All cycles
- 2024: D+18.1 2020: D+20.8 2016: D+9.5 2012: D+1.0 2008: D+4.8
Not yet ingested
- Civics
- —
Market trends
- HPI YoY
- ▼ -191.31%
- Current HPI
- 249.2066
- Rent YoY
- ▲ 4.31%
- Metro
- Lexington-Fayette, KY
- State GDP YoY
- ▲ 1.81%
- F500 in state
- 4
Industry mix (Fortune 500 HQ in KY)
| Industry | F500 HQs | Revenue |
|---|---|---|
| Healthcare | 1 | $118B |
|
||
| Food / Beverage | 1 | $7B |
|
||
Price history
+172.6% since first listed18 events — show timeline
- 2026-05-18 Relisted — ImagineMLS
- 2026-04-30 Pending — ImagineMLS
- 2026-04-16 Price Changed $209,900 ImagineMLS
- 2026-03-26 Listed $219,900 ImagineMLS
- 2022-09-29 Sold (Public Records) $105,000 Public Records
- 2011-04-12 Listing Removed — ImagineMLS
- 2010-07-10 Listing Removed — ImagineMLS
- 2010-01-13 Listed $87,500 ImagineMLS
- 2010-01-11 Listed $87,500 ImagineMLS
- 2010-01-09 Listing Removed — ImagineMLS
- 2009-06-19 Listing Removed — ImagineMLS
- 2009-01-19 Listed $92,000 ImagineMLS
- 2009-01-08 Listed $89,900 ImagineMLS
- 2008-12-09 Listing Removed — ImagineMLS
- 2008-12-09 Listing Removed — ImagineMLS
- 2008-11-03 Listed $96,000 ImagineMLS
- 2008-11-03 Listed $96,000 ImagineMLS
- 2008-07-02 Sold (Public Records) $77,000 Public Records
Property tax history
+1.8%/yrLatest (2015): $930 · +1.8% YoY. Source: county tax records.
Cash-flow waterfall
monthlySold comps — $/sqft
last 12 mo · ≤1 miLoading sold comps…