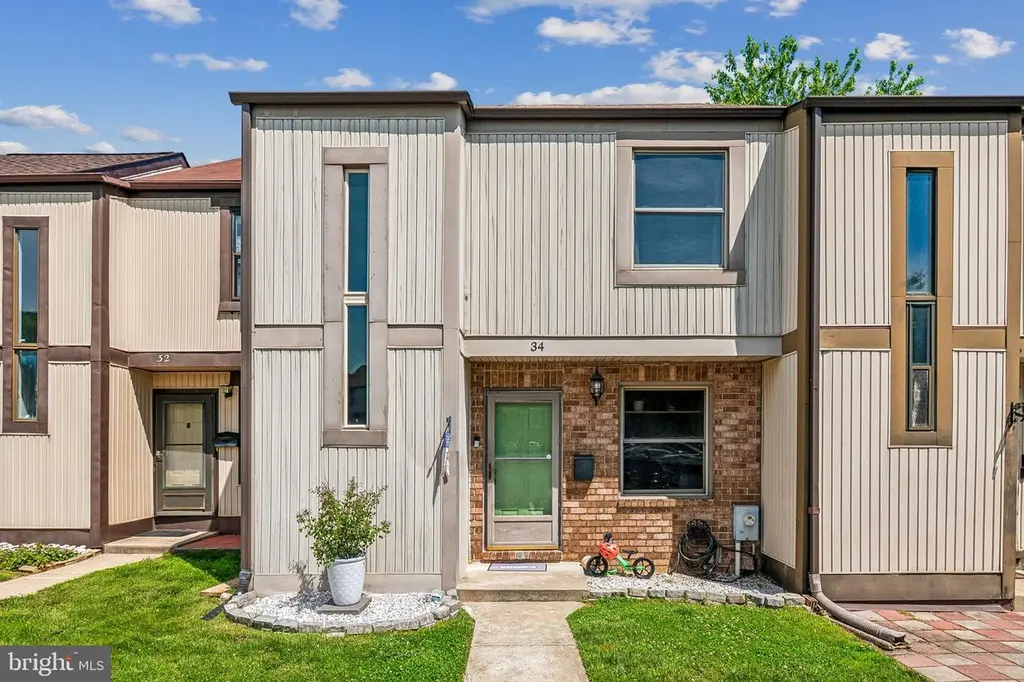
34 Helmsman Ct · Essex, MD
Flood risk 4/10 · Minor
- FEMA flood zone
- X (unshaded)
- Chance of flooding over 30 yrs
- 0.16%
- Est. flood insurance / yr
- $473 – $860
Fire risk 2/10 · Minimal
- Est. fire insurance / yr
- $755 – $1,403
Heat risk 8/10 · Major
- Hot days now (above 104°F)
- 7 days/yr
- Hot days in 30 yrs
- 15 days/yr
Wind risk 6/10 · Moderate
- Chance of severe wind over 30 yrs
- 47.0%
Air-quality risk 5/10 · Moderate
- Unhealthy air days now
- 6 days/yr
- Unhealthy air days in 30 yrs
- 8 days/yr
Risk factors via First Street. Map © Google.
Why this score? — see what drove the D grade
The composite is a weighted blend of 9 inputs, each scored 0–100. Each bar is that input's sub-score; the figure is the points it added to the 100-point composite (weight × sub-score).
- Cash flow +12.7/30.0
- ARV discount +10.1/15.0
- 1% rule +4.0/10.0
- Livability +4.0/5.0
- DSCR +3.8/10.0
- Rent growth +2.8/5.0
- Condition / age +2.5/5.0
- Schools +2.3/10.0
- Appreciation +0.0/10.0
$250,000
🖨 Deal sheet 📄 Offer letter ✓ Due diligence
Listing remarks MLS
3 Bedroom, One Full and Two Half Baths Inside of Group Townhouse with a waterview from the rear deck Roof replaced 5+/- years ago
Key facts
- $117 HOA
- Built 1977
- Listed 10 days
Property features AI
Finance
- HOA & community: HOA fee approximately $1,400 annually
Exterior
- Parking: Driveway parking; Off-street parking
- Utilities: Public water; Public sewer; 200+ amp electrical service
- Home design: Interior townhouse/rowhouse; Fee simple ownership; Property in average condition; Suburban location
- Construction: Brick and vinyl siding exterior; Block foundation; Asphalt shingle roof; Double-hung, vinyl-clad windows; Building not winterized
- Exterior features: Deck(s) and patio(s)
Interior
- Kitchen: Stove; Refrigerator
- Bedrooms: Three bedrooms on the upper level
- Flooring: Laminate plank flooring; Vinyl flooring
- Bathrooms: One full bathroom (upper level); Two half bathrooms (one on main level, one on lower level)
- Heating & cooling: Heat pump(s) heating; Central air conditioning; Electric heating and cooling systems; Electric hot water
- Interior features: Drywall walls and ceilings; Living room, dining room, kitchen and recreation room; Has one wood-burning fireplace; Basement present; approximately 75% finished
- Laundry & utility: Laundry in basement
Neighborhood map
What this means for you Summary
Snapshot
- This is a 3-bed/1.5-bath townhouse listed at $250k.
Deal economics
- At list price, monthly cash flow is $-26 ($-307/yr) — negative.
- To cash-flow at today's rent, offer at most $245k (1.8% below list).
- To meet the 1% rule (rent ≥ 1% of price), the offer needs to be $225k (9.9% below list).
- Recommended offer: $225k (9.9% below list) — sets the bar for 1% rule.
- Cap rate 6.2% vs local median 4.8% in Essex — meaningfully above typical; check what's discounted (condition, days-on-market, listing class) to confirm the premium yield is real.
Location & tenants
- Location reads 79/100 on livability (#60 in MD, #2,277 nationally) — a middle-class / working-renter tenant base. Strengths: commute A+, housing A+, health & safety A; Watch: amenities D+, schools D, crime F.
- Baltimore County Public Schools (suburban): math 15% / reading 34% proficiency, ranked #11 of 24 in MD (top 46%) — low school quality limits family demand, transient renter base, plan for 1-2y turnover.
- Market conditions: Rents rising (+1.1%/yr); 138 active listings in the ZIP; 27 comparable units currently listed for rent nearby; rentals at typical pace (median 20d on market — plan ~3-4 weeks tenant-placement turnaround); 1,511 units permitted in Baltimore County in 2024 (643 in 5+ unit buildings).
- This rent runs 40% of the median local income ($67k/yr) — at the standard rent-burdened threshold; future hikes will face affordability resistance.
Forward outlook
- Local home prices are declining (-3.0%/yr); year-one equity from $2k of loan paydown is wiped out by about $8k of value loss. Plan a longer hold.
- Baltimore County population projected at +12% by 2050 — modest demand growth; plan on rents tracking national, not racing it.
Negotiation context
- Only 10 days on market — expect competitive offers; lowballing is unlikely to land.
- Current owner paid $135k; list at $250k implies a 85% gain — meaningful room to come down on a strong offer.
Risks & watch-outs
- Climate carrying-cost: major wind risk, 47% chance of damaging wind over 30y; extreme-heat days projected 7→15/yr by 2055 (HVAC capex compounding) — expect insurance premiums to compound above CPI over the hold.
Questions for the listing agent
- What do current leases actually rent for vs. the listed asking? Can we see a recent rent roll and the last 12 months of T-12 income?
- Built in 1977 — when were the roof, HVAC, electrical panel, plumbing, and water heater last replaced?
- What does the HOA fee cover, when was the last increase, and are there any pending special assessments or reserve-fund shortfalls?
- Is there a deadline driving the sale (1031 exchange, divorce, estate, relocation)? That informs how much negotiation room exists.
- Schools are D-rated, which usually means shorter tenancies and higher turnover. Who's the typical renter profile here, and what's been the actual vacancy rate?
- Crime grade is F in this area — have there been break-ins, vandalism, or insurance claims at this property in the last 3 years? What carrier currently insures it and at what premium?
- The area grade is low — what's the realistic commute time and amenity access for the typical tenant pool here? Any planned neighborhood developments (good or bad) we should know about?
- What's the average days-on-market for RENTAL listings here right now (not sales)? A rising rental-DOM trend means longer vacancies and softer asking-rent achievability than the comps imply.
- What's the recent tenant-quality profile in this submarket — average credit score on applications, eviction rate, late-payment / NSF rate, and stable-employment percentage? A property-management company in the area should have these aggregated.
- How much new for-sale + rental construction is in the pipeline within 1–3 miles? Heavy new supply typically softens prices + rents 12–24 months out; constrained supply supports both.
Investment metrics
- 1% rule
- 0.90% ✗
- Cap rate
- 6.17%
- Cash-on-cash
- -0.44%
- DSCR
- 0.98
- GRM
- 9.2
CMA / ARV
- ARV (on-the-fly)
- $265,200
- Comps found
- 12
Show comp detail 12 sales within ~0.75 mi
| Address | Dist | Beds/Ba | Sqft | Sold | Price | $/sf | Match |
|---|---|---|---|---|---|---|---|
| 548 Hopkins Landing Dr #548 | 0.25mi | 2/2.0 (-1) | 1,548 (-1%) | 2mo | $290,000 | $187 | 79 |
| 1654 Poles Rd | 0.37mi | 3/2.0 | 1,539 (-1%) | 8mo | $181,000 | $118 | 72 |
| 556 Hopkins Landing Dr #556 | 0.25mi | 2/2.0 (-1) | 1,547 (-1%) | 10mo | $330,000 | $213 | 72 |
| 15 Ebbing | 0.11mi | 4/2.5 (+1) | 1,440 (-8%) | 8mo | $277,500 | $193 | 67 |
| 36 Bladen Rd | 0.48mi | 3/2.0 | 1,512 (-3%) | 8mo | $248,000 | $164 | 64 |
| 608 Hopkins Landing Dr #608 | 0.29mi | 2/2.0 (-1) | 1,654 (+6%) | 7mo | $280,000 | $169 | 63 |
| 774 Seawall | 0.71mi | 3/1.5 | 1,521 (-2%) | 1mo | $258,000 | $170 | 62 |
| 618 Hopkins Landing Dr #618 | 0.29mi | 2/2.0 (-1) | 1,654 (+6%) | 10mo | $280,000 | $169 | 62 |
| 2162 Vailthorn | 0.71mi | 3/2.0 | 1,536 (-2%) | 2mo | $234,000 | $152 | 60 |
| 267 Southeastern Ter | 0.59mi | 3/2.0 | 1,512 (-3%) | 11mo | $235,000 | $155 | 57 |
| 783 Seawall Rd | 0.69mi | 3/1.0 | 1,396 (-10%) | 2mo | $245,000 | $176 | 46 |
| 712 Seawall Rd | 0.69mi | 3/1.5 | 1,396 (-10%) | 8mo | $247,000 | $177 | 44 |
Match score weights: distance 35% · size 25% · config 20% · recency 20%. Top-matched comps best support the ARV.
Projected returns pro-forma
-3.0% appreciation · 1.08% rent growth · sell at horizon
- IRR
- -19.3%
- Equity multiple
- 0.34×
- Total profit
- $-46,327
- Equity at exit
- $37,276
- IRR
- -16.6%
- Equity multiple
- 0.16×
- Total profit
- $-58,968
- Equity at exit
- $21,615
Cash invested: $70,000 (down + closing). Projections, not guarantees.
Landlord ↔ Tenant lean methodology
- Overall (STATE)
- 27 Tenant-Leaning
- State Maryland
- 27 Tenant-Leaning · D+14
- County
- — inherits STATE
- City
- — inherits STATE
ZIP-level market 21221
- Rents YoY
- 1.1%
- Active inventory
- 138
- Price-to-rent
- 9.2×
Monthly cashflow live
- Estimated rent
- $2,253 high interval (Pro) →
- Mortgage (P&I)
- −$1,311
- Tax from tax record
- −$274 /mo · $3,282/yr
- Insurance
- −$104
- HOA
- −$117
- Vacancy / Maint / Mgmt
- −$473
- Net cashflow
- $-26
Break-even live
UW: 25.0% down · 7.5% · 30yr · 1.5% tax · 5.0% vac · 8.0% maint · 8.0% mgmt
Financing live
Cash to close
- Down payment
- $62,500
- Closing costs
- $7,500
- Reserves months
- —
- Total cash needed
- —
Loan-product check · same deal, 3 products live
Conventional
25% down · 7.5% · 30yr
- Down + closing
- —
- Monthly P&I
- —
- Monthly cashflow
- —
- DSCR
- —
- Eligible?
- —
Personal DTI + credit; lowest rate.
DSCR
20% down · 8.5% · 30yr
- Down + closing
- —
- Monthly P&I
- —
- Monthly cashflow
- —
- DSCR
- —
- Eligible?
- —
No personal income docs; deal must DSCR.
Hard money
10% down · 12.0% · 12mo
- Down + closing
- —
- Monthly P&I
- —
- Monthly cashflow
- —
- DSCR
- —
- Eligible?
- —
Short-term bridge; refi at stabilization.
Rent comps 27 comps
| Address | Beds | Baths | Sqft | Rent | $/sqft | DOM | Units | Dist |
|---|---|---|---|---|---|---|---|---|
| 28 Ebbing Ct Essex, MD | 3.0 | 2.5 | 1464 | $2,195 | $1.50 | 11d | 1 | 0.09mi |
| 146 Marine Oaks Dr Essex, MD | 3.0 | 1.5 | 1516 | $2,700 | $1.78 | 24d | 1 | 0.09mi |
| 439 Hopkins Landing Dr Essex, MD | 2.0 | 2.0 | 1485 | $1,795 | $1.21 | 11d | 1 | 0.22mi |
| 1710 Huber Rd Essex, MD | 3.0 | 2.5 | 1848 | $2,900 | $1.57 | 44d | 1 | 0.36mi |
| 1402 Nicolay Way Unit 1 Essex, MD | 3.0 | 1.5 | 1432 | $1,925 | $1.34 | 5d | 1 | 0.55mi |
| 1402 Nicolay Way Essex, MD | 3.0 | 2.0 | 1432 | $1,925 | $1.34 | 3d | 1 | 0.55mi |
| 54 Stemmers Run Rd Essex, MD | 3.0 | 2.5 | 1260 | $1,950 | $1.55 | 44d | 1 | 0.61mi |
| 706 Seawall Rd Essex, MD | 3.0 | 1.0 | 1114 | $1,900 | $1.71 | 5d | 1 | 0.64mi |
| 2128 Cockspur Rd Middle River, MD | 3.0 | 1.5 | 1272 | $2,100 | $1.65 | 24d | 1 | 0.69mi |
| 2167 Graythorn Rd Middle River, MD | 3.0 | 1.5 | 1324 | $1,900 | $1.44 | 24d | 1 | 0.73mi |
| 736 West Kingsway Middle River, MD | 3.0 | 1.0 | 1100 | $1,742 | $1.58 | 19d | 7 | 0.74mi |
| 2203 Redthorn Rd Middle River, MD | 3.0 | 2.0 | 1144 | $2,200 | $1.92 | 11d | 1 | 0.79mi |
| 2202 Firethorn Rd Middle River, MD | 3.0 | 2.5 | 1324 | $2,300 | $1.74 | 44d | 1 | 0.81mi |
| 2207 Firethorn Rd Middle River, MD | 3.0 | 1.5 | 1600 | $2,400 | $1.50 | 16d | 1 | 0.83mi |
| 60 S Hawthorne Rd Middle River, MD | 3.0 | 1.0 | 1234 | $2,250 | $1.82 | 44d | 1 | 0.86mi |
| 2125 Hawthorne Rd Middle River, MD | 3.0 | 2.0 | 1299 | $2,100 | $1.62 | 44d | 1 | 0.91mi |
| 153 Bennett Rd Unit Labs Essex, MD | 2.0 | 2.0 | 1196 | $1,800 | $1.51 | 5d | 1 | 0.93mi |
| 233 Orville Rd Essex, MD | 3.0 | 2.0 | 1144 | $1,850 | $1.62 | 44d | 1 | 1.06mi |
| 326 Stemmers Run Rd Essex, MD | 4.0 | 2.0 | 1144 | $2,300 | $2.01 | 44d | 1 | 1.11mi |
| 832 N Marlyn Ave Essex, MD | 3.0 | 2.0 | 1416 | $2,300 | $1.62 | 44d | 1 | 1.13mi |
| 1022 Foxwood Ln Essex, MD | 3.0 | 2.0 | 1152 | $2,200 | $1.91 | 16d | 1 | 1.25mi |
| 1 Alder Dr Middle River, MD | 1.0–3.0 | 1.0 | 1000 | $2,249 | $2.25 | 5d | 10 | 1.28mi |
| 1112 Tace Dr Essex, MD | 3.0 | 1.0 | 1728 | $1,781 | $1.03 | 2d | 14 | 1.29mi |
| 953 Walnut Grove Rd Essex, MD | 3.0 | 2.0–2.5 | 1600 | $2,115 | $1.32 | 2d | 18 | 1.30mi |
| 1005 Kayden Ln Essex, MD | 3.0 | 1.5 | 1152 | $2,200 | $1.91 | 44d | 1 | 1.30mi |
| 1043 Debbie Ave Essex, MD | 4.0 | 2.5 | 1860 | $2,300 | $1.24 | 12d | 1 | 1.43mi |
| 951 Bayner Rd Unit 951 Essex, MD | 3.0 | 2.0 | 1152 | $2,200 | $1.91 | 44d | 1 | 1.43mi |
HOA detail
- Monthly dues
- $117 · $1,404/yr
- Likely covers
- water
Listing history 9 events
-
2026-06-18days on market $250,000 Active 10 DOM
-
2026-06-17days on market $250,000 Active 9 DOM
-
2026-06-16days on market $250,000 Active 8 DOM
-
2026-06-15days on market $250,000 Active 7 DOM
-
2026-06-13days on market $250,000 Active 5 DOM
-
2026-06-09statusdays on market $250,000 Active 1 DOM
-
2026-06-08days on market $250,000 Coming Soon 4 DOM
-
2026-06-07remarks 699-char remark
-
2026-06-07$250,000 Coming Soon 3 DOM
ⓘ Source: listings_history table (triggers on properties + properties_extension) + one-shot
backfill from property_details.listing_events for pre-trigger history.
Tax reassessment forecast MD · Partial reset (capped growth)
- Current annual tax
- $3,282 · $274/mo
- Projected year-2 tax
- $3,282 · $274/mo
- Expected delta
- $0/yr ($0/mo · 0.0%)
ⓘ Screening estimate from a state-policy table — verify with the county assessor before closing.
Climate risk First Street
- Flood 4/10 Moderate FEMA zone X (unshaded) · 16% chance over 30 yrs
- Wildfire 2/10 Low
- Heat 8/10 Severe 7 d/yr ≥104°F today · 15 d/yr by 30 yrs out
- Wind 6/10 Major 47% chance of damaging wind over 30 yrs
- Air quality 5/10 Major 6 unhealthy d/yr today · 8 by 30 yrs out
Nearby sold comps map
Loading sold comps map…
Walkable amenities ~0.75 mi
Loading nearby amenities…
Taxation est. · year 1
- Rental income
- $27,040
- − Mortgage interest
- −$14,004
- − Property taxes
- −$3,282
- − Insurance
- −$1,250
- − Repairs & maintenance
- −$2,163
- − Management
- −$2,163
- − HOA
- −$1,404
- − Depreciation
- −$7,273
- Taxable loss
- −$4,499
- Est. tax savings @ 24.0%
- +$1,080
- After-tax cash flow
- $773/yr
For passive investors: Depreciation is non-cash, so a rental often shows a tax loss while cash-flowing — sheltering income. Rental losses are passive: they offset passive income freely, and up to $25,000/yr can offset ordinary (W-2) income if you actively participate and your MAGI is under $100k (phasing out to $0 by $150k); unused losses carry forward. On sale, claimed depreciation is recaptured at up to 25%, and gains may owe capital-gains tax (a 1031 exchange can defer both). Figures are a year-1 estimate at your 24.0% rate — not tax advice; consult a CPA.
Schools (NCES district)
- District
- Baltimore County Public Schools
- NCES district ID
- 2400120
- Math proficiency
- 15% ▼ -16.00%
- Reading proficiency
- 34% ▼ -5.00%
- Median HH income
- $66,746
- Composite
- 23.17/100
- National rank
- #7948
- State rank
- #11 of 24 in MD
Livability — Essex
- Score
- 79/100
- State rank
- #60
- US rank
- #2277
Category grades
Schools grade is shown separately in the Schools card above.
Census & demographics
- Census place
- Essex, MD
- County
- Baltimore County · 769,527 people
- City population
- 43,487
- Metro
- Baltimore-Columbia-Towson, MD
- Population (ZIP)
- 43,487
- Household income
- $67,340
- Rent vs Own
- Severe rent burden
- 1757.0
Population outlook (Baltimore County) Hauer SSP2
- Today (2025)
- 885,518 people
- By 2030
- 909,272 · +2.7%
- By 2040
- 951,547 · +7.5%
- By 2050
- 990,955 · +11.9%
- By 2075
- 1,086,411 · +22.7%
- By 2100
- 1,135,078 · +28.2%
Race, ethnicity, and origin ACS 2023
- Neighborhood character
- Diverse neighborhood (Simpson 0.60)
- Race & ethnicity
- White 54% Black 32% Two or more races 7% Hispanic / Latino 7% Asian 1%
- Hispanic origin (detail)
- Mexican 2% Puerto Rican 1% Dominican 1%
- Common ancestry
- Romanian 5% Lithuanian 1% Slovak 1%
- Foreign-born
- 8% · Canada, China
- Languages at home
- 89% English-only · Spanish 6% French/Haitian/Cajun 1%
Political lean MEDSL · Baltimore
- 2024 margin
- Strong D (+24.5) · D 61.0% · R 36.5% · Other 2.5%
- 2008→2024 swing
- +9.9pp toward D · 2008: 14.6pp · 2024: 24.5pp
- All cycles
- 2024: D+24.5 2020: D+27.0 2016: D+17.4 2012: D+16.4 2008: D+14.6
Not yet ingested
- Civics
- —
Market trends
- HPI YoY
- ▼ -232.14%
- Current HPI
- 237.1069
- Rent YoY
- ▲ 1.08%
- Metro
- Baltimore-Columbia-Towson, MD
- State GDP YoY
- ▲ 2.97%
- F500 in state
- 12
Industry mix (Fortune 500 HQ in MD)
| Industry | F500 HQs | Revenue |
|---|---|---|
| Aerospace / Defense | 1 | $71B |
|
||
| Utilities | 1 | $25B |
|
||
| Hotels | 1 | $24B |
|
||
| Consumer Goods | 1 | $7B |
|
||
| Real Estate | 1 | $6B |
|
||
| Chemicals | 1 | $2B |
|
||
Price history
+500.7% since first listed6 events — show timeline
- 2026-06-04 Coming Soon $250,000 BRIGHT MLS
- 2021-04-13 Sold (MLS) $135,000 BRIGHT MLS
- 2021-03-01 Listing Removed — BRIGHT MLS
- 2021-03-01 Listed $135,000 BRIGHT MLS
- 1989-12-15 Sold (Public Records) $75,500 Public Records
- 1977-07-13 Sold (Public Records) $41,615 Public Records
Property tax history
+2.0%/yrLatest (2025): $3,282 · +5.8% YoY. Source: county tax records.
Cash-flow waterfall
monthlySold comps — $/sqft
last 12 mo · ≤1 miLoading sold comps…