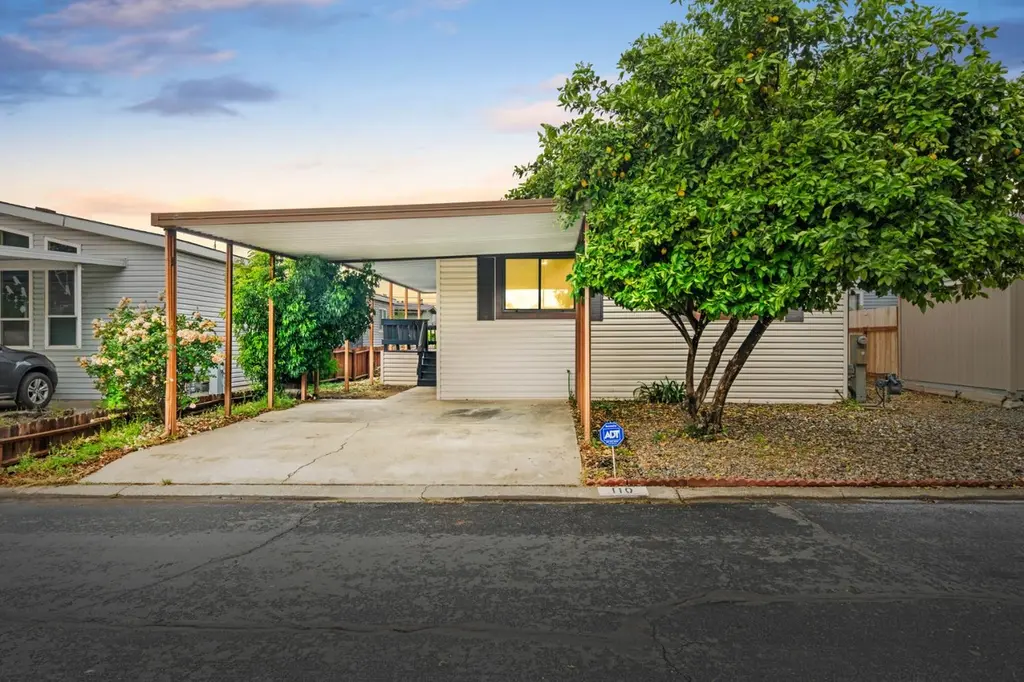
1399 Sacramento Ave #110 · West Sacramento, CA
Flood risk 4/10 · Minor
- FEMA flood zone
- —
- Chance of flooding over 30 yrs
- 0.22%
- Est. flood insurance / yr
- —
Fire risk 1/10 · Minimal
- Est. fire insurance / yr
- $659 – $1,223
Heat risk 7/10 · Major
- Hot days now (above 103°F)
- 7 days/yr
- Hot days in 30 yrs
- 15 days/yr
Wind risk 1/10 · Minimal
- Chance of severe wind over 30 yrs
- —
Air-quality risk 10/10 · Severe
- Unhealthy air days now
- 27 days/yr
- Unhealthy air days in 30 yrs
- 33 days/yr
Risk factors via First Street. Map © Google.
Why this score? — see what drove the B- grade
The composite is a weighted blend of 9 inputs, each scored 0–100. Each bar is that input's sub-score; the figure is the points it added to the 100-point composite (weight × sub-score).
- Cash flow +30.0/30.0
- 1% rule +10.0/10.0
- DSCR +10.0/10.0
- ARV discount +7.5/15.0
- Schools +3.8/10.0
- Livability +3.7/5.0
- Condition / age +2.5/5.0
- Rent growth +1.9/5.0
- Appreciation +0.0/10.0
$169,000
🖨 Deal sheet 📄 Offer letter ✓ Due diligence
Listing remarks
Welcome to West Wind Estates! Located in an ALL age park, this charming home offers one of the lowest space rents in the area. This home has been thoughtfully updated for comfort and style. Recent upgrades include brand New flooring, New comp roof, fresh interior paint, updated appliances and recessed lighting throughout. The large living room provides plenty of space for relaxation or entertaining. The home also comes fully equipped with all appliances, including a washer and dryer. Additional highlights include a walk-in jetted tub for ultimate relaxation and a newer HVAC system to keep you comfortable year-round. Enjoy the inviting community clubhouse and pool, all in a convenient locati
Key facts
- Updated appliances
- New comp roof
- New flooring
Tags
Property features AI
Finance
- Other: Land lease: No (listed land lease amount present but property is not land-leased)
- HOA & community: No association
Exterior
- Parking: Off-street parking; Attached covered parking; Detached parking; Deck parking area; Guest parking available
- Utilities: 220 volts in kitchen; 220 volts in laundry; Public water; Public sewer
- Home design: Manufactured in park (double wide); Built in 1989
- Construction: Vinyl skirting; Shingle/composition roof; BAYSHORE HM make
- Exterior features: Porch awning; Backyard; Regular-shaped lot; Storage shed(s)
Interior
- Kitchen: Free standing gas range; Free standing gas oven; Free standing refrigerator; Hood over range; Dishwasher
- Bedrooms: 3 bedrooms
- Flooring: Tile; Vinyl
- Bathrooms: 2 full bathrooms; Double sinks; Jetted tub; Sunken tub; Tile surfaces; Tub with shower over
- Heating & cooling: Central heating; Central cooling; Ceiling fan(s)
- Interior features: Cathedral/vaulted great room; Pantry cabinet and pantry closet; Dining/family combo and dining/living combo; Covered deck and porch; Pets allowed
- Laundry & utility: Washer and dryer included; Laundry located inside (inside room/area)
Neighborhood map
What this means for you Summary
Snapshot
- This is a 3-bed/2.0-bath manufactured listed at $169k.
Deal economics
- At list price, monthly cash flow is $963 ($12k/yr) — positive.
- The deal already cash-flows at list — no discount required.
- Meets the 1% rule at list price ($3k rent vs $169k).
- Recommended offer: $159k (6.0% below list) — sets the bar for market timing.
Location & tenants
- Location reads 73/100 on livability (#164 in CA) — a middle-class / working-renter tenant base. Strengths: housing A+, commute A, employment A-; Watch: cost of living F.
- Washington Unified (suburban): math 30% / reading 57% proficiency, ranked #197 of 517 in CA (top 38%) — families likely to look elsewhere, expect single-tenant / working-renter base with shorter leases.
- Market conditions: Rents soft (-2.4%/yr); 52 active listings in the ZIP; 8 comparable units currently listed for rent nearby; rentals leasing fast (median 2d on market — plan ~1-2 weeks tenant-placement turnaround); 721 units permitted in Yolo County in 2024 (260 in 5+ unit buildings).
- At $2,698/mo this rent would consume 45% of the median local household income ($72k/yr) (locally 554% of renters already pay >50% of income on rent) — very limited rent-growth headroom before tenants either downsize or default.
Forward outlook
- Local home prices are declining (-3.0%/yr); year-one equity from $1k of loan paydown is wiped out by about $5k of value loss. Plan a longer hold.
- Yolo County population projected at +31% by 2050 — long-run rental-demand tailwind backs the buy-and-hold thesis.
- At projected returns (-3.0% appreciation + 0.0% rent growth), your $47k cash investment doubles in ~6 years — after that, you're playing with house money.
Negotiation context
- It's been on market 78 days — a 6% lower offer ($159k) is reasonable based on typical stale-listing flexibility.
Risks & watch-outs
- Climate carrying-cost: extreme-heat days projected 7→15/yr by 2055 (HVAC capex compounding) — expect insurance premiums to compound above CPI over the hold.
Questions for the listing agent
- It's been on market 78 days. Have you received any prior offers? Is the seller open to a 6% concession, seller financing, or rate buy-down credit?
- Why hasn't it sold? Are there any deal-killer items the seller is aware of (foundation, flood, title, zoning, code violations)?
- Is there a deadline driving the sale (1031 exchange, divorce, estate, relocation)? That informs how much negotiation room exists.
- What's the average days-on-market for RENTAL listings here right now (not sales)? A rising rental-DOM trend means longer vacancies and softer asking-rent achievability than the comps imply.
- What's the recent tenant-quality profile in this submarket — average credit score on applications, eviction rate, late-payment / NSF rate, and stable-employment percentage? A property-management company in the area should have these aggregated.
- How much new for-sale + rental construction is in the pipeline within 1–3 miles? Heavy new supply typically softens prices + rents 12–24 months out; constrained supply supports both.
Investment metrics
- 1% rule
- 1.60% ✓
- Cap rate
- 13.13%
- Cash-on-cash
- 24.43%
- DSCR
- 2.09
- GRM
- 5.2
CMA / ARV
No comps found within radius.
Projected returns pro-forma
-3.0% appreciation · 0.0% rent growth · sell at horizon
- IRR
- 14.3%
- Equity multiple
- 1.55×
- Total profit
- $26,106
- Equity at exit
- $25,198
- IRR
- 20.7%
- Equity multiple
- 2.51×
- Total profit
- $71,350
- Equity at exit
- $14,612
Cash invested: $47,320 (down + closing). Projections, not guarantees.
Landlord ↔ Tenant lean methodology
- Overall (STATE)
- 18 Strongly Tenant-Friendly
- State California
- 18 Strongly Tenant-Friendly · D+13
- County
- — inherits STATE
- City
- — inherits STATE
ZIP-level market 95605
- Rents YoY
- -2.4%
- Active inventory
- 52
- Price-to-rent
- 5.2×
Monthly cashflow live
- Estimated rent
- $2,698 high interval (Pro) →
- Mortgage (P&I)
- −$886
- Tax est. 1.5%
- −$211 /mo · $2,535/yr
- Insurance
- −$70
- HOA
- −$0
- Vacancy / Maint / Mgmt
- −$567
- Net cashflow
- $963
Break-even live
UW: 25.0% down · 7.5% · 30yr · 1.5% tax · 5.0% vac · 8.0% maint · 8.0% mgmt
Financing live
Cash to close
- Down payment
- $42,250
- Closing costs
- $5,070
- Reserves months
- —
- Total cash needed
- —
Loan-product check · same deal, 3 products live
Conventional
25% down · 7.5% · 30yr
- Down + closing
- —
- Monthly P&I
- —
- Monthly cashflow
- —
- DSCR
- —
- Eligible?
- —
Personal DTI + credit; lowest rate.
DSCR
20% down · 8.5% · 30yr
- Down + closing
- —
- Monthly P&I
- —
- Monthly cashflow
- —
- DSCR
- —
- Eligible?
- —
No personal income docs; deal must DSCR.
Hard money
10% down · 12.0% · 12mo
- Down + closing
- —
- Monthly P&I
- —
- Monthly cashflow
- —
- DSCR
- —
- Eligible?
- —
Short-term bridge; refi at stabilization.
Rent comps 8 comps
| Address | Beds | Baths | Sqft | Rent | $/sqft | DOM | Units | Dist |
|---|---|---|---|---|---|---|---|---|
| 709 Solano St West Sacramento, CA | 4.0 | 3.0 | 1500 | $3,000 | $2.00 | 1d | 1 | 0.53mi |
| 500 Douglas St West Sacramento, CA | 3.0 | 1.0–2.0 | 874 | $2,939 | $3.36 | 3d | 22 | 0.86mi |
| 425 Regatta Ln #103 West Sacramento, CA | 3.0 | 2.5 | 1576 | $2,595 | $1.65 | 2d | 1 | 1.18mi |
| 777 5th St West Sacramento, CA | 2.0 | 1.0–2.0 | 878 | $10,000 | $11.38 | 1d | 15 | 1.21mi |
| 2763 River Plaza Dr Sacramento, CA | 1.0–3.0 | 1.0–2.0 | 848 | $2,400 | $2.83 | 1d | 8 | 1.35mi |
| 120 Soaring Hawk Ln Sacramento, CA | 2.0 | 2.0 | 1026 | $2,195 | $2.14 | 16d | 1 | 1.39mi |
| 4 White Lily Ct Sacramento, CA | 3.0 | 2.0 | 1270 | $2,395 | $1.89 | 43d | 1 | 1.42mi |
| 2227 River Plaza Dr Sacramento, CA | 1.0–2.0 | 1.0–2.0 | 890 | $2,220 | $2.49 | 1d | 19 | 1.46mi |
Listing history 16 events
-
2026-06-19statusdays on market $169,000 Active 78 DOM
-
2026-06-18days on market $169,000 Contingent (Show) 77 DOM
-
2026-06-17days on market $169,000 Contingent (Show) 76 DOM
-
2026-06-16days on market $169,000 Contingent (Show) 75 DOM
-
2026-06-15days on market $169,000 Contingent (Show) 74 DOM
-
2026-06-14days on market $169,000 Contingent (Show) 72 DOM
-
2026-06-12days on market $169,000 Contingent (Show) 71 DOM
-
2026-06-09days on market $169,000 Contingent (Show) 68 DOM
-
2026-06-08days on market $169,000 Contingent (Show) 67 DOM
-
2026-06-07days on market $169,000 Contingent (Show) 66 DOM
-
2026-06-07statusdays on market $169,000 Contingent (Show) 65 DOM
-
2026-06-04days on market $169,000 Active 62 DOM
-
2026-06-02days on market $169,000 Active 61 DOM
-
2026-06-01days on market $169,000 Active 60 DOM
-
2026-05-31remarks 699-char remark
-
2026-05-31$169,000 Active 59 DOM
ⓘ Source: listings_history table (triggers on properties + properties_extension) + one-shot
backfill from property_details.listing_events for pre-trigger history.
Climate risk First Street
- Flood 4/10 Moderate 22% chance over 30 yrs
- Wildfire 1/10 Low
- Heat 7/10 Severe 7 d/yr ≥103°F today · 15 d/yr by 30 yrs out
- Wind 1/10 Low
- Air quality 10/10 Extreme 27 unhealthy d/yr today · 33 by 30 yrs out
Nearby sold comps map
Loading sold comps map…
Walkable amenities ~0.75 mi
Loading nearby amenities…
Taxation est. · year 1
- Rental income
- $32,374
- − Mortgage interest
- −$9,467
- − Property taxes
- −$2,535
- − Insurance
- −$845
- − Repairs & maintenance
- −$2,590
- − Management
- −$2,590
- − Depreciation
- −$4,916
- Taxable income
- $9,431
- Est. tax owed @ 24.0%
- −$2,263
- After-tax cash flow
- $9,297/yr
For passive investors: Depreciation is non-cash, so a rental often shows a tax loss while cash-flowing — sheltering income. Rental losses are passive: they offset passive income freely, and up to $25,000/yr can offset ordinary (W-2) income if you actively participate and your MAGI is under $100k (phasing out to $0 by $150k); unused losses carry forward. On sale, claimed depreciation is recaptured at up to 25%, and gains may owe capital-gains tax (a 1031 exchange can defer both). Figures are a year-1 estimate at your 24.0% rate — not tax advice; consult a CPA.
Schools (NCES district)
- District
- Washington Unified
- NCES district ID
- 0641580
- Math proficiency
- 30% ▼ -2.00%
- Reading proficiency
- 57% ▲ 12.00%
- Median HH income
- $55,207
- Composite
- 37.79/100
- National rank
- #4339
- State rank
- #197 of 517 in CA
Livability — West Sacramento
- Score
- 73/100
- State rank
- #164
- US rank
- #5389
Category grades
Schools grade is shown separately in the Schools card above.
Census & demographics
- Census place
- West Sacramento, CA
- County
- Yolo County · 212,115 people
- City population
- 55,039
- Metro
- Sacramento-Roseville-Folsom, CA
- Population (ZIP)
- 14,896
- Household income
- $71,924
- Rent vs Own
- Severe rent burden
- 554.0
Population outlook (Yolo County) Hauer SSP2
- Today (2025)
- 242,183 people
- By 2030
- 257,662 · +6.4%
- By 2040
- 288,050 · +18.9%
- By 2050
- 318,202 · +31.4%
- By 2075
- 392,736 · +62.2%
- By 2100
- 438,150 · +80.9%
Race, ethnicity, and origin ACS 2023
- Neighborhood character
- Diverse neighborhood (Simpson 0.67)
- Race & ethnicity
- Hispanic / Latino 47% White 31% Two or more races 21% Asian 9% Black 5%
- Hispanic origin (detail)
- Mexican 45%
- Common ancestry
- Scotch-Irish 7% Subsaharan African 4% Serbian 1%
- Foreign-born
- 35% · Canada, Vietnam, China
- Languages at home
- 42% English-only · Spanish 35% Russian/Polish/Slavic 14% Other Asian/Pacific 4%
Political lean MEDSL · Yolo
- 2024 margin
- Solid D (+36.2) · D 66.3% · R 30.1% · Other 3.6%
- 2008→2024 swing
- 0.0pp no change · 2008: 36.2pp · 2024: 36.2pp
- All cycles
- 2024: D+36.2 2020: D+41.4 2016: D+42.0 2012: D+33.2 2008: D+36.2
Not yet ingested
- Civics
- —
Market trends
- HPI YoY
- ▼ -214.35%
- Current HPI
- 397.7177
- Rent YoY
- ▼ -2.42%
- Metro
- Sacramento-Roseville-Folsom, CA
- State GDP YoY
- ▲ 3.21%
- F500 in state
- 116
Industry mix (Fortune 500 HQ in CA)
| Industry | F500 HQs | Revenue |
|---|---|---|
| Technology | 27 | $1,492B |
|
||
| Financial Services | 3 | $174B |
|
||
| Retail | 3 | $44B |
|
||
| Insurance | 3 | $26B |
|
||
| Media / Entertainment | 2 | $115B |
|
||
| Pharmaceuticals / Biotech | 2 | $62B |
|
||
Cash-flow waterfall
monthlySold comps — $/sqft
last 12 mo · ≤1 miLoading sold comps…