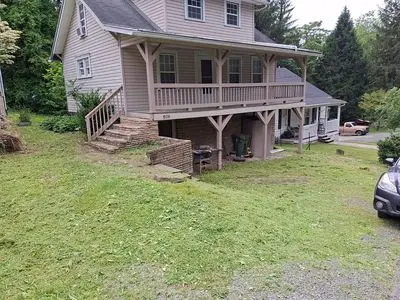
828 Johnson Ave · Morgantown, WV
Flood risk 1/10 · Minimal
- FEMA flood zone
- X (unshaded)
- Chance of flooding over 30 yrs
- 0.0%
- Est. flood insurance / yr
- $473 – $860
Fire risk 1/10 · Minimal
- Est. fire insurance / yr
- $787 – $1,461
Heat risk 3/10 · Minor
- Hot days now (above 97°F)
- 7 days/yr
- Hot days in 30 yrs
- 17 days/yr
Wind risk 1/10 · Minimal
- Chance of severe wind over 30 yrs
- —
Air-quality risk 2/10 · Minimal
- Unhealthy air days now
- 1 days/yr
- Unhealthy air days in 30 yrs
- 2 days/yr
Risk factors via First Street. Map © Google.
Why this score? — see what drove the B- grade
The composite is a weighted blend of 9 inputs, each scored 0–100. Each bar is that input's sub-score; the figure is the points it added to the 100-point composite (weight × sub-score).
- Cash flow +24.6/30.0
- ARV discount +15.0/15.0
- DSCR +8.0/10.0
- 1% rule +6.0/10.0
- Livability +4.2/5.0
- Schools +4.1/10.0
- Rent growth +3.9/5.0
- Condition / age +2.5/5.0
- Appreciation +0.0/10.0
$119,900
🖨 Deal sheet (PDF) 📄 Offer letter ✓ Due diligence
Listing remarks
Cutie pie Fixer upper Single Family Home- Great area! 3 bd | 1 ba | 1,078 sqft. | APN: 31-13- 25-0397.0000 ? Great curb appeal with attractive street presence ? Prime Morgantown location ? Minutes from West Virginia University ? Near Ruby Memorial Hospital & amp; Health Sciences Campus ? Convenient access to shopping, dining, & amp; major employers ? Attractive neighborhood with established homes ? Multiple exit strategies: Flip, Rental, or Live in it ! Interior cosmetic needed
Key facts
- Built 1945
- Listed 9 days
Tags
Property features AI
Finance
- Other: No additional amenities provided
- Financial info: No financial details provided
- HOA & community: HOA or community fee details not provided
Exterior
- Parking: Parking details not provided
- Security: Security details not provided
- Utilities: Utility details not provided
- Home design: Single-family property (year built 1945); Living area of approximately 1,078 (unit not shown)
- Construction: Built in 1945
- Exterior features: Located in the Woodburn subdivision
Interior
- Kitchen: Kitchen details not provided
- Bedrooms: Bedroom count not specified
- Flooring: Flooring details not provided
- Bathrooms: Bathroom count not specified
- Heating & cooling: Heating and cooling details not provided
- Interior features: No interior feature details provided
- Laundry & utility: Laundry and utility details not provided
Neighborhood map
What this means for you Summary
Snapshot
- This is a 3-bed/1.0-bath single-family listed at $120k.
Deal economics
- At list price, monthly cash flow is $249 ($3k/yr) — positive.
- The deal already cash-flows at list — no discount required.
- Meets the 1% rule at list price ($1k rent vs $120k).
- Cap rate 8.8% vs local median 3.0% in Morgantown — top-decile yield for the area; either an underpriced asset or a hidden risk that comps aren't pricing in. Stress-test before assuming the spread holds.
Location & tenants
- Location reads 84/100 on livability (#5 in WV, #674 nationally) — a professional / high-income tenant draw. Strengths: amenities A+, commute A+, cost of living A+; Watch: employment D-.
- Monongalia County Schools (urban): math 45% / reading 53% proficiency, ranked #1 of 55 in WV (top 2%) — families likely to look elsewhere, expect single-tenant / working-renter base with shorter leases.
- Zoned schools: Eastwood Elementary School (math 45% / reading 47%, grade D-, #68 of 377 statewide, top 18%, 586 students, 0% FRL); Suncrest Middle School (math 46% / reading 57%, grade C, #4 of 109 statewide, top 3%, 501 students, 0% FRL); Morgantown High School (math 49% / reading 73%, grade C+, #2 of 110 statewide, top 1%, 1,859 students, 0% FRL) — zoned schools average 0% FRL vs 32% district-wide (32 pts lower); this property's tenant base skews higher-income than the district average.
- Market conditions: Rents rising fast (+5.5%/yr); 123 active listings in the ZIP; 23 units permitted in Monongalia County in 2024 (15 in 5+ unit buildings).
- This rent runs 35% of the median local income ($46k/yr) — at the standard rent-burdened threshold; future hikes will face affordability resistance.
Forward outlook
- Local home prices are declining (-3.0%/yr); year-one equity from $829 of loan paydown is wiped out by about $4k of value loss. Plan a longer hold.
- Monongalia County population projected at +38% by 2050 — long-run rental-demand tailwind backs the buy-and-hold thesis.
- At projected returns (-3.0% appreciation + 5.5% rent growth), your $34k cash investment doubles in ~9 years — after that, you're playing with house money.
Negotiation context
- Only 9 days on market — expect competitive offers; lowballing is unlikely to land.
Risks & watch-outs
- Watch-outs: built in 1945 — expect roof / HVAC / electrical / plumbing capex.
Questions for the listing agent
- Built in 1945 — when were the roof, HVAC, electrical panel, plumbing, and water heater last replaced?
- Is there a deadline driving the sale (1031 exchange, divorce, estate, relocation)? That informs how much negotiation room exists.
- Schools are D-rated, which usually means shorter tenancies and higher turnover. Who's the typical renter profile here, and what's been the actual vacancy rate?
- What's the average days-on-market for RENTAL listings here right now (not sales)? A rising rental-DOM trend means longer vacancies and softer asking-rent achievability than the comps imply.
- What's the recent tenant-quality profile in this submarket — average credit score on applications, eviction rate, late-payment / NSF rate, and stable-employment percentage? A property-management company in the area should have these aggregated.
- How much new for-sale + rental construction is in the pipeline within 1–3 miles? Heavy new supply typically softens prices + rents 12–24 months out; constrained supply supports both.
Investment metrics
- 1% rule
- 1.10% ✓
- Cap rate
- 8.78%
- Cash-on-cash
- 8.90%
- DSCR
- 1.40
- GRM
- 7.6
CMA / ARV
- ARV (on-the-fly)
- $202,664
- Comps found
- 12
Show comp detail 12 sales within ~0.75 mi
| Address | Dist | Beds/Ba | Sqft | Sold | Price | $/sf | Match |
|---|---|---|---|---|---|---|---|
| 814 Clinton | 0.33mi | 3/2.0 | 1,104 (+2%) | 1mo | $170,000 | $154 | 76 |
| 913 Ridgeway Ave | 0.20mi | 3/1.0 | 1,200 (+11%) | 10mo | $215,000 | $179 | 63 |
| 1021 Denver | 0.32mi | 3/2.0 | 956 (-11%) | 0mo | $180,000 | $188 | 62 |
| 1045 Charles | 0.04mi | 3/2.0 | 1,221 (+13%) | 15mo | $42,000 | $34 | 60 |
| 709 Monongalia Ave | 0.41mi | 3/1.0 | 946 (-12%) | 4mo | $210,000 | $222 | 58 |
| 924 Garrison | 0.30mi | 2/1.0 (-1) | 960 (-11%) | 6mo | $190,000 | $198 | 58 |
| 1289 Denver | 0.44mi | 2/1.0 (-1) | 1,024 (-5%) | 11mo | $158,000 | $154 | 57 |
| 1101 Sabraton Ave | 0.25mi | 3/2.0 | 1,190 (+10%) | 13mo | $236,000 | $198 | 56 |
| 909 Naomi | 0.42mi | 2/1.0 (-1) | 1,020 (-5%) | 13mo | $125,000 | $123 | 55 |
| 227 Darst St | 0.35mi | 2/1.5 (-1) | 1,196 (+11%) | 5mo | $202,500 | $169 | 54 |
| 700 Monongalia Ave | 0.42mi | 2/1.0 (-1) | 1,012 (-6%) | 14mo | $205,000 | $203 | 53 |
| 1263 Denver | 0.42mi | 2/1.0 (-1) | 936 (-13%) | 5mo | $220,000 | $235 | 49 |
Match score weights: distance 35% · size 25% · config 20% · recency 20%. Top-matched comps best support the ARV.
Projected returns pro-forma
-3.0% appreciation · 5.46% rent growth · sell at horizon
- IRR
- -0.2%
- Equity multiple
- 0.99×
- Total profit
- $-230
- Equity at exit
- $17,877
- IRR
- 11.8%
- Equity multiple
- 2.03×
- Total profit
- $34,656
- Equity at exit
- $10,367
Cash invested: $33,572 (down + closing). Projections, not guarantees.
Landlord ↔ Tenant lean methodology
- Overall (STATE)
- 83 Strongly Landlord-Friendly
- State West Virginia
- 83 Strongly Landlord-Friendly · R+22
- County
- — inherits STATE
- City
- — inherits STATE
ZIP-level market 26505
- Home prices YoY
- -31.9%
- Rents YoY
- 5.5%
- Active inventory
- 123
- Price-to-rent
- 7.6×
Monthly cashflow live
- Estimated rent
- $1,320 medium interval (Pro) →
- Mortgage (P&I)
- −$629
- Tax from tax record
- −$115 /mo · $1,384/yr
- Insurance
- −$50
- HOA
- −$0
- Vacancy / Maint / Mgmt
- −$277
- Net cashflow
- $249
Break-even live
Sensitivity live
| Price | -10% $317 | -5% $283 | +0% $249 | +5% $215 | +10% $181 |
|---|---|---|---|---|---|
| Rent | -10% $145 | -5% $197 | +0% $249 | +5% $301 | +10% $353 |
| Rate | -1.0pp $309 | -0.5pp $279 | base $249 | +0.5pp $218 | +1.0pp $186 |
UW: 25.0% down · 7.5% · 30yr · 1.5% tax · 5.0% vac · 8.0% maint · 8.0% mgmt
Financing live
Cash to close
- Down payment
- $29,975
- Closing costs
- $3,597
- Reserves months
- —
- Total cash needed
- —
Loan-product check · same deal, 3 products live
Conventional
25% down · 7.5% · 30yr
- Down + closing
- —
- Monthly P&I
- —
- Monthly cashflow
- —
- DSCR
- —
- Eligible?
- —
Personal DTI + credit; lowest rate.
DSCR
20% down · 8.5% · 30yr
- Down + closing
- —
- Monthly P&I
- —
- Monthly cashflow
- —
- DSCR
- —
- Eligible?
- —
No personal income docs; deal must DSCR.
Hard money
10% down · 12.0% · 12mo
- Down + closing
- —
- Monthly P&I
- —
- Monthly cashflow
- —
- DSCR
- —
- Eligible?
- —
Short-term bridge; refi at stabilization.
Listing history 8 events
-
2026-06-21days on market $119,900 Active 9 DOM
-
2026-06-19days on market $119,900 Active 7 DOM
-
2026-06-18days on market $119,900 Active 6 DOM
-
2026-06-17days on market $119,900 Active 5 DOM
-
2026-06-16days on market $119,900 Active 4 DOM
-
2026-06-15days on market $119,900 Active 3 DOM
-
2026-06-13remarks 490-char remark
-
2026-06-13$119,900 Active 1 DOM
ⓘ Source: listings_history table (triggers on properties + properties_extension) + one-shot
backfill from property_details.listing_events for pre-trigger history.
Tax reassessment forecast WV · Resets to sale price
- Current annual tax
- $1,384 · $115/mo
- Projected year-2 tax
- $1,384 · $115/mo
- Expected delta
- $0/yr ($0/mo · 0.0%)
ⓘ Screening estimate from a state-policy table — verify with the county assessor before closing.
Climate risk First Street
- Flood 1/10 Low FEMA zone X (unshaded) · 0% chance over 30 yrs
- Wildfire 1/10 Low
- Heat 3/10 Moderate 7 d/yr ≥97°F today · 17 d/yr by 30 yrs out
- Wind 1/10 Low
- Air quality 2/10 Low 1 unhealthy d/yr today · 2 by 30 yrs out
Nearby sold comps map
Loading sold comps map…
Walkable amenities ~0.75 mi
Loading nearby amenities…
Taxation est. · year 1
- Rental income
- $15,843
- − Mortgage interest
- −$6,716
- − Property taxes
- −$1,384
- − Insurance
- −$600
- − Repairs & maintenance
- −$1,267
- − Management
- −$1,267
- − Depreciation
- −$3,488
- Taxable income
- $1,120
- Est. tax owed @ 24.0%
- −$269
- After-tax cash flow
- $2,718/yr
For passive investors: Depreciation is non-cash, so a rental often shows a tax loss while cash-flowing — sheltering income. Rental losses are passive: they offset passive income freely, and up to $25,000/yr can offset ordinary (W-2) income if you actively participate and your MAGI is under $100k (phasing out to $0 by $150k); unused losses carry forward. On sale, claimed depreciation is recaptured at up to 25%, and gains may owe capital-gains tax (a 1031 exchange can defer both). Figures are a year-1 estimate at your 24.0% rate — not tax advice; consult a CPA.
Schools (NCES district)
- District
- Monongalia County Schools
- NCES district ID
- 5400930
- Math proficiency
- 45% ▼ -5.00%
- Reading proficiency
- 53% ▼ -2.00%
- Median HH income
- $43,820
- Composite
- 41.34/100
- National rank
- #3503
- State rank
- #1 of 55 in WV
Livability — Morgantown
- Score
- 84/100
- State rank
- #5
- US rank
- #674
Category grades
Schools grade is shown separately in the Schools card above.
Census & demographics
- Census place
- Morgantown, WV
- County
- Monongalia County · 97,252 people
- City population
- 97,252
- Metro
- Morgantown, WV
- Population (ZIP)
- 37,492
- Household income
- $45,536
- Rent vs Own
- Severe rent burden
- 3256.0
Population outlook (Monongalia County) Hauer SSP2
- Today (2025)
- 122,188 people
- By 2030
- 131,536 · +7.7%
- By 2040
- 149,777 · +22.6%
- By 2050
- 168,245 · +37.7%
- By 2075
- 207,979 · +70.2%
- By 2100
- 239,430 · +96.0%
Race, ethnicity, and origin ACS 2023
- Neighborhood character
- Predominantly White (82%)
- Race & ethnicity
- White 82% Asian 6% Two or more races 5% Black 4% Hispanic / Latino 3%
- Common ancestry
- Romanian 5% Slovak 3% Italian 2%
- Foreign-born
- 10% · China, Canada, Vietnam
- Languages at home
- 88% English-only · Arabic 3% Other Indo-European 2% Chinese 2%
Political lean MEDSL · Monongalia
- 2024 margin
- Toss-up / Even · D 46.5% · R 50.9% · Other 2.7%
- 2008→2024 swing
- -8.2pp toward R · 2008: 3.9pp · 2024: -4.4pp
- All cycles
- 2024: R+4.4 2020: R+1.2 2016: R+10.4 2012: R+9.7 2008: D+3.9
Not yet ingested
- Civics
- —
Market trends
- HPI YoY
- ▼ -100.05%
- Current HPI
- 213.749
- Rent YoY
- ▲ 5.46%
- Metro
- Morgantown, WV
- State GDP YoY
- —
- F500 in state
- 0
Price history
1 event — show timeline
- 2026-06-13 Listed $119,900 FSBO.com
Property tax history
+9.2%/yrLatest (2025): $1,384 · +0.2% YoY. Source: county tax records.
Cash-flow waterfall
monthlySold comps — $/sqft
last 12 mo · ≤1 miLoading sold comps…