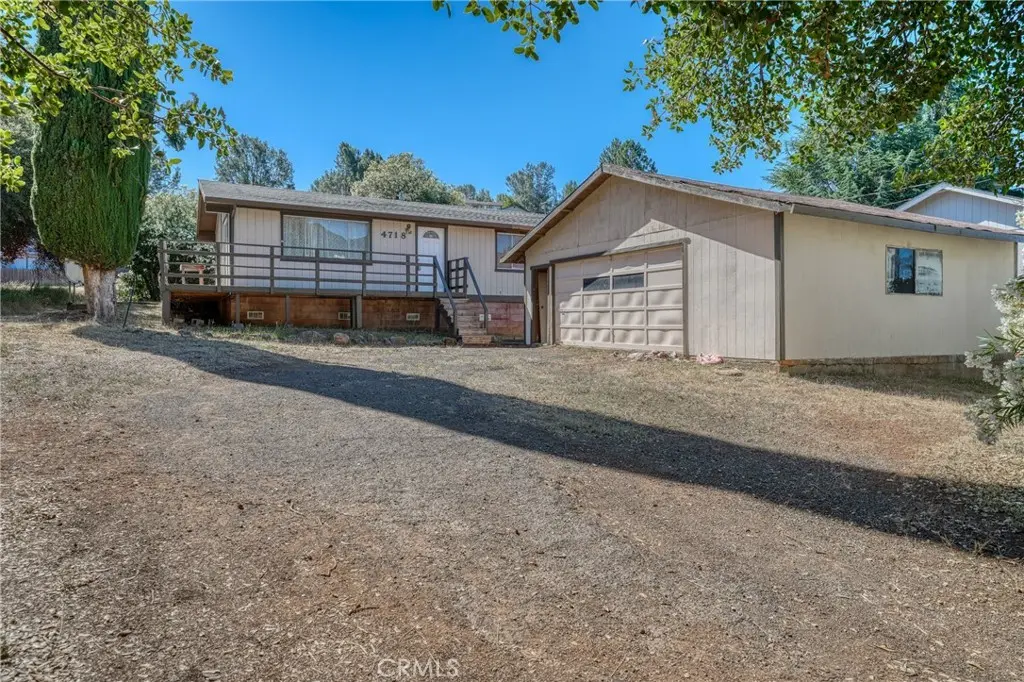
4718 Hawaina Way · Clearlake Riviera, CA
Flood risk 1/10 · Minimal
- FEMA flood zone
- X (unshaded)
- Chance of flooding over 30 yrs
- 0.0%
- Est. flood insurance / yr
- $507 – $1,088
Fire risk 9/10 · Severe
- Est. fire insurance / yr
- $659 – $1,223
Heat risk 5/10 · Moderate
- Hot days now (above 100°F)
- 7 days/yr
- Hot days in 30 yrs
- 14 days/yr
Wind risk 1/10 · Minimal
- Chance of severe wind over 30 yrs
- —
Air-quality risk 10/10 · Severe
- Unhealthy air days now
- 32 days/yr
- Unhealthy air days in 30 yrs
- 34 days/yr
Risk factors via First Street. Map © Google.
Why this score? — see what drove the C grade
The composite is a weighted blend of 9 inputs, each scored 0–100. Each bar is that input's sub-score; the figure is the points it added to the 100-point composite (weight × sub-score).
- Cash flow +20.2/30.0
- ARV discount +15.0/15.0
- DSCR +6.4/10.0
- 1% rule +4.3/10.0
- Livability +2.9/5.0
- Rent growth +2.5/5.0
- Schools +2.5/10.0
- Condition / age +2.5/5.0
- Appreciation +0.0/10.0
$225,000
🖨 Deal sheet (PDF) 📄 Offer letter ✓ Due diligence
Listing remarks MLS
6TH FAIRWAY, FIXER UPPER, NEEDS STRUCTURAL PEST CONTROL WORK, TOTAL COSMETICS INSIDE & OUTSIDE, NEARLY LEVEL LOT, 28X24 OVERSIZE GAR
Key facts
- Back yard access
- Deck access
- Close to lake
Tags
Property features AI
Finance
- Other: Single dwelling unit (no common walls); Total of 1 unit on the property
- HOA & community: Part of Kelseyville Riviera Community Association; Association fee $142 annually; Community features: Foothills
Exterior
- Parking: Garage parking (1 space); Total parking for 1 vehicle
- Utilities: Public sewer; District/public water; Propane; Electricity connected
- Home design: House; Single-story; Entry at main level
- Construction: Concrete block foundation; Built (year per public records)
- Exterior features: Patio (has patio); Gentle slope lot; Has view
Interior
- Kitchen: Refrigerator; Electric range; Dishwasher; Garbage disposal; Electric water heater; Casual eating area
- Bedrooms: 3 bedrooms on the main level; Primary bedroom
- Flooring: Carpet; Laminate
- Bathrooms: 2 full bathrooms with shower and shower-in-tub options
- Heating & cooling: Central cooling; Oil and propane heating
- Interior features: Living room with attached deck; One-level living
- Laundry & utility: Washer hookup; Electric dryer hookup; Laundry located in the garage
Neighborhood map
What this means for you Summary
Snapshot
- This is a 3-bed/1.5-bath single-family listed at $225k.
Deal economics
- At list price, monthly cash flow is $283 ($3k/yr) — positive.
- The deal already cash-flows at list — no discount required.
- To meet the 1% rule (rent ≥ 1% of price), the offer needs to be $210k (6.7% below list).
- Recommended offer: $210k (6.7% below list) — sets the bar for 1% rule.
- Cap rate 7.8% vs local median 4.2% in Clearlake Riviera — top-decile yield for the area; either an underpriced asset or a hidden risk that comps aren't pricing in. Stress-test before assuming the spread holds.
Location & tenants
- Location reads 58/100 on livability (#690 in CA) — a working-class tenant base; expect higher turnover. Strengths: housing A+; Watch: crime C-, health & safety C-, amenities F.
- Kelseyville Unified (town): math 18% / reading 33% proficiency, ranked #1,150 of 1,400 in CA (top 82%) — low school quality limits family demand, transient renter base, plan for 1-2y turnover; 68% free/reduced lunch — lower-income household profile, screen leases tightly.
- Zoned schools: Riviera Elementary (223 students, 60% FRL); Mountain Vista Middle (375 students, 76% FRL); Kelseyville High (math 8% / reading 42%, grade F, #811 of 1,170 statewide, top 70%, 540 students, 64% FRL) — zoned schools at 67% FRL track the district average.
- Market conditions: 273 active listings in the ZIP; 1 comparable units currently listed for rent nearby; 107 units permitted in Lake County in 2024 (40 in 5+ unit buildings).
- This rent runs 40% of the median local income ($63k/yr) — at the standard rent-burdened threshold; future hikes will face affordability resistance.
Forward outlook
- Local home prices are declining (-3.0%/yr); year-one equity from $2k of loan paydown is wiped out by about $7k of value loss. Plan a longer hold.
- Lake County population projected at -15% by 2050 — secular population decline; favor cash flow + early exit over multi-decade hold.
Negotiation context
- Only 6 days on market — expect competitive offers; lowballing is unlikely to land.
- 2 sale attempts since 26y ago with the ask held roughly flat each time — persistent listings suggest the price (not the market) is what's stuck; bring a comps-based counter.
- Current owner paid $65k; list at $225k implies a 246% gain — meaningful room to come down on a strong offer.
Risks & watch-outs
- Climate carrying-cost: severe wildfire risk; extreme-heat days projected 7→14/yr by 2055 (HVAC capex compounding) — expect insurance premiums to compound above CPI over the hold.
Questions for the listing agent
- Built in 1972 — when were the roof, HVAC, electrical panel, plumbing, and water heater last replaced?
- What does the HOA fee cover, when was the last increase, and are there any pending special assessments or reserve-fund shortfalls?
- Is there a deadline driving the sale (1031 exchange, divorce, estate, relocation)? That informs how much negotiation room exists.
- Schools are F-rated, which usually means shorter tenancies and higher turnover. Who's the typical renter profile here, and what's been the actual vacancy rate?
- What's the average days-on-market for RENTAL listings here right now (not sales)? A rising rental-DOM trend means longer vacancies and softer asking-rent achievability than the comps imply.
- What's the recent tenant-quality profile in this submarket — average credit score on applications, eviction rate, late-payment / NSF rate, and stable-employment percentage? A property-management company in the area should have these aggregated.
- How much new for-sale + rental construction is in the pipeline within 1–3 miles? Heavy new supply typically softens prices + rents 12–24 months out; constrained supply supports both.
Investment metrics
- 1% rule
- 0.93% ✗
- Cap rate
- 7.80%
- Cash-on-cash
- 5.38%
- DSCR
- 1.24
- GRM
- 8.9
CMA / ARV
- ARV (on-the-fly)
- $313,344
- Comps found
- 12
Show comp detail 12 sales within ~0.75 mi
| Address | Dist | Beds/Ba | Sqft | Sold | Price | $/sf | Match |
|---|---|---|---|---|---|---|---|
| 4672 Hawaina | 0.21mi | 2/2.0 (-1) | 1,232 (+7%) | 2mo | $320,000 | $260 | 70 |
| 10431 Edgewater Dr | 0.35mi | 2/2.0 (-1) | 1,159 (+1%) | 10mo | $325,000 | $280 | 67 |
| 10695 Edgewater | 0.32mi | 2/1.5 (-1) | 1,093 (-5%) | 9mo | $190,000 | $174 | 64 |
| 10305 Hok Has Ha | 0.37mi | 3/2.0 | 1,300 (+13%) | 5mo | $340,000 | $262 | 56 |
| 10869 Northslope Dr | 0.44mi | 2/2.0 (-1) | 1,120 (-3%) | 20mo | $340,000 | $304 | 51 |
| 10706 Edgewater Dr | 0.28mi | 2/2.0 (-1) | 1,310 (+14%) | 9mo | $310,000 | $237 | 50 |
| 10818 Skyview Dr | 0.53mi | 2/2.0 (-1) | 1,260 (+9%) | 4mo | $400,000 | $317 | 49 |
| 10469 Fairway Pl | 0.23mi | 2/1.0 (-1) | 1,008 (-12%) | 19mo | $270,000 | $268 | 46 |
| 10091 Emerald Dr | 0.66mi | 2/2.0 (-1) | 1,065 (-8%) | 9mo | $340,000 | $319 | 42 |
| 4524 Crystal Cv | 0.49mi | 2/2.0 (-1) | 1,300 (+13%) | 13mo | $385,000 | $296 | 38 |
| 5294 Bel Air W | 0.72mi | 3/2.0 | 1,310 (+14%) | 6mo | $319,000 | $244 | 36 |
| 9731 Sequoia Rd | 0.70mi | 3/2.0 | 1,280 (+11%) | 20mo | $348,000 | $272 | 30 |
Match score weights: distance 35% · size 25% · config 20% · recency 20%. Top-matched comps best support the ARV.
Projected returns pro-forma
-3.0% appreciation · 3.0% rent growth · sell at horizon
- IRR
- -8.0%
- Equity multiple
- 0.71×
- Total profit
- $-18,543
- Equity at exit
- $33,548
- IRR
- 1.5%
- Equity multiple
- 1.11×
- Total profit
- $6,707
- Equity at exit
- $19,454
Cash invested: $63,000 (down + closing). Projections, not guarantees.
Landlord ↔ Tenant lean methodology
- Overall (STATE)
- 18 Strongly Tenant-Friendly
- State California
- 18 Strongly Tenant-Friendly · D+13
- County
- — inherits STATE
- City
- — inherits STATE
ZIP-level market 95451
- Active inventory
- 273
- Price-to-rent
- 8.9×
Monthly cashflow live
- Estimated rent
- $2,100 medium interval (Pro) →
- Mortgage (P&I)
- −$1,180
- Tax from tax record
- −$91 /mo · $1,089/yr
- Insurance
- −$94
- HOA
- −$12
- Lot rent
- −$0
- Vacancy / Maint / Mgmt
- −$441
- Net cashflow
- $283
Break-even live
Sensitivity live
| Price | -10% $410 | -5% $346 | +0% $283 | +5% $219 | +10% $155 |
|---|---|---|---|---|---|
| Rent | -10% $117 | -5% $200 | +0% $283 | +5% $365 | +10% $448 |
| Rate | -1.0pp $396 | -0.5pp $340 | base $283 | +0.5pp $224 | +1.0pp $165 |
UW: 25.0% down · 7.5% · 30yr · 1.5% tax · 5.0% vac · 8.0% maint · 8.0% mgmt
Financing live
Cash to close
- Down payment
- $56,250
- Closing costs
- $6,750
- Reserves months
- —
- Total cash needed
- —
Loan-product check · same deal, 3 products live
Conventional
25% down · 7.5% · 30yr
- Down + closing
- —
- Monthly P&I
- —
- Monthly cashflow
- —
- DSCR
- —
- Eligible?
- —
Personal DTI + credit; lowest rate.
DSCR
20% down · 8.5% · 30yr
- Down + closing
- —
- Monthly P&I
- —
- Monthly cashflow
- —
- DSCR
- —
- Eligible?
- —
No personal income docs; deal must DSCR.
Hard money
10% down · 12.0% · 12mo
- Down + closing
- —
- Monthly P&I
- —
- Monthly cashflow
- —
- DSCR
- —
- Eligible?
- —
Short-term bridge; refi at stabilization.
Rent comps 1 comps
| Address | Beds | Baths | Sqft | Rent | $/sqft | DOM | Units | Dist |
|---|---|---|---|---|---|---|---|---|
| 10340 Hok Has Ha Ln Unit B Kelseyville, CA | 2.0 | 2.0 | 1144 | $1,550 | $1.35 | 46d | 1 | 0.38mi |
HOA detail
- Monthly dues
- $12 · $144/yr
Listing history 6 events
-
2026-06-22days on market $225,000 Active 6 DOM
-
2026-06-21days on market $225,000 Active 5 DOM
-
2026-06-19days on market $225,000 Active 3 DOM
-
2026-06-18days on market $225,000 Active 2 DOM
-
2026-06-17remarks 606-char remark
-
2026-06-17$225,000 Active 1 DOM
ⓘ Source: listings_history table (triggers on properties + properties_extension) + one-shot
backfill from property_details.listing_events for pre-trigger history.
Tax reassessment forecast CA · Resets to sale price
- Current annual tax
- $1,089 · $91/mo
- Projected year-2 tax
- $1,710 · $142/mo
- Expected delta
- +$621/yr (+$52/mo · 57.0%)
ⓘ Screening estimate from a state-policy table — verify with the county assessor before closing.
Climate risk First Street
- Flood 1/10 Low FEMA zone X (unshaded) · 0% chance over 30 yrs
- Wildfire 9/10 Extreme
- Heat 5/10 Major 7 d/yr ≥100°F today · 14 d/yr by 30 yrs out
- Wind 1/10 Low
- Air quality 10/10 Extreme 32 unhealthy d/yr today · 34 by 30 yrs out
Nearby sold comps map
Loading sold comps map…
Walkable amenities ~0.75 mi
Loading nearby amenities…
Taxation est. · year 1
- Rental income
- $25,199
- − Mortgage interest
- −$12,603
- − Property taxes
- −$1,089
- − Insurance
- −$1,125
- − Repairs & maintenance
- −$2,016
- − Management
- −$2,016
- − HOA
- −$144
- − Depreciation
- −$6,545
- Taxable loss
- −$339
- Est. tax savings @ 24.0%
- +$81
- After-tax cash flow
- $3,472/yr
For passive investors: Depreciation is non-cash, so a rental often shows a tax loss while cash-flowing — sheltering income. Rental losses are passive: they offset passive income freely, and up to $25,000/yr can offset ordinary (W-2) income if you actively participate and your MAGI is under $100k (phasing out to $0 by $150k); unused losses carry forward. On sale, claimed depreciation is recaptured at up to 25%, and gains may owe capital-gains tax (a 1031 exchange can defer both). Figures are a year-1 estimate at your 24.0% rate — not tax advice; consult a CPA.
Schools (NCES district)
- District
- Kelseyville Unified
- NCES district ID
- 0619320
- Math proficiency
- 18% ▼ -1.00%
- Reading proficiency
- 33% ▲ 4.00%
- Median HH income
- $47,210
- Composite
- 25.19/100
- National rank
- #12920
- State rank
- #1150 of 1400 in CA
Livability — Clearlake Riviera
- Score
- 58/100
- State rank
- #690
- US rank
- #20956
Category grades
Schools grade is shown separately in the Schools card above.
Census & demographics
- Census place
- Clearlake Riviera, CA
- County
- Lake County · 24,333 people
- Metro
- Clearlake, CA
- Population (ZIP)
- 12,592
- Household income
- $62,568
- Rent vs Own
- Severe rent burden
- 194.0
Population outlook (Lake County) Hauer SSP2
- Today (2025)
- 62,396 people
- By 2030
- 60,626 · -2.8%
- By 2040
- 56,453 · -9.5%
- By 2050
- 53,054 · -15.0%
- By 2075
- 47,663 · -23.6%
- By 2100
- 41,804 · -33.0%
Race, ethnicity, and origin ACS 2023
- Neighborhood character
- Majority White (57%)
- Race & ethnicity
- White 57% Hispanic / Latino 38% Two or more races 11% Black 1%
- Hispanic origin (detail)
- Mexican 35%
- Common ancestry
- Russian 3% Slovak 3% Italian 2%
- Foreign-born
- 14% · Canada
- Languages at home
- 71% English-only · Spanish 28% German/W. Germanic 1%
Political lean MEDSL · Lake
- 2024 margin
- Toss-up / Even · D 47.8% · R 49.2% · Other 3.0%
- 2008→2024 swing
- -20.6pp toward R · 2008: 19.3pp · 2024: -1.4pp
- All cycles
- 2024: R+1.4 2020: D+6.3 2016: D+3.7 2012: D+16.5 2008: D+19.3
Not yet ingested
- Civics
- —
Market trends
- HPI YoY
- ▼ -158.45%
- Current HPI
- 168.6995
- Rent YoY
- —
- Metro
- Clearlake, CA
- State GDP YoY
- ▲ 3.21%
- F500 in state
- 116
Industry mix (Fortune 500 HQ in CA)
| Industry | F500 HQs | Revenue |
|---|---|---|
| Technology | 27 | $1,492B |
|
||
| Financial Services | 3 | $174B |
|
||
| Retail | 3 | $44B |
|
||
| Insurance | 3 | $26B |
|
||
| Media / Entertainment | 2 | $115B |
|
||
| Pharmaceuticals / Biotech | 2 | $62B |
|
||
Price history
+181.6% since first listed4 events — show timeline
- 2026-06-16 Listed $225,000 CRMLS
- 2000-09-29 Sold (Public Records) $65,000 Public Records
- 2000-09-29 Sold (MLS) $65,000 CRMLS
- 2000-08-07 Listed $79,900 CRMLS
Property tax history
+2.0%/yrLatest (2025): $1,089 · +1.7% YoY. Source: county tax records.
Cash-flow waterfall
monthlySold comps — $/sqft
last 12 mo · ≤1 miLoading sold comps…