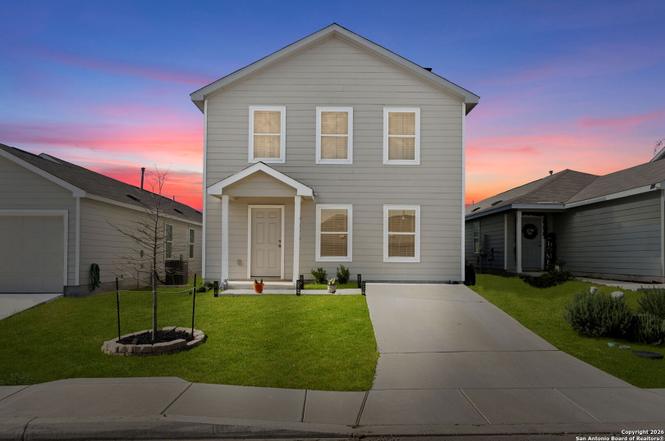
7323 Donkey Vly · San Antonio, TX
Flood risk 1/10 · Minimal
- FEMA flood zone
- X (unshaded)
- Chance of flooding over 30 yrs
- 0.0%
- Est. flood insurance / yr
- $507 – $1,088
Fire risk 5/10 · Moderate
- Est. fire insurance / yr
- $1,222 – $2,270
Heat risk 8/10 · Major
- Hot days now (above 109°F)
- 7 days/yr
- Hot days in 30 yrs
- 22 days/yr
Wind risk 8/10 · Major
- Chance of severe wind over 30 yrs
- 80.0%
Air-quality risk 2/10 · Minimal
- Unhealthy air days now
- 0 days/yr
- Unhealthy air days in 30 yrs
- 1 days/yr
Risk factors via First Street. Map © Google.
Why this score? — see what drove the C- grade
The composite is a weighted blend of 9 inputs, each scored 0–100. Each bar is that input's sub-score; the figure is the points it added to the 100-point composite (weight × sub-score).
- ARV discount +13.2/15.0
- Cash flow +12.7/30.0
- Appreciation +5.0/10.0
- Schools +4.4/10.0
- Livability +4.0/5.0
- Condition / age +4.0/5.0
- DSCR +3.8/10.0
- 1% rule +3.4/10.0
- Rent growth +2.1/5.0
$204,900
🖨 Deal sheet 📄 Offer letter ✓ Due diligence
Listing remarks MLS
Price drop to $204,900. Seller is contributing $5K in closing costs. Save on your CPS energy bills with SOLAR PANELS THAT CONVEY WITH PROPERTY. PAID OFF BY OWNERS. Located in The Silos off Hwy 90 and Hwy 211 this 4 bedroom, 2 bath Lennar home was built in May, 2023 and shows like brand new. With 1880 square feet of living space there is plenty of room for the entire family. The master bedroom is downstairs, large living room and an updated laundry room. The kitchen has gas cooking, stainless steel appliances, granite countertops.
Key facts
- Gas cooking
- Solar panels
- Granite countertops
Tags
Neighborhood map
What this means for you Summary
Snapshot
- This is a 3-bed/2.5-bath single-family listed at $205k. Condition is rated good.
Deal economics
- At list price, monthly cash flow is $-21 ($-255/yr) — negative.
- To cash-flow at today's rent, offer at most $201k (1.8% below list).
- To meet the 1% rule (rent ≥ 1% of price), the offer needs to be $172k (16.0% below list).
- Recommended offer: $172k (16.0% below list) — sets the bar for 1% rule.
- Cap rate 6.2% vs local median 3.8% in San Antonio — top-decile yield for the area; either an underpriced asset or a hidden risk that comps aren't pricing in. Stress-test before assuming the spread holds.
Location & tenants
- Location reads 80/100 on livability (#31 in TX, #1,616 nationally) — a professional / high-income tenant draw. Strengths: amenities A+, commute A+, cost of living A+; Watch: schools C-, crime F.
- Medina Valley ISD (rural): math 48% / reading 53% proficiency, ranked #148 of 826 in TX (top 18%) — acceptable for families but not a draw, mixed tenant base, ~2y average lease.
- Market conditions: Rents soft (-1.7%/yr); 537 active listings in the ZIP; 40 comparable units currently listed for rent nearby; rentals at typical pace (median 24d on market — plan ~3-4 weeks tenant-placement turnaround); solid renter incomes; 8,308 units permitted in Bexar County in 2024 (2,506 in 5+ unit buildings).
Forward outlook
- In year one you build about $1k of equity ($1k loan paydown + $-4 appreciation (-0.0% local appreciation)).
- Bexar County population projected at +50% by 2050 — long-run rental-demand tailwind backs the buy-and-hold thesis.
Negotiation context
- It's been on market 68 days — a 6% lower offer ($193k) is reasonable based on typical stale-listing flexibility.
- 3 sale attempts since 3y ago; this cycle's ask has dropped $26k (11%) from the opening price — seller is motivated, your offer sets the floor, not the list.
Risks & watch-outs
- Climate carrying-cost: severe wind risk, 80% chance of damaging wind over 30y; moderate wildfire risk; extreme-heat days projected 7→22/yr by 2055 (HVAC capex compounding) — expect insurance premiums to compound above CPI over the hold.
Questions for the listing agent
- What do current leases actually rent for vs. the listed asking? Can we see a recent rent roll and the last 12 months of T-12 income?
- It's been on market 68 days. Have you received any prior offers? Is the seller open to a 16% concession, seller financing, or rate buy-down credit?
- What does the HOA fee cover, when was the last increase, and are there any pending special assessments or reserve-fund shortfalls?
- Why hasn't it sold? Are there any deal-killer items the seller is aware of (foundation, flood, title, zoning, code violations)?
- Is there a deadline driving the sale (1031 exchange, divorce, estate, relocation)? That informs how much negotiation room exists.
- Crime grade is F in this area — have there been break-ins, vandalism, or insurance claims at this property in the last 3 years? What carrier currently insures it and at what premium?
- What's the average days-on-market for RENTAL listings here right now (not sales)? A rising rental-DOM trend means longer vacancies and softer asking-rent achievability than the comps imply.
- What's the recent tenant-quality profile in this submarket — average credit score on applications, eviction rate, late-payment / NSF rate, and stable-employment percentage? A property-management company in the area should have these aggregated.
- How much new for-sale + rental construction is in the pipeline within 1–3 miles? Heavy new supply typically softens prices + rents 12–24 months out; constrained supply supports both.
Investment metrics
- 1% rule
- 0.84% ✗
- Cap rate
- 6.17%
- Cash-on-cash
- -0.44%
- DSCR
- 0.98
- GRM
- 9.9
CMA / ARV
- ARV (median comp)
- $234,651
- List price
- $204,900
- Delta
- -12.68%
- Verdict
- UNDERPRICED
- Comps
- 20 within 1.0 mi
Show comp detail 12 sales within ~0.75 mi
| Address | Dist | Beds/Ba | Sqft | Sold | Price | $/sf | Match |
|---|---|---|---|---|---|---|---|
| 7714 Fox Xing | 0.34mi | 3/2.5 | 1,826 (-3%) | 2mo | $289,990 | $159 | 77 |
| 7242 King Bnd | 0.60mi | 4/3.0 (+1) | 1,912 (+1%) | 1mo | $326,990 | $171 | 62 |
| 7231 King Bnd | 0.62mi | 4/3.0 (+1) | 1,912 (+1%) | 2mo | $321,990 | $168 | 60 |
| 13811 Buffalo Vly | 0.70mi | 4/2.5 (+1) | 1,867 (-1%) | 1mo | $249,999 | $134 | 60 |
| 7715 Fox Xing | 0.35mi | 4/2.5 (+1) | 2,121 (+12%) | 2mo | $307,990 | $145 | 57 |
| 13714 Birch Xing | 0.50mi | 3/2.5 | 1,689 (-11%) | 3mo | $319,990 | $189 | 57 |
| 14014 Piglet Trl | 0.26mi | 4/2.0 (+1) | 1,627 (-14%) | 2mo | $210,000 | $129 | 56 |
| 7727 Fox Xing | 0.37mi | 4/2.5 (+1) | 2,121 (+12%) | 2mo | $306,990 | $145 | 55 |
| 7738 Fox Xing | 0.38mi | 4/2.5 (+1) | 2,121 (+12%) | 3mo | $289,990 | $137 | 55 |
| 13911 Wool Park | 0.31mi | 4/2.0 (+1) | 1,627 (-14%) | 2mo | $215,000 | $132 | 54 |
| 14076 Wool | 0.41mi | 4/2.0 (+1) | 1,616 (-14%) | 2mo | $209,900 | $130 | 48 |
| 13930 Silos Mdws | 0.56mi | 4/2.0 (+1) | 1,620 (-14%) | 1mo | $217,120 | $134 | 43 |
Match score weights: distance 35% · size 25% · config 20% · recency 20%. Top-matched comps best support the ARV.
Projected returns pro-forma
-0.0% appreciation · 0.0% rent growth · sell at horizon
- IRR
- -4.7%
- Equity multiple
- 0.78×
- Total profit
- $-12,406
- Equity at exit
- $59,478
- IRR
- -0.9%
- Equity multiple
- 0.91×
- Total profit
- $-5,162
- Equity at exit
- $71,481
Cash invested: $57,372 (down + closing). Projections, not guarantees.
Landlord ↔ Tenant lean methodology
- Overall (STATE)
- 87 Strongly Landlord-Friendly
- State Texas
- 87 Strongly Landlord-Friendly · R+5
- County
- — inherits STATE
- City
- — inherits STATE
ZIP-level market 78252
- Home prices YoY
- -0.0%
- Rents YoY
- -1.7%
- Active inventory
- 537
- Price-to-rent
- 9.9×
Monthly cashflow live
- Estimated rent
- $1,721 high interval (Pro) →
- Mortgage (P&I)
- −$1,075
- Tax from tax record
- −$161 /mo · $1,934/yr
- Insurance
- −$85
- HOA
- −$60
- Vacancy / Maint / Mgmt
- −$361
- Net cashflow
- $-21
Break-even live
UW: 25.0% down · 7.5% · 30yr · 1.5% tax · 5.0% vac · 8.0% maint · 8.0% mgmt
Financing live
Cash to close
- Down payment
- $51,225
- Closing costs
- $6,147
- Reserves months
- —
- Total cash needed
- —
Loan-product check · same deal, 3 products live
Conventional
25% down · 7.5% · 30yr
- Down + closing
- —
- Monthly P&I
- —
- Monthly cashflow
- —
- DSCR
- —
- Eligible?
- —
Personal DTI + credit; lowest rate.
DSCR
20% down · 8.5% · 30yr
- Down + closing
- —
- Monthly P&I
- —
- Monthly cashflow
- —
- DSCR
- —
- Eligible?
- —
No personal income docs; deal must DSCR.
Hard money
10% down · 12.0% · 12mo
- Down + closing
- —
- Monthly P&I
- —
- Monthly cashflow
- —
- DSCR
- —
- Eligible?
- —
Short-term bridge; refi at stabilization.
Rent comps 40 comps
| Address | Beds | Baths | Sqft | Rent | $/sqft | DOM | Units | Dist |
|---|---|---|---|---|---|---|---|---|
| 7415 Donkey Vly San Antonio, TX | 3.0 | 2.0 | 1225 | $1,500 | $1.22 | 43d | 1 | 0.02mi |
| 7258 Plow Run San Antonio, TX | 3.0 | 2.0 | 1300 | $1,475 | $1.13 | 23d | 1 | 0.03mi |
| 7258 Plow Run San Antonio, TX | 3.0 | 2.0 | 1300 | $1,575 | $1.21 | 43d | 1 | 0.03mi |
| 7218 Ox Pl San Antonio, TX | 4.0 | 2.0 | 1492 | $1,495 | $1.00 | 2d | 1 | 0.10mi |
| 7218 Ox Pl San Antonio, TX | 4.0 | 2.0 | 1492 | $1,495 | $1.00 | 21d | 1 | 0.10mi |
| 7247 Ox Pl San Antonio, TX | 3.0 | 2.0 | 1300 | $1,800 | $1.38 | 4d | 1 | 0.11mi |
| 13802 Ostrich Run San Antonio, TX | 3.0 | 2.0 | 1300 | $1,600 | $1.23 | 17d | 1 | 0.11mi |
| 7218 Duck Pond San Antonio, TX | 4.0 | 2.0 | 1492 | $1,575 | $1.06 | 21d | 1 | 0.14mi |
| 14234 Llama Pl San Antonio, TX | 3.0 | 2.0 | 1244 | $1,500 | $1.21 | 43d | 1 | 0.15mi |
| 7231 Duck Pond San Antonio, TX | 4.0 | 2.0 | 1492 | $1,750 | $1.17 | 4d | 1 | 0.17mi |
| 7216 Pasture Run San Antonio, TX | 4.0 | 2.0 | 1647 | $1,525 | $0.93 | 4d | 1 | 0.19mi |
| 7371 Cultivator Way San Antonio, TX | 4.0 | 2.0 | 1880 | $1,495 | $0.80 | 23d | 1 | 0.21mi |
| 7226 Cultivator Way San Antonio, TX | 3.0 | 2.0 | 1300 | $1,497 | $1.15 | 23d | 1 | 0.21mi |
| 13922 Wool Park San Antonio, TX | 3.0 | 2.0 | 1416 | $1,450 | $1.02 | 23d | 1 | 0.33mi |
| 14007 Wool Park San Antonio, TX | 4.0 | 2.5 | 1950 | $1,599 | $0.82 | 43d | 1 | 0.36mi |
| 13942 Bull Cv San Antonio, TX | 4.0 | 2.5 | 1950 | $2,200 | $1.13 | 43d | 1 | 0.37mi |
| 14010 Wool Park San Antonio, TX | 4.0 | 2.5 | 1950 | $1,850 | $0.95 | 17d | 1 | 0.37mi |
| 6743 Arid Way San Antonio, TX | 3.0 | 2.0 | 1910 | $1,921 | $1.01 | 43d | 1 | 0.41mi |
| 6728 Beehive Dr San Antonio, TX | 3.0 | 2.0 | 1675 | $1,596 | $0.95 | 12d | 1 | 0.44mi |
| 6683 Arid Way San Antonio, TX | 3.0 | 2.0 | 1440 | $1,500 | $1.04 | 23d | 1 | 0.46mi |
| 6741 Hatchery Way San Antonio, TX | 3.0 | 2.0 | 1675 | $1,811 | $1.08 | 43d | 1 | 0.50mi |
| 6738 Hatchery Way San Antonio, TX | 3.0 | 2.0 | 1459 | $1,585 | $1.09 | 43d | 1 | 0.53mi |
| 6734 Hatchery Way San Antonio, TX | 3.0 | 2.0 | 1675 | $1,741 | $1.04 | 43d | 1 | 0.54mi |
| 6638 Arid Way San Antonio, TX | 4.0 | 2.0 | 1627 | $1,479 | $0.91 | 4d | 1 | 0.54mi |
| 6711 Hatchery Way San Antonio, TX | 3.0 | 2.0 | 1459 | $1,606 | $1.10 | 12d | 1 | 0.56mi |
| 13930 Silos Mdws San Antonio, TX | 4.0 | 2.0 | 1616 | $1,650 | $1.02 | 12d | 1 | 0.57mi |
| 6603 Arid Way San Antonio, TX | 3.0 | 2.0 | 1440 | $1,506 | $1.05 | 43d | 1 | 0.60mi |
| 6524 Arid Way San Antonio, TX | 4.0 | 2.0 | 1657 | $1,556 | $0.94 | 23d | 1 | 0.62mi |
| 6515 Scarecrow Way San Antonio, TX | 4.0 | 2.0 | 1627 | $1,565 | $0.96 | 23d | 1 | 0.63mi |
| 6512 Arid Way San Antonio, TX | 4.0 | 2.0 | 1687 | $1,671 | $0.99 | 23d | 1 | 0.65mi |
| 6511 Arid Way San Antonio, TX | 4.0 | 2.5 | 1687 | $1,700 | $1.01 | 12d | 1 | 0.66mi |
| 6835 Capriccio Spirit San Antonio, TX | 3.0 | 2.5 | 1512 | $1,700 | $1.12 | 21d | 1 | 0.66mi |
| 6814 Rondo Measure San Antonio, TX | 4.0 | 2.5 | 2252 | $1,850 | $0.82 | 23d | 1 | 0.67mi |
| 6432 Pickaxe Way San Antonio, TX | 3.0 | 2.0 | 1266 | $1,351 | $1.07 | 23d | 1 | 0.71mi |
| 6432 Pickaxe Way San Antonio, TX | 3.0 | 2.0 | 1276 | $1,285 | $1.01 | 17d | 1 | 0.71mi |
| 6623 Whisper Pond San Antonio, TX | 4.0 | 2.5 | 2243 | $1,950 | $0.87 | 17d | 1 | 0.72mi |
| 6623 Whisper Pond San Antonio, TX | 4.0 | 2.5 | 2252 | $1,950 | $0.87 | 43d | 1 | 0.72mi |
| 6830 Whisper Grv San Antonio, TX | 4.0 | 2.0 | 1884 | $1,900 | $1.01 | 16d | 1 | 0.79mi |
| 6830 Whisper Grv San Antonio, TX | 4.0 | 2.0 | 1901 | $1,900 | $1.00 | 3d | 1 | 0.79mi |
| 13422 Whisper Bnd San Antonio, TX | 3.0 | 2.0 | 1662 | $2,000 | $1.20 | 23d | 1 | 0.80mi |
HOA detail
- Monthly dues
- $60 · $720/yr
- Likely covers
- gas
Listing history 26 events
-
2026-06-16statusdays on market $204,900 Pending 68 DOM
-
2026-06-15days on market $204,900 Active Option 67 DOM
-
2026-06-13days on market $204,900 Active Option 65 DOM
-
2026-06-09days on market $204,900 Active Option 61 DOM
-
2026-06-08days on market $204,900 Active Option 60 DOM
-
2026-06-07days on market $204,900 Active Option 59 DOM
-
2026-06-04days on market $204,900 Active Option 56 DOM
-
2026-06-03days on market $204,900 Active Option 55 DOM
-
2026-06-02days on market $204,900 Active Option 54 DOM
-
2026-06-02days on market $204,900 Active Option 53 DOM
-
2026-05-31days on market $204,900 Active Option 52 DOM
-
2026-05-13historical Active Option 543-char remark
Show marketing remark (543 chars)
Price drop to $204,900. Seller is contributing $5K in closing costs. Save on your CPS energy bills with SOLAR PANELS THAT CONVEY WITH PROPERTY. PAID OFF BY OWNERS. Located in The Silos off Hwy 90 and Hwy 211 this 4 bedroom, 2 bath Lennar home was built in May, 2023 and shows like brand new. With 1880 square feet of living space there is plenty of room for the entire family. The master bedroom is downstairs, large living room and an updated laundry room. The kitchen has gas cooking, stainless steel appliances, granite countertops.
-
2026-05-07price $204,900 543-char remark
Show marketing remark (543 chars)
Price drop to $204,900. Seller is contributing $5K in closing costs. Save on your CPS energy bills with SOLAR PANELS THAT CONVEY WITH PROPERTY. PAID OFF BY OWNERS. Located in The Silos off Hwy 90 and Hwy 211 this 4 bedroom, 2 bath Lennar home was built in May, 2023 and shows like brand new. With 1880 square feet of living space there is plenty of room for the entire family. The master bedroom is downstairs, large living room and an updated laundry room. The kitchen has gas cooking, stainless steel appliances, granite countertops.
-
2026-05-07price $204,000 543-char remark
Show marketing remark (543 chars)
Price drop to $204,900. Seller is contributing $5K in closing costs. Save on your CPS energy bills with SOLAR PANELS THAT CONVEY WITH PROPERTY. PAID OFF BY OWNERS. Located in The Silos off Hwy 90 and Hwy 211 this 4 bedroom, 2 bath Lennar home was built in May, 2023 and shows like brand new. With 1880 square feet of living space there is plenty of room for the entire family. The master bedroom is downstairs, large living room and an updated laundry room. The kitchen has gas cooking, stainless steel appliances, granite countertops.
-
2026-04-13price $214,900 543-char remark
Show marketing remark (543 chars)
Price drop to $204,900. Seller is contributing $5K in closing costs. Save on your CPS energy bills with SOLAR PANELS THAT CONVEY WITH PROPERTY. PAID OFF BY OWNERS. Located in The Silos off Hwy 90 and Hwy 211 this 4 bedroom, 2 bath Lennar home was built in May, 2023 and shows like brand new. With 1880 square feet of living space there is plenty of room for the entire family. The master bedroom is downstairs, large living room and an updated laundry room. The kitchen has gas cooking, stainless steel appliances, granite countertops.
-
2026-04-09$231,000 New 543-char remark
Show marketing remark (543 chars)
Price drop to $204,900. Seller is contributing $5K in closing costs. Save on your CPS energy bills with SOLAR PANELS THAT CONVEY WITH PROPERTY. PAID OFF BY OWNERS. Located in The Silos off Hwy 90 and Hwy 211 this 4 bedroom, 2 bath Lennar home was built in May, 2023 and shows like brand new. With 1880 square feet of living space there is plenty of room for the entire family. The master bedroom is downstairs, large living room and an updated laundry room. The kitchen has gas cooking, stainless steel appliances, granite countertops.
-
2026-04-09historical
Show marketing remark (543 chars)
Price drop to $204,900. Seller is contributing $5K in closing costs. Save on your CPS energy bills with SOLAR PANELS THAT CONVEY WITH PROPERTY. PAID OFF BY OWNERS. Located in The Silos off Hwy 90 and Hwy 211 this 4 bedroom, 2 bath Lennar home was built in May, 2023 and shows like brand new. With 1880 square feet of living space there is plenty of room for the entire family. The master bedroom is downstairs, large living room and an updated laundry room. The kitchen has gas cooking, stainless steel appliances, granite countertops.
-
2026-03-17price $231,000
-
2026-03-04price $239,000
-
2026-02-16price $244,000
-
2026-01-21price $249,000
-
2026-01-09$260,000 New
-
2023-05-05soldstatus Sold
-
2023-04-04status Pending
-
2023-03-28price $236,049
-
2023-03-26$240,049 New
ⓘ Source: listings_history table (triggers on properties + properties_extension) + one-shot
backfill from property_details.listing_events for pre-trigger history.
Tax reassessment forecast TX · Resets to sale price
- Current annual tax
- $1,934 · $161/mo
- Projected year-2 tax
- $3,750 · $312/mo
- Expected delta
- +$1,816/yr (+$151/mo · 93.9%)
ⓘ Screening estimate from a state-policy table — verify with the county assessor before closing.
Climate risk First Street
- Flood 1/10 Low FEMA zone X (unshaded) · 0% chance over 30 yrs
- Wildfire 5/10 Major
- Heat 8/10 Severe 7 d/yr ≥109°F today · 22 d/yr by 30 yrs out
- Wind 8/10 Severe 80% chance of damaging wind over 30 yrs
- Air quality 2/10 Low 0 unhealthy d/yr today · 1 by 30 yrs out
Nearby sold comps map
Loading sold comps map…
Walkable amenities ~0.75 mi
Loading nearby amenities…
Taxation est. · year 1
- Rental income
- $20,655
- − Mortgage interest
- −$11,478
- − Property taxes
- −$1,934
- − Insurance
- −$1,024
- − Repairs & maintenance
- −$1,652
- − Management
- −$1,652
- − HOA
- −$720
- − Depreciation
- −$5,961
- Taxable loss
- −$3,767
- Est. tax savings @ 24.0%
- +$904
- After-tax cash flow
- $649/yr
For passive investors: Depreciation is non-cash, so a rental often shows a tax loss while cash-flowing — sheltering income. Rental losses are passive: they offset passive income freely, and up to $25,000/yr can offset ordinary (W-2) income if you actively participate and your MAGI is under $100k (phasing out to $0 by $150k); unused losses carry forward. On sale, claimed depreciation is recaptured at up to 25%, and gains may owe capital-gains tax (a 1031 exchange can defer both). Figures are a year-1 estimate at your 24.0% rate — not tax advice; consult a CPA.
Condition & rehab AI · 12 photos
This home is in excellent condition with a fresh paint job and well-maintained landscaping. It has a good layout and is move-in ready.
Value-add opportunities
- Both Painting exterior siding — Enhances curb appeal and can increase property value
- Both Landscaping improvements — Enhances curb appeal and can increase property value
- Both Replace worn-out flooring — Fresh flooring can improve the overall look and feel of the home
- Both Upgrade kitchen appliances — Modern appliances can increase the home's appeal and value
- Both Install smart home features — Smart home features can increase the home's appeal and value, making it more attractive to potential buyers
Renovation cost estimate screening
Value-add ROI direction
- Both Painting exterior siding — Enhances curb appeal and can increase property value ↑
- Both Landscaping improvements — Enhances curb appeal and can increase property value ↑
- Both Replace worn-out flooring — Fresh flooring can improve the overall look and feel of the home ↑
- Both Upgrade kitchen appliances — Modern appliances can increase the home's appeal and value ↑
- Both Install smart home features — Smart home features can increase the home's appeal and value, making it more attractive to potential buyers ↑
ⓘ Cost ranges are severity-bucket heuristics (US national rule-of-thumb). Get contractor quotes + a written scope before underwriting a rehab budget.
Schools (NCES district)
- District
- Medina Valley ISD
- NCES district ID
- 4830060
- Math proficiency
- 48% ▼ -9.00%
- Reading proficiency
- 53% ▼ -2.00%
- Median HH income
- $60,596
- Composite
- 44.2/100
- National rank
- #2851
- State rank
- #148 of 826 in TX
Livability — San Antonio
- Score
- 80/100
- State rank
- #31
- US rank
- #1616
Category grades
Schools grade is shown separately in the Schools card above.
Census & demographics
- County
- Bexar County · 1,990,555 people
- City population
- 1,806,925
- Metro
- San Antonio-New Braunfels, TX
- Population (ZIP)
- 21,790
- Household income
- $85,518
- Rent vs Own
- Severe rent burden
- 152.0
Population outlook (Bexar County) Hauer SSP2
- Today (2025)
- 2,336,851 people
- By 2030
- 2,560,728 · +9.6%
- By 2040
- 3,020,569 · +29.3%
- By 2050
- 3,493,522 · +49.5%
- By 2075
- 4,668,459 · +99.8%
- By 2100
- 5,533,242 · +136.8%
Race, ethnicity, and origin ACS 2023
- Neighborhood character
- Predominantly Hispanic (68%)
- Race & ethnicity
- Hispanic / Latino 68% Two or more races 29% White 17% Black 8% Asian 3% Native American 1%
- Hispanic origin (detail)
- Mexican 61% Puerto Rican 1%
- Common ancestry
- Hispanic 2% Lithuanian 1% German 1%
- Foreign-born
- 12% · Canada, South Korea
- Languages at home
- 58% English-only · Spanish 38% Tagalog/Filipino 2% Other Indo-European 1%
Political lean MEDSL · Bexar
- 2024 margin
- Lean D (+9.8) · D 54.3% · R 44.6% · Other 1.1%
- 2008→2024 swing
- +4.2pp toward D · 2008: 5.6pp · 2024: 9.8pp
- All cycles
- 2024: D+9.8 2020: D+18.2 2016: D+13.5 2012: D+4.6 2008: D+5.6
Not yet ingested
- Civics
- —
Market trends
- HPI YoY
- ▬ -0.00%
- Current HPI
- 183.6413
- Rent YoY
- ▼ -1.67%
- Metro
- San Antonio-New Braunfels, TX
- State GDP YoY
- ▲ 3.95%
- F500 in state
- 110
Industry mix (Fortune 500 HQ in TX)
| Industry | F500 HQs | Revenue |
|---|---|---|
| Energy | 16 | $1,198B |
|
||
| Technology | 5 | $198B |
|
||
| Engineering / Construction | 4 | $72B |
|
||
| Energy Services | 3 | $60B |
|
||
| Utilities | 3 | $41B |
|
||
| Healthcare | 2 | $330B |
|
||
Price history
-14.6% since first listed15 events — show timeline
- 2026-05-13 Contingent — LERA
- 2026-05-07 Price Changed $204,900 LERA
- 2026-05-07 Price Changed $204,000 LERA
- 2026-04-13 Price Changed $214,900 LERA
- 2026-04-09 Listing Removed — LERA
- 2026-04-09 Listed $231,000 LERA
- 2026-03-17 Price Changed $231,000 LERA
- 2026-03-04 Price Changed $239,000 LERA
- 2026-02-16 Price Changed $244,000 LERA
- 2026-01-21 Price Changed $249,000 LERA
- 2026-01-09 Listed $260,000 LERA
- 2023-05-05 Sold (MLS) — LERA
- 2023-04-04 Pending — LERA
- 2023-03-28 Price Changed $236,049 LERA
- 2023-03-26 Listed $240,049 LERA
Property tax history
+34.6%/yrLatest (2025): $1,934 · -61.1% YoY. Source: county tax records.
Cash-flow waterfall
monthlySold comps — $/sqft
last 12 mo · ≤1 miLoading sold comps…