 🏗️ New Construction
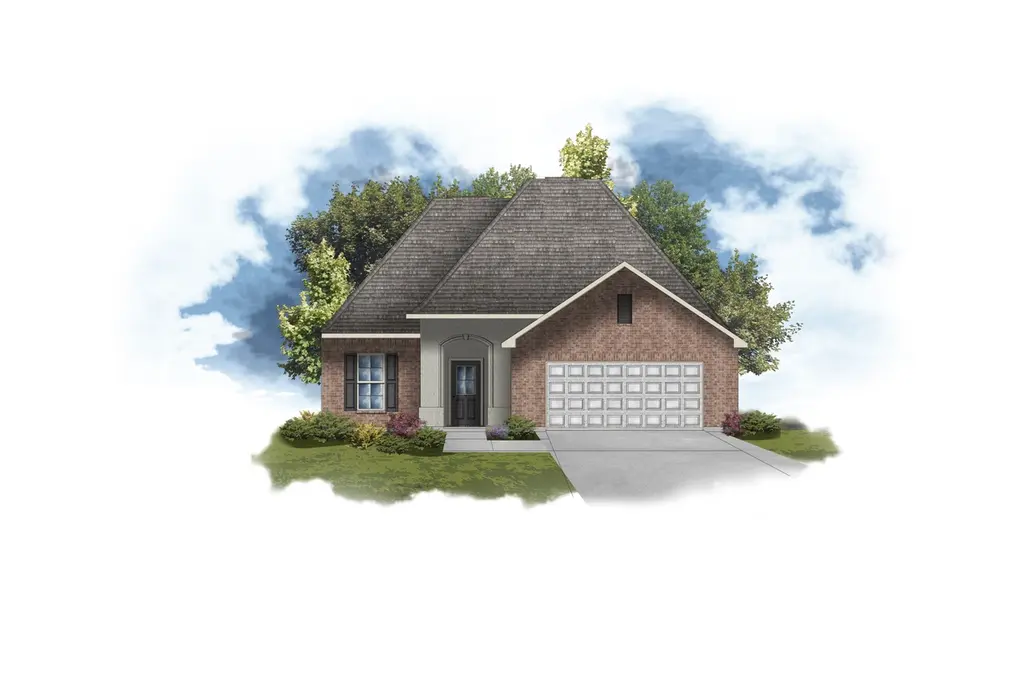
Napoli V B Plan · Scott, LA
Flood risk No data
- FEMA flood zone
- —
- Chance of flooding over 30 yrs
- —
- Est. flood insurance / yr
- —
Fire risk No data
- Est. fire insurance / yr
- —
Heat risk No data
- Hot days now (above threshold)
- —
- Hot days in 30 yrs
- —
Wind risk No data
- Chance of severe wind over 30 yrs
- —
Air-quality risk No data
- Unhealthy air days now
- —
- Unhealthy air days in 30 yrs
- —
Risk factors via First Street. Map © Google.
Why this score? — see what drove the D- grade
The composite is a weighted blend of 9 inputs, each scored 0–100. Each bar is that input's sub-score; the figure is the points it added to the 100-point composite (weight × sub-score).
- Cash flow +13.2/30.0
- ARV discount +7.5/15.0
- DSCR +4.0/10.0
- 1% rule +3.7/10.0
- Schools +3.6/10.0
- Livability +3.3/5.0
- Rent growth +2.5/5.0
- Condition / age +1.0/5.0
- Appreciation +0.0/10.0
$246,990
🖨 Deal sheet 📄 Offer letter ✓ Due diligence
Listing remarks MLS
- Open Floor Plan - Three Bedrooms, Two Bathrooms - Stucco, Brick, and Siding - Two Car Garage - Recessed Lighting in Kitchen and Living Room - Separate Master Shower - Walk-In Master Closet
Key facts
- Open floor plan
- Recessed lighting
- 2 garage spots
Tags
Neighborhood map
What this means for you Summary
Snapshot
- This is a 3-bed/2.0-bath single-family listed at $247k. Condition is rated poor.
Deal economics
- At list price, monthly cash flow is $-5 ($-58/yr) — negative.
- The deal already cash-flows at list — no discount required.
- To meet the 1% rule (rent ≥ 1% of price), the offer needs to be $218k (11.6% below list).
- Recommended offer: $217k (12.0% below list) — sets the bar for market timing.
- Cap rate 6.3% vs local median 4.7% in Scott — top-decile yield for the area; either an underpriced asset or a hidden risk that comps aren't pricing in. Stress-test before assuming the spread holds.
Location & tenants
- Location reads 66/100 on livability (#116 in LA) — a middle-class / working-renter tenant base. Strengths: cost of living A+, health & safety A+, schools B+; Watch: crime F, amenities F, commute F.
- Lafayette Parish (urban): math 38% / reading 46% proficiency, ranked #19 of 98 in LA (top 19%) — families likely to look elsewhere, expect single-tenant / working-renter base with shorter leases.
- Market conditions: 276 active listings in the ZIP; 4 comparable units currently listed for rent nearby; rentals leasing fast (median 13d on market — plan ~1-2 weeks tenant-placement turnaround); 1,585 units permitted in Lafayette Parish in 2024 (10 in 5+ unit buildings).
Forward outlook
- Local home prices are declining (-3.0%/yr); year-one equity from $2k of loan paydown is wiped out by about $8k of value loss. Plan a longer hold.
- Lafayette County population projected at +34% by 2050 — long-run rental-demand tailwind backs the buy-and-hold thesis.
Negotiation context
- It's been on market 437 days — a 12% lower offer ($217k) is reasonable based on typical stale-listing flexibility.
Questions for the listing agent
- What do current leases actually rent for vs. the listed asking? Can we see a recent rent roll and the last 12 months of T-12 income?
- It's been on market 437 days. Have you received any prior offers? Is the seller open to a 12% concession, seller financing, or rate buy-down credit?
- Have any recent inspections been done? Can we get a copy of the seller's disclosures and any deferred-maintenance estimates?
- Why hasn't it sold? Are there any deal-killer items the seller is aware of (foundation, flood, title, zoning, code violations)?
- Is there a deadline driving the sale (1031 exchange, divorce, estate, relocation)? That informs how much negotiation room exists.
- Schools are B-rated — typically a magnet for longer-tenancy family renters. What's the average tenant stay here, and is there a school-zone premium baked into asking?
- Crime grade is F in this area — have there been break-ins, vandalism, or insurance claims at this property in the last 3 years? What carrier currently insures it and at what premium?
- The area grade is low — what's the realistic commute time and amenity access for the typical tenant pool here? Any planned neighborhood developments (good or bad) we should know about?
- What's the average days-on-market for RENTAL listings here right now (not sales)? A rising rental-DOM trend means longer vacancies and softer asking-rent achievability than the comps imply.
- What's the recent tenant-quality profile in this submarket — average credit score on applications, eviction rate, late-payment / NSF rate, and stable-employment percentage? A property-management company in the area should have these aggregated.
- How much new for-sale + rental construction is in the pipeline within 1–3 miles? Heavy new supply typically softens prices + rents 12–24 months out; constrained supply supports both.
Investment metrics
- 1% rule
- 0.87% ✗
- Cap rate
- 6.27%
- Cash-on-cash
- -0.08%
- DSCR
- 1.00
- GRM
- 9.6
CMA / ARV
- ARV (median comp)
- $250,319
- List price
- $246,990
- Delta
- -1.33%
- Verdict
- FAIR
- Comps
- 20 within 1.0 mi
Show comp detail 12 sales within ~0.75 mi
| Address | Dist | Beds/Ba | Sqft | Sold | Price | $/sf | Match |
|---|---|---|---|---|---|---|---|
| 121 Pine Harvest Ln | 0.04mi | 3/2.0 | 1,750 (+0%) | 3mo | $249,375 | $143 | 96 |
| 102 Pine Harvest Ln | 0.04mi | 3/2.0 | 1,538 (-12%) | 2mo | $234,265 | $152 | 77 |
| 200 Nandina Dr | 0.53mi | 3/2.0 | 1,735 (-1%) | 1mo | $255,956 | $148 | 73 |
| 308 Payton Woods Ln | 0.63mi | 3/2.0 | 1,825 (+4%) | 1mo | $256,786 | $141 | 62 |
| 300 Payton Woods Ln | 0.63mi | 3/2.0 | 1,825 (+4%) | 1mo | $258,075 | $141 | 62 |
| 203 Payton Woods Ln | 0.63mi | 3/2.0 | 1,825 (+4%) | 3mo | $257,958 | $141 | 61 |
| 111 Nandina Dr | 0.73mi | 3/2.0 | 1,689 (-3%) | 2mo | $245,664 | $145 | 59 |
| 119 Nandina Dr | 0.73mi | 3/2.0 | 1,825 (+4%) | 2mo | $263,758 | $145 | 57 |
| 312 Payton Woods Ln | 0.55mi | 4/2.0 (+1) | 1,858 (+6%) | 4mo | $260,779 | $140 | 55 |
| 105 Nandina Dr | 0.66mi | 4/2.0 (+1) | 1,865 (+7%) | 1mo | $260,550 | $140 | 52 |
| 211 Nandina Dr | 0.53mi | 3/2.0 | 1,495 (-14%) | 0mo | $231,321 | $155 | 51 |
| 208 Long Creek Ln | 0.68mi | 4/2.0 (+1) | 1,873 (+7%) | 1mo | $289,999 | $155 | 50 |
Match score weights: distance 35% · size 25% · config 20% · recency 20%. Top-matched comps best support the ARV.
Projected returns pro-forma
-3.0% appreciation · 3.0% rent growth · sell at horizon
- IRR
- -16.4%
- Equity multiple
- 0.42×
- Total profit
- $-40,835
- Equity at exit
- $37,323
- IRR
- -8.1%
- Equity multiple
- 0.49×
- Total profit
- $-35,819
- Equity at exit
- $21,643
Cash invested: $70,089 (down + closing). Projections, not guarantees.
Landlord ↔ Tenant lean methodology
- Overall (STATE)
- 90 Strongly Landlord-Friendly
- State Louisiana
- 90 Strongly Landlord-Friendly · R+12
- County
- — inherits STATE
- City
- — inherits STATE
ZIP-level market 70583
- Active inventory
- 276
- Price-to-rent
- 9.4×
Monthly cashflow live
- Estimated rent
- $2,184 medium interval (Pro) →
- Mortgage (P&I)
- −$1,313
- Tax est. 1.5%
- −$313 /mo · $3,755/yr
- Insurance
- −$104
- HOA
- −$0
- Vacancy / Maint / Mgmt
- −$459
- Net cashflow
- $-5
Break-even live
UW: 25.0% down · 7.5% · 30yr · 1.5% tax · 5.0% vac · 8.0% maint · 8.0% mgmt
Financing live
Cash to close
- Down payment
- $62,580
- Closing costs
- $7,510
- Reserves months
- —
- Total cash needed
- —
Loan-product check · same deal, 3 products live
Conventional
25% down · 7.5% · 30yr
- Down + closing
- —
- Monthly P&I
- —
- Monthly cashflow
- —
- DSCR
- —
- Eligible?
- —
Personal DTI + credit; lowest rate.
DSCR
20% down · 8.5% · 30yr
- Down + closing
- —
- Monthly P&I
- —
- Monthly cashflow
- —
- DSCR
- —
- Eligible?
- —
No personal income docs; deal must DSCR.
Hard money
10% down · 12.0% · 12mo
- Down + closing
- —
- Monthly P&I
- —
- Monthly cashflow
- —
- DSCR
- —
- Eligible?
- —
Short-term bridge; refi at stabilization.
Rent comps 4 comps
| Address | Beds | Baths | Sqft | Rent | $/sqft | DOM | Units | Dist |
|---|---|---|---|---|---|---|---|---|
| 315 Sandstone Ave #202 Scott, LA | 2.0 | 2.5 | 1193 | $1,895 | $1.59 | 13d | 1 | 0.80mi |
| 128 Oak Village Dr Scott, LA | 3.0 | 2.0 | 1445 | $2,450 | $1.70 | 13d | 1 | 0.81mi |
| 1313 Apollo Rd Scott, LA | 1.0–3.0 | 1.0–2.0 | 1100 | $2,000 | $1.82 | 13d | 10 | 1.01mi |
| 401 Pinto St Lafayette, LA | 3.0 | 2.0 | 1601 | $2,300 | $1.44 | 43d | 1 | 1.20mi |
Listing history 17 events
-
2026-06-18days on market $246,990 Active 437 DOM
-
2026-06-17days on market $246,990 Active 436 DOM
-
2026-06-16days on market $246,990 Active 435 DOM
-
2026-06-15days on market $246,990 Active 434 DOM
-
2026-06-14days on market $246,990 Active 432 DOM
-
2026-06-13days on market $246,990 Active 431 DOM
-
2026-06-10days on market $246,990 Active 429 DOM
-
2026-06-09days on market $246,990 Active 428 DOM
-
2026-06-08days on market $246,990 Active 427 DOM
-
2026-06-07days on market $246,990 Active 426 DOM
-
2026-06-05days on market $246,990 Active 423 DOM
-
2026-06-03days on market $246,990 Active 422 DOM
-
2026-06-02days on market $246,990 Active 421 DOM
-
2026-06-01days on market $246,990 Active 420 DOM
-
2026-05-31days on market $246,990 Active 419 DOM
-
2026-05-30days on market $246,990 Active 418 DOM
-
2025-04-07$246,990 Active 195-char remark
Show marketing remark (195 chars)
- Open Floor Plan - Three Bedrooms, Two Bathrooms - Stucco, Brick, and Siding - Two Car Garage - Recessed Lighting in Kitchen and Living Room - Separate Master Shower - Walk-In Master Closet
ⓘ Source: listings_history table (triggers on properties + properties_extension) + one-shot
backfill from property_details.listing_events for pre-trigger history.
Nearby sold comps map
Loading sold comps map…
Walkable amenities ~0.75 mi
Loading nearby amenities…
Taxation est. · year 1
- Rental income
- $26,204
- − Mortgage interest
- −$14,022
- − Property taxes
- −$3,755
- − Insurance
- −$1,252
- − Repairs & maintenance
- −$2,096
- − Management
- −$2,096
- − Depreciation
- −$7,282
- Taxable loss
- −$4,299
- Est. tax savings @ 24.0%
- +$1,032
- After-tax cash flow
- $974/yr
For passive investors: Depreciation is non-cash, so a rental often shows a tax loss while cash-flowing — sheltering income. Rental losses are passive: they offset passive income freely, and up to $25,000/yr can offset ordinary (W-2) income if you actively participate and your MAGI is under $100k (phasing out to $0 by $150k); unused losses carry forward. On sale, claimed depreciation is recaptured at up to 25%, and gains may owe capital-gains tax (a 1031 exchange can defer both). Figures are a year-1 estimate at your 24.0% rate — not tax advice; consult a CPA.
Condition & rehab AI · 3 photos
The property is in poor condition with significant overgrown vegetation and a need for extensive exterior repairs and maintenance.
Repairs flagged
- Major Landscaping — Overgrown vegetation and debris in front of the house.
- Major Exterior Painting — The exterior appears unkempt and may need repainting.
- Major Roof Inspection — The roof appears aged and may need inspection.
Value-add opportunities
- Both Landscaping and exterior painting — Improving the curb appeal and overall appearance of the property.
Renovation cost estimate screening
| Repair item | Severity | Est. cost |
|---|---|---|
| Landscaping · Overgrown vegetation and debris in front of the house. | Major | $15,000–50,000 |
| Exterior Painting · The exterior appears unkempt and may need repainting. | Major | $15,000–50,000 |
| Roof Inspection · The roof appears aged and may need inspection. | Major | $15,000–50,000 |
| Total estimated repair cost · 3 items | $45,000–150,000 |
Value-add ROI direction
- Both Landscaping and exterior painting — Improving the curb appeal and overall appearance of the property. ↑
ⓘ Cost ranges are severity-bucket heuristics (US national rule-of-thumb). Get contractor quotes + a written scope before underwriting a rehab budget.
Schools (NCES district)
- District
- Lafayette Parish
- NCES district ID
- 2200870
- Math proficiency
- 38% ▼ -32.00%
- Reading proficiency
- 46% ▼ -24.00%
- Median HH income
- $50,238
- Composite
- 36.15/100
- National rank
- #4741
- State rank
- #19 of 98 in LA
Livability — Scott
- Score
- 66/100
- State rank
- #116
- US rank
- #11265
Category grades
Schools grade is shown separately in the Schools card above.
Census & demographics
- Census place
- Scott, LA
- City population
- 8,670
- Population (ZIP)
- 8,670
Population outlook (Lafayette County) Hauer SSP2
- Today (2025)
- 280,930 people
- By 2030
- 301,092 · +7.2%
- By 2040
- 339,456 · +20.8%
- By 2050
- 375,156 · +33.5%
- By 2075
- 451,672 · +60.8%
- By 2100
- 497,203 · +77.0%
Race, ethnicity, and origin ACS 2023
- Neighborhood character
- Predominantly White (68%)
- Race & ethnicity
- White 68% Hispanic / Latino 16% Black 13% Two or more races 11%
- Hispanic origin (detail)
- Mexican 7% Cuban 2%
- Common ancestry
- Lithuanian 11% Slovak 3% Italian 1%
- Foreign-born
- 11% · Canada
- Languages at home
- 81% English-only · Spanish 12% French/Haitian/Cajun 7%
Political lean MEDSL · Lafayette
- 2024 margin
- Solid R (+31.4) · D 33.5% · R 64.8% · Other 1.7%
- 2008→2024 swing
- -0.1pp no change · 2008: -31.3pp · 2024: -31.4pp
- All cycles
- 2024: R+31.4 2020: R+28.7 2016: R+33.6 2012: R+33.7 2008: R+31.3
Not yet ingested
- Civics
- —
Market trends
- HPI YoY
- ▼ -84.03%
- Current HPI
- 132.4083
- Rent YoY
- —
- Metro
- —
- State GDP YoY
- ▲ 3.29%
- F500 in state
- 10
Industry mix (Fortune 500 HQ in LA)
| Industry | F500 HQs | Revenue |
|---|---|---|
| Telecommunications | 2 | $23B |
|
||
| Utilities | 1 | $12B |
|
||
| Wholesale / Distribution | 1 | $5B |
|
||
| Advertising | 1 | $2B |
|
||
Price history
1 event — show timeline
- 2025-04-07 Listed $246,990 Zillow
Cash-flow waterfall
monthlySold comps — $/sqft
last 12 mo · ≤1 miLoading sold comps…