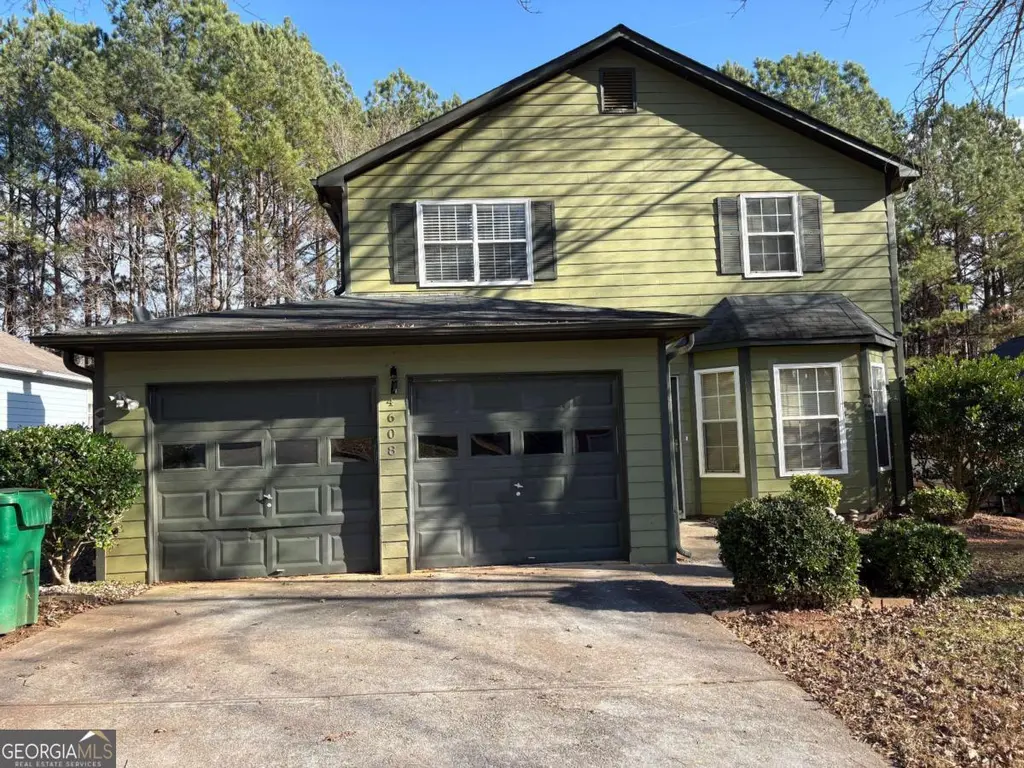
4608 Latchwood Dr · Stonecrest, GA
Flood risk 1/10 · Minimal
- FEMA flood zone
- X (unshaded)
- Chance of flooding over 30 yrs
- 0.0%
- Est. flood insurance / yr
- $507 – $1,088
Fire risk 3/10 · Minor
- Est. fire insurance / yr
- $963 – $1,789
Heat risk 6/10 · Moderate
- Hot days now (above 106°F)
- 7 days/yr
- Hot days in 30 yrs
- 20 days/yr
Wind risk 4/10 · Minor
- Chance of severe wind over 30 yrs
- 23.0%
Air-quality risk 5/10 · Moderate
- Unhealthy air days now
- 6 days/yr
- Unhealthy air days in 30 yrs
- 8 days/yr
Risk factors via First Street. Map © Google.
Why this score? — see what drove the C grade
The composite is a weighted blend of 9 inputs, each scored 0–100. Each bar is that input's sub-score; the figure is the points it added to the 100-point composite (weight × sub-score).
- Cash flow +21.0/30.0
- ARV discount +13.3/15.0
- DSCR +6.7/10.0
- 1% rule +4.2/10.0
- Rent growth +3.7/5.0
- Livability +2.5/5.0
- Condition / age +2.5/5.0
- Schools +2.1/10.0
- Appreciation +0.0/10.0
$205,000
🖨 Deal sheet 📄 Offer letter ✓ Due diligence
Listing remarks MLS
Please schedule showings between 11:00am to 7:00pm.
Key facts
- 7,405 sq ft lot
- Built 1999
- Listed 30 days
Property features AI
Finance
- Other: County: Dekalb, GA; Directions: GPS friendly
- Financial info: No financial details provided
- HOA & community: No HOA or community details provided
Exterior
- Parking: No parking details provided
- Security: No security features provided
- Utilities: Public water; Public sewer
- Home design: Two-story home; Other construction materials; Other roof type
- Construction: Construction materials noted as 'Other'; Roof noted as 'Other'
- Exterior features: Property listed in resale condition; Lot description recorded (legal lot dimensions available)
Interior
- Kitchen: No kitchen features listed; Appliances described as 'Other'
- Bedrooms: Three bedrooms on the upper level; No special bedroom features listed
- Flooring: No flooring details provided
- Bathrooms: Two full bathrooms (both on the upper level); No master bathroom features listed
- Heating & cooling: No heating or cooling details provided
- Interior features: No shared/common walls; Other interior features
- Laundry & utility: No laundry or utility details provided
Neighborhood map
What this means for you Summary
Snapshot
- This is a 3-bed/2.5-bath single-family listed at $205k.
Deal economics
- At list price, monthly cash flow is $287 ($3k/yr) — positive.
- The deal already cash-flows at list — no discount required.
- To meet the 1% rule (rent ≥ 1% of price), the offer needs to be $189k (7.8% below list).
- Recommended offer: $189k (7.8% below list) — sets the bar for 1% rule.
- Cap rate 8.0% vs local median 5.1% in Stonecrest — top-decile yield for the area; either an underpriced asset or a hidden risk that comps aren't pricing in. Stress-test before assuming the spread holds.
Location & tenants
- Location reads: area grade C — affects rentability + tenant quality, not the cash-flow math above.
- Dekalb County (suburban): math 19% / reading 28% proficiency, ranked #125 of 174 in GA (top 72%) — low school quality limits family demand, transient renter base, plan for 1-2y turnover; 68% free/reduced lunch — lower-income household profile, screen leases tightly.
- Zoned schools: Flat Rock Elementary School (math 2% / reading 8%, grade F, #1,160 of 1,228 statewide, top 98%, 996 students, 100% FRL); Salem Middle School (math 5% / reading 16%, grade F, #429 of 470 statewide, top 91%, 988 students, 100% FRL); Martin Luther King- Jr. High School (math 8% / reading 22%, grade F, #297 of 424 statewide, top 74%, 1,440 students, 100% FRL) — zoned schools average 100% FRL vs 68% district-wide (32 pts higher); higher-poverty schools than district average — tighter screening recommended.
- Zoned-school proficiency averages 10% at this address vs 24% district-wide (-13 pts) — the specific schools serving this property underperform the Dekalb County average; the district grade overstates school quality for this exact location.
- Market conditions: Rents rising fast (+4.6%/yr); 320 active listings in the ZIP; 37 comparable units currently listed for rent nearby; rentals at typical pace (median 20d on market — plan ~3-4 weeks tenant-placement turnaround); 1,240 units permitted in DeKalb County in 2024 (385 in 5+ unit buildings).
- This rent runs 31% of the median local income ($74k/yr) — at the standard rent-burdened threshold; future hikes will face affordability resistance.
Forward outlook
- Local home prices are declining (-3.0%/yr); year-one equity from $1k of loan paydown is wiped out by about $6k of value loss. Plan a longer hold.
- DeKalb County population projected at +28% by 2050 — long-run rental-demand tailwind backs the buy-and-hold thesis.
Negotiation context
- It's been on market 30 days — a 2% lower offer ($202k) is reasonable based on typical stale-listing flexibility.
- 5 sale attempts since 3y ago with the ask held roughly flat each time — persistent listings suggest the price (not the market) is what's stuck; bring a comps-based counter.
Risks & watch-outs
- Climate carrying-cost: extreme-heat days projected 7→20/yr by 2055 (HVAC capex compounding) — expect insurance premiums to compound above CPI over the hold.
Questions for the listing agent
- Is there a deadline driving the sale (1031 exchange, divorce, estate, relocation)? That informs how much negotiation room exists.
- What's the average days-on-market for RENTAL listings here right now (not sales)? A rising rental-DOM trend means longer vacancies and softer asking-rent achievability than the comps imply.
- What's the recent tenant-quality profile in this submarket — average credit score on applications, eviction rate, late-payment / NSF rate, and stable-employment percentage? A property-management company in the area should have these aggregated.
- How much new for-sale + rental construction is in the pipeline within 1–3 miles? Heavy new supply typically softens prices + rents 12–24 months out; constrained supply supports both.
Investment metrics
- 1% rule
- 0.92% ✗
- Cap rate
- 7.98%
- Cash-on-cash
- 6.01%
- DSCR
- 1.27
- GRM
- 9.0
CMA / ARV
- ARV (on-the-fly)
- $235,158
- Comps found
- 12
Show comp detail 12 sales within ~0.75 mi
| Address | Dist | Beds/Ba | Sqft | Sold | Price | $/sf | Match |
|---|---|---|---|---|---|---|---|
| 6343 Klondike River Rd | 0.51mi | 3/2.5 | 1,541 (+1%) | 0mo | $219,900 | $143 | 74 |
| 4598 Jackam Ridge Ct | 0.37mi | 3/2.0 | 1,472 (-4%) | 4mo | $240,000 | $163 | 71 |
| 4496 Jackam Ridge Ct | 0.45mi | 3/2.0 | 1,468 (-4%) | 1mo | $241,000 | $164 | 69 |
| 4807 Buchli Ln | 0.49mi | 3/2.0 | 1,472 (-4%) | 4mo | $192,000 | $130 | 66 |
| 6514 Gina Agha Cir | 0.67mi | 3/2.0 | 1,543 (+1%) | 1mo | $238,000 | $154 | 64 |
| 4870 Buchli Ln | 0.60mi | 3/2.0 | 1,572 (+3%) | 2mo | $250,000 | $159 | 63 |
| 4889 Ozment Ridge Ct | 0.66mi | 3/2.0 | 1,468 (-4%) | 1mo | $250,000 | $170 | 60 |
| 4708 Golod Way | 0.62mi | 3/2.5 | 1,630 (+7%) | 3mo | $225,000 | $138 | 58 |
| 6445 Gina Agha Cir | 0.57mi | 4/2.5 (+1) | 1,642 (+8%) | 2mo | $265,000 | $161 | 54 |
| 4767 Golod Way | 0.53mi | 4/2.5 (+1) | 1,642 (+8%) | 6mo | $225,000 | $137 | 53 |
| 4919 Buchli Ln | 0.63mi | 4/2.5 (+1) | 1,644 (+8%) | 5mo | $209,000 | $127 | 49 |
| 5100 River Overlook Way | 0.52mi | 3/2.0 | 1,728 (+13%) | 5mo | $211,000 | $122 | 48 |
Match score weights: distance 35% · size 25% · config 20% · recency 20%. Top-matched comps best support the ARV.
Projected returns pro-forma
-3.0% appreciation · 4.6% rent growth · sell at horizon
- IRR
- -5.5%
- Equity multiple
- 0.79×
- Total profit
- $-11,920
- Equity at exit
- $30,566
- IRR
- 5.7%
- Equity multiple
- 1.45×
- Total profit
- $25,895
- Equity at exit
- $17,725
Cash invested: $57,400 (down + closing). Projections, not guarantees.
Landlord ↔ Tenant lean methodology
- Overall (STATE)
- 90 Strongly Landlord-Friendly
- State Georgia
- 90 Strongly Landlord-Friendly · R+3
- County
- — inherits STATE
- City
- — inherits STATE
ZIP-level market 30038
- Home prices YoY
- -28.0%
- Rents YoY
- 4.6%
- Active inventory
- 320
- Price-to-rent
- 9.0×
Monthly cashflow live
- Estimated rent
- $1,891 high interval (Pro) →
- Mortgage (P&I)
- −$1,075
- Tax from tax record
- −$46 /mo · $549/yr
- Insurance
- −$85
- HOA
- −$0
- Vacancy / Maint / Mgmt
- −$397
- Net cashflow
- $287
Break-even live
UW: 25.0% down · 7.5% · 30yr · 1.5% tax · 5.0% vac · 8.0% maint · 8.0% mgmt
Financing live
Cash to close
- Down payment
- $51,250
- Closing costs
- $6,150
- Reserves months
- —
- Total cash needed
- —
Loan-product check · same deal, 3 products live
Conventional
25% down · 7.5% · 30yr
- Down + closing
- —
- Monthly P&I
- —
- Monthly cashflow
- —
- DSCR
- —
- Eligible?
- —
Personal DTI + credit; lowest rate.
DSCR
20% down · 8.5% · 30yr
- Down + closing
- —
- Monthly P&I
- —
- Monthly cashflow
- —
- DSCR
- —
- Eligible?
- —
No personal income docs; deal must DSCR.
Hard money
10% down · 12.0% · 12mo
- Down + closing
- —
- Monthly P&I
- —
- Monthly cashflow
- —
- DSCR
- —
- Eligible?
- —
Short-term bridge; refi at stabilization.
Rent comps 37 comps
| Address | Beds | Baths | Sqft | Rent | $/sqft | DOM | Units | Dist |
|---|---|---|---|---|---|---|---|---|
| 4618 Idlewood Park Lithonia, GA | 3.0 | 2.5 | 1684 | $1,795 | $1.07 | 20d | 1 | 0.05mi |
| 4609 Post Ridge Ln Lithonia, GA | 3.0 | 2.0 | 1527 | $1,855 | $1.21 | 43d | 1 | 0.05mi |
| 6269 Cathedral Ln Lithonia, GA | 3.0 | 2.0 | 1328 | $1,725 | $1.30 | 12d | 1 | 0.24mi |
| 4636 Forest Creek Ln Lithonia, GA | 3.0 | 2.5 | 1476 | $1,650 | $1.12 | 24d | 1 | 0.25mi |
| 4675 Forest Creek Ln Lithonia, GA | 4.0 | 2.5 | 1854 | $2,200 | $1.19 | 43d | 1 | 0.29mi |
| 6215 Klondike River Rd Lithonia, GA | 4.0 | 3.0 | 2048 | $1,875 | $0.92 | 5d | 1 | 0.29mi |
| 4710 Idlewood Gate Lithonia, GA | 3.0 | 2.5 | 2036 | $2,065 | $1.01 | 5d | 1 | 0.35mi |
| 4474 Carriage Park Dr Lithonia, GA | 4.0 | 3.0 | 1700 | $1,200 | $0.71 | 43d | 1 | 0.37mi |
| 4584 Garden City Dr Lithonia, GA | 4.0 | 2.5 | 1958 | $2,300 | $1.17 | 1d | 1 | 0.38mi |
| 6295 Klondike River Rd Lithonia, GA | 4.0 | 2.5 | 1742 | $1,930 | $1.11 | 5d | 1 | 0.44mi |
| 6265 Leverett Dr Lithonia, GA | 3.0 | 2.0 | 1378 | $1,595 | $1.16 | 24d | 1 | 0.44mi |
| 4651 Jackam Ridge Ct Lithonia, GA | 3.0 | 2.0 | 1441 | $1,970 | $1.37 | 43d | 1 | 0.46mi |
| 4436 Jackam Ridge Ct Lithonia, GA | 3.0 | 2.0 | 1981 | $2,080 | $1.05 | 5d | 1 | 0.51mi |
| 4756 Golod Way Lithonia, GA | 3.0 | 2.0 | 1578 | $1,820 | $1.15 | 24d | 1 | 0.53mi |
| 6354 Klondike River Rd Lithonia, GA | 3.0 | 2.5 | 1521 | $1,830 | $1.20 | 43d | 1 | 0.54mi |
| 4744 Golod Way Lithonia, GA | 3.0 | 2.0 | 1584 | $1,695 | $1.07 | 43d | 1 | 0.55mi |
| 6274 Varnay Ct Stonecrest, GA | 3.0 | 2.0 | 1427 | $1,915 | $1.34 | 15d | 1 | 0.65mi |
| 5014 River Overlook Way Lithonia, GA | 3.0 | 2.5 | 2017 | $2,060 | $1.02 | 24d | 1 | 0.71mi |
| 4393 English Loop Lithonia, GA | 3.0 | 2.0 | 1820 | $1,900 | $1.04 | 19d | 1 | 0.93mi |
| 6609 Carmen Ct Lithonia, GA | 3.0 | 2.0 | 1633 | $1,200 | $0.73 | 17d | 1 | 1.06mi |
| 6613 Chestnut Oaks Rdg Lithonia, GA | 3.0 | 2.5 | 1438 | $1,985 | $1.38 | 5d | 1 | 1.15mi |
| 6506 Chestnut Lake Xing Lithonia, GA | 4.0 | 2.5 | 2014 | $2,060 | $1.02 | 4d | 1 | 1.18mi |
| 6625 Paula Ct Unit Labs Stonecrest, GA | 4.0 | 2.0 | 1925 | $2,000 | $1.04 | 18d | 1 | 1.18mi |
| 6950 Carleen Ct Lithonia, GA | 3.0 | 2.0 | 1784 | $1,945 | $1.09 | 12d | 1 | 1.21mi |
| 6530 Lake Mill Ct Lithonia, GA | 4.0 | 2.0 | 2233 | $1,640 | $0.73 | 12d | 1 | 1.24mi |
| 6700 Browns Mill Ferry Dr Lithonia, GA | 3.0 | 2.0 | 1587 | $1,765 | $1.11 | 5d | 1 | 1.29mi |
| 6626 Browns Mill Ferry Dr Lithonia, GA | 3.0 | 2.0 | 1382 | $1,820 | $1.32 | 3d | 1 | 1.29mi |
| 6957 Mahonia Pl Lithonia, GA | 4.0 | 2.0 | 1560 | $1,931 | $1.24 | 43d | 1 | 1.30mi |
| 6858 Mahonia Pl Lithonia, GA | 3.0 | 2.5 | 1580 | $1,695 | $1.07 | 43d | 1 | 1.37mi |
| 6857 Mahonia Pl Lithonia, GA | 4.0 | 2.5 | 2192 | $1,795 | $0.82 | 43d | 1 | 1.39mi |
| 6989 Setters Way Lithonia, GA | 4.0 | 2.0 | 1526 | $1,795 | $1.18 | 5d | 1 | 1.40mi |
| 6940 Red Bone Way Lithonia, GA | 3.0 | 2.5 | 1494 | $1,949 | $1.30 | 5d | 1 | 1.42mi |
| 7152 Ravenwood Ln Lithonia, GA | 4.0 | 3.0 | 1500 | $1,915 | $1.28 | 43d | 1 | 1.43mi |
| 7020 Setters Way Lithonia, GA | 4.0 | 2.0 | 1573 | $1,819 | $1.16 | 43d | 1 | 1.45mi |
| 7078 Bowie Dr Lithonia, GA | 4.0 | 2.5 | 1571 | $1,781 | $1.13 | 43d | 1 | 1.47mi |
| 7132 Bowie Dr Lithonia, GA | 3.0 | 2.5 | 1571 | $1,904 | $1.21 | 12d | 1 | 1.48mi |
| 7093 Mahonia Pl Lithonia, GA | 3.0 | 2.5 | 1500 | $1,895 | $1.26 | 24d | 1 | 1.49mi |
Listing history 26 events
-
2026-06-18days on market $205,000 Active 30 DOM
-
2026-06-17days on market $205,000 Active 29 DOM
-
2026-06-16days on market $205,000 Active 28 DOM
-
2026-06-15days on market $205,000 Active 27 DOM
-
2026-06-13pricedays on market $205,000 Active 25 DOM
-
2026-06-09days on market $210,000 Active 21 DOM
-
2026-06-08days on market $210,000 Active 20 DOM
-
2026-06-07days on market $210,000 Active 19 DOM
-
2026-06-04days on market $210,000 Active 16 DOM
-
2026-06-03days on market $210,000 Active 15 DOM
-
2026-06-02days on market $210,000 Active 14 DOM
-
2026-06-01days on market $210,000 Active 13 DOM
-
2026-05-31days on market $210,000 Active 12 DOM
-
2026-05-19$210,000 Active
Show marketing remark (51 chars)
Please schedule showings between 11:00am to 7:00pm.
-
2026-05-19$210,000 New 51-char remark
Show marketing remark (51 chars)
Please schedule showings between 11:00am to 7:00pm.
-
2024-03-11status Active
-
2024-03-11historical
-
2024-02-08status Pending
-
2024-02-07historical Active Under Contract
-
2024-01-30status Pending
-
2024-01-29historical Active Under Contract
-
2024-01-01status Pending
-
2023-12-31Active Under Contract
-
2023-12-31historical
-
2023-12-31historical
-
2023-12-11$215,000
ⓘ Source: listings_history table (triggers on properties + properties_extension) + one-shot
backfill from property_details.listing_events for pre-trigger history.
Tax reassessment forecast GA · Resets to sale price
- Current annual tax
- $549 · $46/mo
- Projected year-2 tax
- $1,886 · $157/mo
- Expected delta
- +$1,337/yr (+$111/mo · 243.7%)
ⓘ Screening estimate from a state-policy table — verify with the county assessor before closing.
Climate risk First Street
- Flood 1/10 Low FEMA zone X (unshaded) · 0% chance over 30 yrs
- Wildfire 3/10 Moderate
- Heat 6/10 Major 7 d/yr ≥106°F today · 20 d/yr by 30 yrs out
- Wind 4/10 Moderate 23% chance of damaging wind over 30 yrs
- Air quality 5/10 Major 6 unhealthy d/yr today · 8 by 30 yrs out
Nearby sold comps map
Loading sold comps map…
Walkable amenities ~0.75 mi
Loading nearby amenities…
Taxation est. · year 1
- Rental income
- $22,688
- − Mortgage interest
- −$11,483
- − Property taxes
- −$549
- − Insurance
- −$1,025
- − Repairs & maintenance
- −$1,815
- − Management
- −$1,815
- − Depreciation
- −$5,964
- Taxable income
- $37
- Est. tax owed @ 24.0%
- −$9
- After-tax cash flow
- $3,440/yr
For passive investors: Depreciation is non-cash, so a rental often shows a tax loss while cash-flowing — sheltering income. Rental losses are passive: they offset passive income freely, and up to $25,000/yr can offset ordinary (W-2) income if you actively participate and your MAGI is under $100k (phasing out to $0 by $150k); unused losses carry forward. On sale, claimed depreciation is recaptured at up to 25%, and gains may owe capital-gains tax (a 1031 exchange can defer both). Figures are a year-1 estimate at your 24.0% rate — not tax advice; consult a CPA.
Schools (NCES district)
- District
- Dekalb County
- NCES district ID
- 1301740
- Math proficiency
- 19% ▼ -12.00%
- Reading proficiency
- 28% ▼ -7.00%
- Median HH income
- $51,448
- Composite
- 20.92/100
- National rank
- #8482
- State rank
- #125 of 174 in GA
Livability — Stonecrest
No livability data for this city. (Only ~50 U.S. cities are tracked.)
Census & demographics
- Census place
- Stonecrest, GA
- County
- Dekalb County · 782,738 people
- City population
- 106,165
- Metro
- Atlanta-Sandy Springs-Alpharetta, GA
- Population (ZIP)
- 43,776
- Household income
- $73,694
- Rent vs Own
- Severe rent burden
- 1168.0
Population outlook (DeKalb County) Hauer SSP2
- Today (2025)
- 839,977 people
- By 2030
- 891,768 · +6.2%
- By 2040
- 988,894 · +17.7%
- By 2050
- 1,074,583 · +27.9%
- By 2075
- 1,245,026 · +48.2%
- By 2100
- 1,303,135 · +55.1%
Race, ethnicity, and origin ACS 2023
- Neighborhood character
- Predominantly Black (84%)
- Race & ethnicity
- Black 84% Two or more races 10% Hispanic / Latino 5% White 4% Asian 1%
- Foreign-born
- 12% · Canada, China
- Languages at home
- 90% English-only · Spanish 5% French/Haitian/Cajun 1% Other Indo-European 0%
Political lean MEDSL · DeKalb
- 2024 margin
- Solid D (+64.8) · D 81.9% · R 17.1% · Other 1.0%
- 2008→2024 swing
- +6.1pp toward D · 2008: 58.6pp · 2024: 64.8pp
- All cycles
- 2024: D+64.8 2020: D+67.4 2016: D+64.8 2012: D+56.8 2008: D+58.6
Not yet ingested
- Civics
- —
Market trends
- HPI YoY
- ▼ -74.98%
- Current HPI
- 192.8328
- Rent YoY
- ▲ 4.60%
- Metro
- Atlanta-Sandy Springs-Alpharetta, GA
- State GDP YoY
- ▲ 2.66%
- F500 in state
- 28
Industry mix (Fortune 500 HQ in GA)
| Industry | F500 HQs | Revenue |
|---|---|---|
| Paper / Packaging | 2 | $29B |
|
||
| Retail | 1 | $160B |
|
||
| Transportation / Logistics | 1 | $91B |
|
||
| Airlines | 1 | $62B |
|
||
| Consumer Goods | 1 | $47B |
|
||
| Utilities | 1 | $25B |
|
||
Price history
-2.3% since first listed13 events — show timeline
- 2026-05-19 Listed $210,000 GAMLS
- 2026-05-19 Listed $210,000 FMLS
- 2024-03-11 Relisted — FMLS
- 2024-03-11 Listing Removed — FMLS
- 2024-02-08 Pending — FMLS
- 2024-02-07 Contingent — FMLS
- 2024-01-30 Pending — FMLS
- 2024-01-29 Contingent — FMLS
- 2024-01-01 Pending — FMLS
- 2023-12-31 Listed — FMLS
- 2023-12-31 Listing Removed — GAMLS
- 2023-12-31 Listing Removed — GAMLS
- 2023-12-11 Listed $215,000 GAMLS
Property tax history
-4.8%/yrLatest (2025): $549 · +0.6% YoY. Source: county tax records.
Cash-flow waterfall
monthlySold comps — $/sqft
last 12 mo · ≤1 miLoading sold comps…