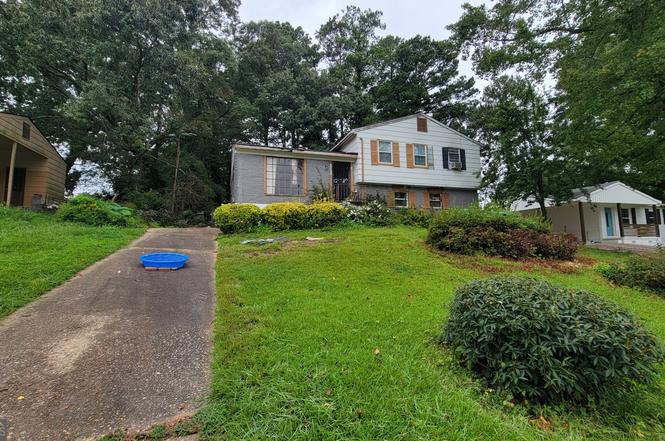
6377 Westbury Rd · Riverdale, GA
Flood risk 1/10 · Minimal
- FEMA flood zone
- X (unshaded)
- Chance of flooding over 30 yrs
- 0.0%
- Est. flood insurance / yr
- $507 – $1,088
Fire risk 3/10 · Minor
- Est. fire insurance / yr
- $963 – $1,789
Heat risk 6/10 · Moderate
- Hot days now (above 104°F)
- 7 days/yr
- Hot days in 30 yrs
- 18 days/yr
Wind risk 6/10 · Moderate
- Chance of severe wind over 30 yrs
- 27.0%
Air-quality risk 4/10 · Minor
- Unhealthy air days now
- 4 days/yr
- Unhealthy air days in 30 yrs
- 7 days/yr
Risk factors via First Street. Map © Google.
Why this score? — see what drove the B grade
The composite is a weighted blend of 9 inputs, each scored 0–100. Each bar is that input's sub-score; the figure is the points it added to the 100-point composite (weight × sub-score).
- Cash flow +27.8/30.0
- ARV discount +15.0/15.0
- DSCR +9.8/10.0
- 1% rule +7.4/10.0
- Livability +3.5/5.0
- Rent growth +2.8/5.0
- Condition / age +2.5/5.0
- Schools +1.3/10.0
- Appreciation +0.0/10.0
$160,000
🖨 Deal sheet 📄 Offer letter ✓ Due diligence
Listing remarks
Split-level home in Riverdale!!!Fixer-upper with tons of potential-perfect for investors or DIY buyers. Located in a quiet neighborhood with a fenced backyard for privacy and an outbuilding for storage. Conveniently close to shopping, dining, and Southern Regional Hospital. As is-cash or conventional only. Home is occupied; please provide at least 2 hours' notice before showing. Schedule appointments through ShowingTime. * * Please submit the offer on a GAR Form * *
Key facts
- Quiet neighborhood
- Fenced backyard
- 0.26 acre lot
Tags
Neighborhood map
What this means for you Summary
Snapshot
- This is a 4-bed/2.0-bath single-family listed at $160k.
Deal economics
- At list price, monthly cash flow is $486 ($6k/yr) — positive.
- The deal already cash-flows at list — no discount required.
- Meets the 1% rule at list price ($2k rent vs $160k).
- Recommended offer: $141k (12.0% below list) — sets the bar for market timing.
- Cap rate 9.9% vs local median 5.5% in Riverdale — top-decile yield for the area; either an underpriced asset or a hidden risk that comps aren't pricing in. Stress-test before assuming the spread holds.
Location & tenants
- Location reads 70/100 on livability (#100 in GA) — a middle-class / working-renter tenant base. Strengths: cost of living A+, housing A+; Watch: crime D, amenities F, commute F.
- Clayton County (suburban): math 11% / reading 20% proficiency, ranked #155 of 174 in GA (top 89%) — low school quality limits family demand, transient renter base, plan for 1-2y turnover; 78% free/reduced lunch — lower-income household profile, screen leases tightly.
- Zoned schools: Riverdale Elementary School (math 8% / reading 12%, grade F, #1,092 of 1,228 statewide, top 91%, 635 students, 90% FRL); Sequoyah Middle School (math 8% / reading 23%, grade F, #396 of 470 statewide, top 84%, 842 students, 90% FRL); Charles R. Drew High School (math 8% / reading 22%, grade F, #297 of 424 statewide, top 74%, 1,652 students, 91% FRL).
- Market conditions: Rents rising (+1.3%/yr); 182 active listings in the ZIP; 31 comparable units currently listed for rent nearby; rentals at typical pace (median 22d on market — plan ~3-4 weeks tenant-placement turnaround); 865 units permitted in Clayton County in 2024 (448 in 5+ unit buildings).
- At $1,987/mo this rent would consume 46% of the median local household income ($52k/yr) (locally 2586% of renters already pay >50% of income on rent) — very limited rent-growth headroom before tenants either downsize or default.
Forward outlook
- Local home prices are declining (-3.0%/yr); year-one equity from $1k of loan paydown is wiped out by about $5k of value loss. Plan a longer hold.
- Clayton County population projected at +29% by 2050 — long-run rental-demand tailwind backs the buy-and-hold thesis.
Negotiation context
- It's been on market 222 days — a 12% lower offer ($141k) is reasonable based on typical stale-listing flexibility.
- 5 sale attempts since 3y ago with the ask held roughly flat each time — persistent listings suggest the price (not the market) is what's stuck; bring a comps-based counter.
- Current owner paid $65k; list at $160k implies a 145% gain — meaningful room to come down on a strong offer.
Risks & watch-outs
- Climate carrying-cost: major wind risk, 27% chance of damaging wind over 30y; extreme-heat days projected 7→18/yr by 2055 (HVAC capex compounding) — expect insurance premiums to compound above CPI over the hold.
Questions for the listing agent
- It's been on market 222 days. Have you received any prior offers? Is the seller open to a 12% concession, seller financing, or rate buy-down credit?
- Built in 1966 — when were the roof, HVAC, electrical panel, plumbing, and water heater last replaced?
- Why hasn't it sold? Are there any deal-killer items the seller is aware of (foundation, flood, title, zoning, code violations)?
- Is there a deadline driving the sale (1031 exchange, divorce, estate, relocation)? That informs how much negotiation room exists.
- Schools are D-rated, which usually means shorter tenancies and higher turnover. Who's the typical renter profile here, and what's been the actual vacancy rate?
- Crime grade is D in this area — have there been break-ins, vandalism, or insurance claims at this property in the last 3 years? What carrier currently insures it and at what premium?
- What's the average days-on-market for RENTAL listings here right now (not sales)? A rising rental-DOM trend means longer vacancies and softer asking-rent achievability than the comps imply.
- What's the recent tenant-quality profile in this submarket — average credit score on applications, eviction rate, late-payment / NSF rate, and stable-employment percentage? A property-management company in the area should have these aggregated.
- How much new for-sale + rental construction is in the pipeline within 1–3 miles? Heavy new supply typically softens prices + rents 12–24 months out; constrained supply supports both.
Investment metrics
- 1% rule
- 1.24% ✓
- Cap rate
- 9.93%
- Cash-on-cash
- 13.01%
- DSCR
- 1.58
- GRM
- 6.7
CMA / ARV
- ARV (on-the-fly)
- $232,329
- Comps found
- 11
Show comp detail 11 sales within ~0.75 mi
| Address | Dist | Beds/Ba | Sqft | Sold | Price | $/sf | Match |
|---|---|---|---|---|---|---|---|
| 6377 Westbury Rd | 0.00mi | 4/2.0 | 1,801 (0%) | 1mo | $134,000 | $74 | 99 |
| 146 Scarsdale Dr | 0.10mi | 4/2.0 | 1,792 (-0%) | 13mo | $132,000 | $74 | 83 |
| 31 Mcferrin Cir | 0.31mi | 4/2.0 | 1,838 (+2%) | 0mo | $235,000 | $128 | 82 |
| 371 Roxbury Dr | 0.72mi | 4/2.5 | 1,705 (-5%) | 2mo | $247,000 | $145 | 54 |
| 370 Valiant Ln | 0.58mi | 3/2.0 (-1) | 1,651 (-8%) | 3mo | $213,000 | $129 | 52 |
| 6111 Johnson Rd | 0.72mi | 3/1.0 (-1) | 1,838 (+2%) | 6mo | $109,000 | $59 | 49 |
| 106 Gatwick Ct | 0.65mi | 3/2.5 (-1) | 1,652 (-8%) | 1mo | $232,500 | $141 | 48 |
| 6650 Baldwin Ct | 0.75mi | 5/2.0 (+1) | 1,850 (+3%) | 14mo | $279,000 | $151 | 44 |
| 243 Roxbury Dr | 0.57mi | 3/2.0 (-1) | 2,000 (+11%) | 9mo | $325,000 | $163 | 42 |
| 107 Gatwick Ct | 0.62mi | 3/2.5 (-1) | 1,638 (-9%) | 9mo | $251,000 | $153 | 41 |
| 374 Roxbury Dr | 0.72mi | 4/3.0 | 2,014 (+12%) | 21mo | $150,000 | $74 | 25 |
Match score weights: distance 35% · size 25% · config 20% · recency 20%. Top-matched comps best support the ARV.
Projected returns pro-forma
-3.0% appreciation · 1.3% rent growth · sell at horizon
- IRR
- 1.0%
- Equity multiple
- 1.04×
- Total profit
- $1,671
- Equity at exit
- $23,857
- IRR
- 8.9%
- Equity multiple
- 1.63×
- Total profit
- $28,087
- Equity at exit
- $13,834
Cash invested: $44,800 (down + closing). Projections, not guarantees.
Landlord ↔ Tenant lean methodology
- Overall (STATE)
- 90 Strongly Landlord-Friendly
- State Georgia
- 90 Strongly Landlord-Friendly · R+3
- County
- — inherits STATE
- City
- — inherits STATE
ZIP-level market 30274
- Home prices YoY
- -19.6%
- Rents YoY
- 1.3%
- Active inventory
- 182
- Price-to-rent
- 6.7×
Monthly cashflow live
- Estimated rent
- $1,987 high interval (Pro) →
- Mortgage (P&I)
- −$839
- Tax from tax record
- −$179 /mo · $2,146/yr
- Insurance
- −$67
- HOA
- −$0
- Vacancy / Maint / Mgmt
- −$417
- Net cashflow
- $486
Break-even live
UW: 25.0% down · 7.5% · 30yr · 1.5% tax · 5.0% vac · 8.0% maint · 8.0% mgmt
Financing live
Cash to close
- Down payment
- $40,000
- Closing costs
- $4,800
- Reserves months
- —
- Total cash needed
- —
Loan-product check · same deal, 3 products live
Conventional
25% down · 7.5% · 30yr
- Down + closing
- —
- Monthly P&I
- —
- Monthly cashflow
- —
- DSCR
- —
- Eligible?
- —
Personal DTI + credit; lowest rate.
DSCR
20% down · 8.5% · 30yr
- Down + closing
- —
- Monthly P&I
- —
- Monthly cashflow
- —
- DSCR
- —
- Eligible?
- —
No personal income docs; deal must DSCR.
Hard money
10% down · 12.0% · 12mo
- Down + closing
- —
- Monthly P&I
- —
- Monthly cashflow
- —
- DSCR
- —
- Eligible?
- —
Short-term bridge; refi at stabilization.
Rent comps 31 comps
| Address | Beds | Baths | Sqft | Rent | $/sqft | DOM | Units | Dist |
|---|---|---|---|---|---|---|---|---|
| 218 Ridge Trl Riverdale, GA | 4.0 | 1.5 | 1826 | $2,100 | $1.15 | 5d | 1 | 0.27mi |
| 6447 River Park Dr Riverdale, GA | 3.0 | 2.0 | 1320 | $1,650 | $1.25 | 20d | 1 | 0.47mi |
| 6433 Valley Brook Dr Riverdale, GA | 4.0 | 2.0 | 2000 | $2,500 | $1.25 | 24d | 1 | 0.54mi |
| 6748 Black Twig Ct Riverdale, GA | 5.0 | 2.0 | 1850 | $2,125 | $1.15 | 5d | 1 | 0.79mi |
| 504 Pinecrest Dr Riverdale, GA | 4.0 | 2.0 | 1500 | $1,700 | $1.13 | 24d | 1 | 0.83mi |
| 128 Alexander Ct Riverdale, GA | 4.0 | 2.0 | 1280 | $1,956 | $1.53 | 44d | 1 | 0.87mi |
| 634 Roxbury Dr Riverdale, GA | 4.0 | 2.0 | 1400 | $1,745 | $1.25 | 13d | 1 | 0.89mi |
| 330 Arrowhead Blvd Jonesboro, GA | 1.0–3.0 | 1.0–2.5 | 1180 | $1,199 | $1.02 | 43d | 1 | 0.89mi |
| 6791 Gillis Ct Riverdale, GA | 4.0 | 2.0 | 1500 | $1,901 | $1.27 | 22d | 1 | 0.90mi |
| 161 Shenandoah Dr Riverdale, GA | 3.0 | 2.5 | 1708 | $1,900 | $1.11 | 43d | 1 | 0.91mi |
| 6232 Lance Ln Riverdale, GA | 3.0 | 2.0 | 1900 | $1,959 | $1.03 | 24d | 1 | 0.91mi |
| 237 Shenandoah Dr Riverdale, GA | 3.0 | 2.5 | 1417 | $1,435 | $1.01 | 5d | 1 | 1.00mi |
| 428 Eagles Nest Way Riverdale, GA | 4.0 | 2.0 | 1564 | $2,100 | $1.34 | 43d | 1 | 1.06mi |
| 389 Eagles Flight Ln Riverdale, GA | 3.0 | 2.0 | 1308 | $1,650 | $1.26 | 4d | 1 | 1.06mi |
| 228 Morrow Rd Forest Park, GA | 1.0–3.0 | 1.0–2.5 | 1125 | $1,579 | $1.40 | 2d | 34 | 1.16mi |
| 461 Old Dixie Way Forest Park, GA | 1.0–3.0 | 1.0–2.0 | 1131 | $1,400 | $1.24 | 22d | 1 | 1.18mi |
| 6763 Brookwood Cir Jonesboro, GA | 3.0 | 1.5 | 1283 | $1,391 | $1.08 | 43d | 1 | 1.19mi |
| 465 Eagles Crossing Cir Riverdale, GA | 3.0 | 2.0 | 1315 | $1,500 | $1.14 | 43d | 1 | 1.24mi |
| 471 Eagles Crossing Cir Riverdale, GA | 3.0 | 2.5 | 1481 | $1,700 | $1.15 | 43d | 1 | 1.25mi |
| 501 Roberts Dr Riverdale, GA | 1.0–3.0 | 1.0–2.0 | 1022 | $1,344 | $1.31 | 2d | 12 | 1.26mi |
| 6441 Dunmoor Dr Jonesboro, GA | 5.0 | 3.5 | 1938 | $3,000 | $1.55 | 19d | 1 | 1.27mi |
| 293 Brookview Dr Riverdale, GA | 4.0 | 2.5 | 1528 | $1,900 | $1.24 | 10d | 1 | 1.29mi |
| 387 Brookview Dr Riverdale, GA | 4.0 | 2.5 | 1528 | $1,795 | $1.17 | 22d | 1 | 1.30mi |
| 6839 Sandy Creek Dr Riverdale, GA | 4.0 | 2.0 | 1566 | $4,600 | $2.94 | 43d | 1 | 1.31mi |
| 7067 Brookview Cir Riverdale, GA | 4.0 | 3.0 | 1528 | $1,850 | $1.21 | 43d | 1 | 1.32mi |
| 626 Hickory Ct Forest Park, GA | 3.0 | 2.0 | 1664 | $1,595 | $0.96 | 3d | 1 | 1.36mi |
| 7092 Brookview Way Riverdale, GA | 4.0 | 3.0 | 1528 | $1,900 | $1.24 | 13d | 1 | 1.39mi |
| 7130 Brookview Way Riverdale, GA | 3.0 | 2.5 | 1528 | $1,713 | $1.12 | 24d | 1 | 1.40mi |
| 828 Overlook Ter Atlanta, GA | 3.0 | 2.5 | 1270 | $1,495 | $1.18 | 3d | 1 | 1.41mi |
| 417 Patrick Henry Ct Riverdale, GA | 3.0 | 2.0 | 1350 | $1,650 | $1.22 | 13d | 1 | 1.43mi |
| 263 Elm Forest Way Riverdale, GA | 4.0 | 3.0 | 2006 | $2,173 | $1.08 | 22d | 1 | 1.49mi |
Listing history 13 events
-
2026-04-23status Under Contract
-
2026-03-01status Back On Market
-
2026-02-27historical
-
2026-01-01status Back On Market
-
2025-12-31historical
-
2025-09-27status Back On Market
-
2025-09-22status Under Contract
-
2025-09-04$160,000 New
-
2024-02-29historical
-
2024-01-17price $200,000
-
2023-10-05price $210,000
-
2023-08-28$225,000 New
-
1995-10-06soldstatus $65,200
ⓘ Source: listings_history table (triggers on properties + properties_extension) + one-shot
backfill from property_details.listing_events for pre-trigger history.
Tax reassessment forecast GA · Resets to sale price
- Current annual tax
- $2,146 · $179/mo
- Projected year-2 tax
- $2,146 · $179/mo
- Expected delta
- $0/yr ($0/mo · 0.0%)
ⓘ Screening estimate from a state-policy table — verify with the county assessor before closing.
Climate risk First Street
- Flood 1/10 Low FEMA zone X (unshaded) · 0% chance over 30 yrs
- Wildfire 3/10 Moderate
- Heat 6/10 Major 7 d/yr ≥104°F today · 18 d/yr by 30 yrs out
- Wind 6/10 Major 27% chance of damaging wind over 30 yrs
- Air quality 4/10 Moderate 4 unhealthy d/yr today · 7 by 30 yrs out
Nearby sold comps map
Loading sold comps map…
Walkable amenities ~0.75 mi
Loading nearby amenities…
Taxation est. · year 1
- Rental income
- $23,850
- − Mortgage interest
- −$8,962
- − Property taxes
- −$2,146
- − Insurance
- −$800
- − Repairs & maintenance
- −$1,908
- − Management
- −$1,908
- − Depreciation
- −$4,655
- Taxable income
- $3,471
- Est. tax owed @ 24.0%
- −$833
- After-tax cash flow
- $4,994/yr
For passive investors: Depreciation is non-cash, so a rental often shows a tax loss while cash-flowing — sheltering income. Rental losses are passive: they offset passive income freely, and up to $25,000/yr can offset ordinary (W-2) income if you actively participate and your MAGI is under $100k (phasing out to $0 by $150k); unused losses carry forward. On sale, claimed depreciation is recaptured at up to 25%, and gains may owe capital-gains tax (a 1031 exchange can defer both). Figures are a year-1 estimate at your 24.0% rate — not tax advice; consult a CPA.
Schools (NCES district)
- District
- Clayton County
- NCES district ID
- 1301230
- Math proficiency
- 11% ▼ -13.00%
- Reading proficiency
- 20% ▼ -9.00%
- Median HH income
- $42,266
- Composite
- 13.41/100
- National rank
- #9527
- State rank
- #155 of 174 in GA
Livability — Riverdale
- Score
- 70/100
- State rank
- #100
- US rank
- #7907
Category grades
Schools grade is shown separately in the Schools card above.
Census & demographics
- County
- Clayton County · 230,153 people
- City population
- 61,126
- Metro
- Atlanta-Sandy Springs-Alpharetta, GA
- Population (ZIP)
- 34,081
- Household income
- $52,209
- Rent vs Own
- Severe rent burden
- 2586.0
Population outlook (Clayton County) Hauer SSP2
- Today (2025)
- 310,777 people
- By 2030
- 329,762 · +6.1%
- By 2040
- 368,052 · +18.4%
- By 2050
- 401,196 · +29.1%
- By 2075
- 472,488 · +52.0%
- By 2100
- 500,446 · +61.0%
Race, ethnicity, and origin ACS 2023
- Neighborhood character
- Predominantly Black (76%)
- Race & ethnicity
- Black 76% Hispanic / Latino 14% Two or more races 5% Asian 5% White 5%
- Hispanic origin (detail)
- Mexican 9% Puerto Rican 1%
- Foreign-born
- 15% · Canada, Vietnam
- Languages at home
- 80% English-only · Spanish 12% Vietnamese 2% Other Asian/Pacific 2%
Political lean MEDSL · Clayton
- 2024 margin
- Solid D (+69.2) · D 84.3% · R 15.1%
- 2008→2024 swing
- +2.8pp toward D · 2008: 66.4pp · 2024: 69.2pp
- All cycles
- 2024: D+69.2 2020: D+70.9 2016: D+71.9 2012: D+70.1 2008: D+66.4
Not yet ingested
- Civics
- —
Market trends
- HPI YoY
- ▼ -57.82%
- Current HPI
- 236.3592
- Rent YoY
- ▲ 1.30%
- Metro
- Atlanta-Sandy Springs-Alpharetta, GA
- State GDP YoY
- ▲ 2.66%
- F500 in state
- 28
Industry mix (Fortune 500 HQ in GA)
| Industry | F500 HQs | Revenue |
|---|---|---|
| Paper / Packaging | 2 | $29B |
|
||
| Retail | 1 | $160B |
|
||
| Transportation / Logistics | 1 | $91B |
|
||
| Airlines | 1 | $62B |
|
||
| Consumer Goods | 1 | $47B |
|
||
| Utilities | 1 | $25B |
|
||
Price history
+145.4% since first listed13 events — show timeline
- 2026-04-23 Pending — GAMLS
- 2026-03-01 Relisted — GAMLS
- 2026-02-27 Listing Removed — GAMLS
- 2026-01-01 Relisted — GAMLS
- 2025-12-31 Listing Removed — GAMLS
- 2025-09-27 Relisted — GAMLS
- 2025-09-22 Pending — GAMLS
- 2025-09-04 Listed $160,000 GAMLS
- 2024-02-29 Listing Removed — GAMLS
- 2024-01-17 Price Changed $200,000 GAMLS
- 2023-10-05 Price Changed $210,000 GAMLS
- 2023-08-28 Listed $225,000 GAMLS
- 1995-10-06 Sold (Public Records) $65,200 Public Records
Property tax history
+5.6%/yrLatest (2025): $2,146 · +1.8% YoY. Source: county tax records.
Cash-flow waterfall
monthlySold comps — $/sqft
last 12 mo · ≤1 miLoading sold comps…