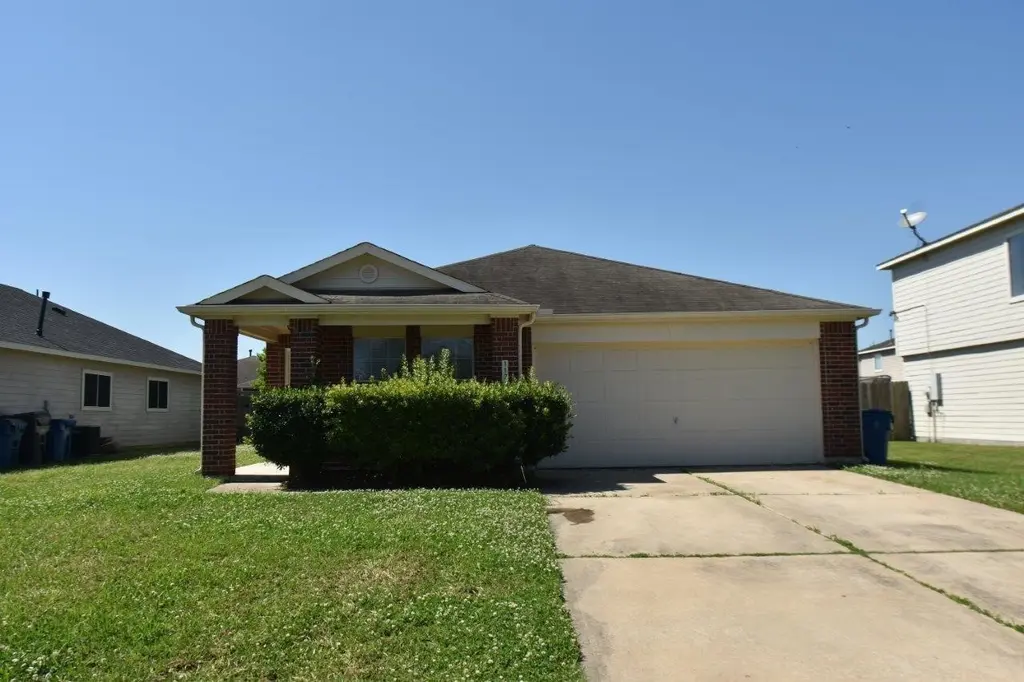
1126 Desert Oasis Ln · Rosenberg, TX
Flood risk 3/10 · Minor
- FEMA flood zone
- X (unshaded)
- Chance of flooding over 30 yrs
- 0.13%
- Est. flood insurance / yr
- $507 – $1,088
Fire risk 3/10 · Minor
- Est. fire insurance / yr
- $1,222 – $2,270
Heat risk 9/10 · Severe
- Hot days now (above 110°F)
- 7 days/yr
- Hot days in 30 yrs
- 24 days/yr
Wind risk 9/10 · Severe
- Chance of severe wind over 30 yrs
- 99.0%
Air-quality risk 2/10 · Minimal
- Unhealthy air days now
- 1 days/yr
- Unhealthy air days in 30 yrs
- 1 days/yr
Risk factors via First Street. Map © Google.
Why this score? — see what drove the D grade
The composite is a weighted blend of 9 inputs, each scored 0–100. Each bar is that input's sub-score; the figure is the points it added to the 100-point composite (weight × sub-score).
- ARV discount +12.2/15.0
- Cash flow +9.9/30.0
- Schools +4.6/10.0
- 1% rule +4.2/10.0
- Livability +3.1/5.0
- DSCR +2.8/10.0
- Condition / age +2.5/5.0
- Rent growth +2.3/5.0
- Appreciation +0.0/10.0
$220,000
🖨 Deal sheet (PDF) 📄 Offer letter ✓ Due diligence
Listing remarks
ABSOLUTELY BEAUTIFUL SINGLE STORY HOME IN IMMACULATE MOVE-IN CONDITION! SPACIOUS OPEN FLOOR PLAN FOR CASUAL FAMILY LIVING. FEATURES: SECLUDED PRIMARY BEDROOM SUITE, HOME OFFICE/STUDY CAN ALSO BE USED AS A 4TH BEDROOM, COVERED REAR PATIO. FABULOUS LOCATION! NEAR TO US-59.
Key facts
- Covered rear patio
- Single story home
- Home office study
Tags
Property features AI
Finance
- HOA & community: Association: Montage Community Services; Annual association fee $462 (includes recreation facilities); Community pool; Curbs
Exterior
- Parking: Attached garage with automatic garage door opener; 2-car garage
- Utilities: Public water; Public sewer
- Home design: Residential property; Built in 2007; Slab foundation; Composition roof; Builder: Fox & Jacobs; Total living area 1,634
- Construction: Brick and cement siding construction
- Exterior features: Fence around backyard; Subdivision setting; Concrete road surface
Interior
- Kitchen: Dishwasher; Free-standing range; Gas range; Oven; Microwave; Disposal; Pantry
- Bedrooms: Three bedrooms on the first floor (11x10, 12x11, 16x12)
- Flooring: Carpet; Tile
- Bathrooms: Two full bathrooms
- Heating & cooling: Central heating (gas); Central electric air conditioning
- Interior features: Double vanity; Kitchen/open-concept family room; Pantry; Soaking tub; Separate shower; Combination tub/shower; Programmable thermostat; Low emissivity windows
- Laundry & utility: Washer hookup; Electric dryer hookup; Gas dryer hookup; Utility room on first floor
Neighborhood map
What this means for you Summary
Snapshot
- This is a 3-bed/2.0-bath single-family listed at $220k.
Deal economics
- At list price, monthly cash flow is $-135 ($-2k/yr) — negative.
- To cash-flow at today's rent, offer at most $196k (10.8% below list).
- To meet the 1% rule (rent ≥ 1% of price), the offer needs to be $202k (8.1% below list).
- Recommended offer: $196k (10.8% below list) — sets the bar for cash-flow.
- Cap rate 5.6% vs local median 3.4% in Rosenberg — top-decile yield for the area; either an underpriced asset or a hidden risk that comps aren't pricing in. Stress-test before assuming the spread holds.
Location & tenants
- Location reads 62/100 on livability (#922 in TX) — a middle-class / working-renter tenant base. Strengths: cost of living A+, housing A+, crime B; Watch: amenities F, commute F, health & safety F.
- Lamar CISD (suburban): math 50% / reading 53% proficiency, ranked #116 of 826 in TX (top 14%) — acceptable for families but not a draw, mixed tenant base, ~2y average lease.
- Zoned schools: Meyer El (math 25% / reading 22%, grade F, #3,247 of 4,322 statewide, top 76%, 704 students, 74% FRL); George J H (math 27% / reading 28%, grade F, #1,156 of 1,662 statewide, top 71%, 1,173 students, 81% FRL); B F Terry H S (math 34% / reading 41%, grade F, #888 of 1,632 statewide, top 55%, 1,739 students, 74% FRL) — zoned schools average 76% FRL vs 43% district-wide (34 pts higher); higher-poverty schools than district average — tighter screening recommended.
- Zoned-school proficiency averages 30% at this address vs 52% district-wide (-22 pts) — the specific schools serving this property underperform the Lamar CISD average; the district grade overstates school quality for this exact location.
- Market conditions: Rents soft (-1.0%/yr); 728 active listings in the ZIP; 7 comparable units currently listed for rent nearby; rentals lingering (median 46d on market — plan ~5-8 weeks vacancy on turnover, expect pricing pressure); 57% of comp listings sitting > 30 days — soft ceiling on asking rent; 12,093 units permitted in Fort Bend County in 2024 (815 in 5+ unit buildings).
- This rent runs 33% of the median local income ($73k/yr) — at the standard rent-burdened threshold; future hikes will face affordability resistance.
Forward outlook
- Local home prices are declining (-3.0%/yr); year-one equity from $2k of loan paydown is wiped out by about $7k of value loss. Plan a longer hold.
- Fort Bend County population projected at +75% by 2050 — long-run rental-demand tailwind backs the buy-and-hold thesis.
Negotiation context
- It's been on market 27 days — a 2% lower offer ($217k) is reasonable based on typical stale-listing flexibility.
- 6 sale attempts since 14y ago with the ask held roughly flat each time — persistent listings suggest the price (not the market) is what's stuck; bring a comps-based counter.
Risks & watch-outs
- Climate carrying-cost: severe wind risk, 99% chance of damaging wind over 30y; extreme-heat days projected 7→24/yr by 2055 (HVAC capex compounding) — expect insurance premiums to compound above CPI over the hold.
Questions for the listing agent
- What do current leases actually rent for vs. the listed asking? Can we see a recent rent roll and the last 12 months of T-12 income?
- What does the HOA fee cover, when was the last increase, and are there any pending special assessments or reserve-fund shortfalls?
- Is there a deadline driving the sale (1031 exchange, divorce, estate, relocation)? That informs how much negotiation room exists.
- Schools are D-rated, which usually means shorter tenancies and higher turnover. Who's the typical renter profile here, and what's been the actual vacancy rate?
- The area grade is low — what's the realistic commute time and amenity access for the typical tenant pool here? Any planned neighborhood developments (good or bad) we should know about?
- What's the average days-on-market for RENTAL listings here right now (not sales)? A rising rental-DOM trend means longer vacancies and softer asking-rent achievability than the comps imply.
- What's the recent tenant-quality profile in this submarket — average credit score on applications, eviction rate, late-payment / NSF rate, and stable-employment percentage? A property-management company in the area should have these aggregated.
- How much new for-sale + rental construction is in the pipeline within 1–3 miles? Heavy new supply typically softens prices + rents 12–24 months out; constrained supply supports both.
Investment metrics
- 1% rule
- 0.92% ✗
- Cap rate
- 5.56%
- Cash-on-cash
- -2.63%
- DSCR
- 0.88
- GRM
- 9.1
CMA / ARV
- ARV (median comp)
- $245,854
- List price
- $220,000
- Delta
- -10.52%
- Verdict
- UNDERPRICED
- Comps
- 20 within 1.0 mi
Show comp detail 10 sales within ~0.75 mi
| Address | Dist | Beds/Ba | Sqft | Sold | Price | $/sf | Match |
|---|---|---|---|---|---|---|---|
| 1126 Desert Oasis Ln | 0.00mi | 3/2.0 | 1,634 (0%) | 0mo | $220,000 | $135 | 100 |
| 1123 Desert Springs Ln | 0.03mi | 3/2.5 | 1,796 (+10%) | 7mo | $235,000 | $131 | 74 |
| 1210 Athea Way | 0.27mi | 3/2.5 | 1,709 (+5%) | 7mo | $259,900 | $152 | 72 |
| 1110 Desert Springs Ln | 0.07mi | 3/2.0 | 1,560 (-4%) | 24mo | $249,000 | $160 | 70 |
| 1307 Pease River Ln | 0.15mi | 3/2.0 | 1,512 (-8%) | 16mo | $255,000 | $169 | 67 |
| 1327 Athea Way | 0.30mi | 3/2.0 | 1,521 (-7%) | 12mo | $245,000 | $161 | 64 |
| 815 Coffee Mill Creek Ln | 0.22mi | 3/2.5 | 1,782 (+9%) | 16mo | $275,000 | $154 | 60 |
| 519 Wild Cotton Rd | 0.32mi | 3/2.0 | 1,811 (+11%) | 18mo | $229,900 | $127 | 52 |
| 921 Bernard Ave | 0.75mi | 3/2.0 | 1,666 (+2%) | 19mo | $320,000 | $192 | 46 |
| 802 Bernard Ave | 0.71mi | 3/2.0 | 1,530 (-6%) | 14mo | $289,900 | $189 | 44 |
Match score weights: distance 35% · size 25% · config 20% · recency 20%. Top-matched comps best support the ARV.
Projected returns pro-forma
-3.0% appreciation · 0.0% rent growth · sell at horizon
- IRR
- -24.5%
- Equity multiple
- 0.19×
- Total profit
- $-50,019
- Equity at exit
- $32,803
- IRR
- -35.0%
- Equity multiple
- -0.25×
- Total profit
- $-76,887
- Equity at exit
- $19,022
Cash invested: $61,600 (down + closing). Projections, not guarantees.
Landlord ↔ Tenant lean methodology
- Overall (STATE)
- 87 Strongly Landlord-Friendly
- State Texas
- 87 Strongly Landlord-Friendly · R+5
- County
- — inherits STATE
- City
- — inherits STATE
ZIP-level market 77471
- Home prices YoY
- -19.3%
- Rents YoY
- -1.0%
- Active inventory
- 728
- Price-to-rent
- 9.1×
Monthly cashflow live
- Estimated rent
- $2,023 high interval (Pro) →
- Mortgage (P&I)
- −$1,154
- Tax from tax record
- −$449 /mo · $5,382/yr
- Insurance
- −$92
- HOA
- −$39
- Vacancy / Maint / Mgmt
- −$425
- Net cashflow
- $-135
Break-even live
Sensitivity live
| Price | -10% $-11 | -5% $-73 | +0% $-135 | +5% $-197 | +10% $-260 |
|---|---|---|---|---|---|
| Rent | -10% $-295 | -5% $-215 | +0% $-135 | +5% $-55 | +10% $25 |
| Rate | -1.0pp $-24 | -0.5pp $-79 | base $-135 | +0.5pp $-192 | +1.0pp $-250 |
UW: 25.0% down · 7.5% · 30yr · 1.5% tax · 5.0% vac · 8.0% maint · 8.0% mgmt
Financing live
Cash to close
- Down payment
- $55,000
- Closing costs
- $6,600
- Reserves months
- —
- Total cash needed
- —
Loan-product check · same deal, 3 products live
Conventional
25% down · 7.5% · 30yr
- Down + closing
- —
- Monthly P&I
- —
- Monthly cashflow
- —
- DSCR
- —
- Eligible?
- —
Personal DTI + credit; lowest rate.
DSCR
20% down · 8.5% · 30yr
- Down + closing
- —
- Monthly P&I
- —
- Monthly cashflow
- —
- DSCR
- —
- Eligible?
- —
No personal income docs; deal must DSCR.
Hard money
10% down · 12.0% · 12mo
- Down + closing
- —
- Monthly P&I
- —
- Monthly cashflow
- —
- DSCR
- —
- Eligible?
- —
Short-term bridge; refi at stabilization.
Rent comps 7 comps
| Address | Beds | Baths | Sqft | Rent | $/sqft | DOM | Units | Dist |
|---|---|---|---|---|---|---|---|---|
| 1621 Perennial Ln Rosenberg, TX | 3.0 | 2.5 | 1792 | $1,831 | $1.02 | 0d | 1 | 0.23mi |
| 1804 Spring Acres Dr Rosenberg, TX | 3.0–4.0 | 2.0–2.5 | 1670 | $2,320 | $1.39 | 0d | 1 | 0.72mi |
| 27315 Southwest Fwy Rosenberg, TX | 3.0 | 2.0 | 1177 | $1,570 | $1.33 | 45d | 1 | 0.72mi |
| 4516 Bartagrass Dr Richmond, TX | 4.0 | 2.0 | 2160 | $3,850 | $1.78 | 45d | 1 | 1.16mi |
| 3419 Fountains Dr Unit 3174 Rosenberg, TX | 3.0 | 2.0 | 1135 | $1,669 | $1.47 | 0d | 1 | 1.35mi |
| 3419 Fountains Dr Unit 3452 Rosenberg, TX | 3.0 | 2.0 | 1177 | $1,720 | $1.46 | 45d | 1 | 1.35mi |
| 909 Klare Ave Rosenberg, TX | 3.0 | 2.0 | 1836 | $1,895 | $1.03 | 45d | 1 | 1.46mi |
HOA detail
- Monthly dues
- $39 · $468/yr
Listing history 17 events
-
2026-05-15status Pending 271-char remark
-
2026-05-14status Pending 271-char remark
-
2026-05-07status Pending 271-char remark
-
2026-04-30price $220,000 271-char remark
-
2026-04-20$225,000 Active 271-char remark
-
2026-04-19historical
-
2026-04-18$230,000 Active
-
2026-04-07historical
-
2026-03-27$235,000 Active
-
2026-03-26historical
-
2026-03-04$240,000 Active
-
2026-03-04historical
-
2026-02-18$250,000 Active
-
2012-02-13soldstatus
-
2012-02-03soldstatus
-
2012-01-30historical
-
2012-01-09$79,000
ⓘ Source: listings_history table (triggers on properties + properties_extension) + one-shot
backfill from property_details.listing_events for pre-trigger history.
Tax reassessment forecast TX · Resets to sale price
- Current annual tax
- $5,382 · $449/mo
- Projected year-2 tax
- $5,382 · $449/mo
- Expected delta
- $0/yr ($0/mo · 0.0%)
ⓘ Screening estimate from a state-policy table — verify with the county assessor before closing.
Climate risk First Street
- Flood 3/10 Moderate FEMA zone X (unshaded) · 13% chance over 30 yrs
- Wildfire 3/10 Moderate
- Heat 9/10 Extreme 7 d/yr ≥110°F today · 24 d/yr by 30 yrs out
- Wind 9/10 Extreme 99% chance of damaging wind over 30 yrs
- Air quality 2/10 Low 1 unhealthy d/yr today · 1 by 30 yrs out
Nearby sold comps map
Loading sold comps map…
Walkable amenities ~0.75 mi
Loading nearby amenities…
Taxation est. · year 1
- Rental income
- $24,270
- − Mortgage interest
- −$12,323
- − Property taxes
- −$5,382
- − Insurance
- −$1,100
- − Repairs & maintenance
- −$1,942
- − Management
- −$1,942
- − HOA
- −$468
- − Depreciation
- −$6,400
- Taxable loss
- −$5,287
- Est. tax savings @ 24.0%
- +$1,269
- After-tax cash flow
- $-352/yr
For passive investors: Depreciation is non-cash, so a rental often shows a tax loss while cash-flowing — sheltering income. Rental losses are passive: they offset passive income freely, and up to $25,000/yr can offset ordinary (W-2) income if you actively participate and your MAGI is under $100k (phasing out to $0 by $150k); unused losses carry forward. On sale, claimed depreciation is recaptured at up to 25%, and gains may owe capital-gains tax (a 1031 exchange can defer both). Figures are a year-1 estimate at your 24.0% rate — not tax advice; consult a CPA.
Schools (NCES district)
- District
- Lamar CISD
- NCES district ID
- 4826580
- Math proficiency
- 50% ▼ -12.00%
- Reading proficiency
- 53% ▼ -4.00%
- Median HH income
- $75,213
- Composite
- 46.43/100
- National rank
- #2452
- State rank
- #116 of 826 in TX
Livability — Rosenberg
- Score
- 62/100
- State rank
- #922
- US rank
- #16414
Category grades
Schools grade is shown separately in the Schools card above.
Census & demographics
- Census place
- Rosenberg, TX
- County
- Fort Bend County · 836,777 people
- City population
- 115,151
- Metro
- Houston-The Woodlands-Sugar Land, TX
- Population (ZIP)
- 45,325
- Household income
- $73,186
- Rent vs Own
- Severe rent burden
- 1688.0
Population outlook (Fort Bend County) Hauer SSP2
- Today (2025)
- 1,004,526 people
- By 2030
- 1,153,104 · +14.8%
- By 2040
- 1,453,718 · +44.7%
- By 2050
- 1,753,781 · +74.6%
- By 2075
- 2,455,772 · +144.5%
- By 2100
- 2,930,528 · +191.7%
Race, ethnicity, and origin ACS 2023
- Neighborhood character
- Diverse neighborhood (Simpson 0.61)
- Race & ethnicity
- Hispanic / Latino 56% White 23% Two or more races 21% Black 12% Asian 7%
- Hispanic origin (detail)
- Mexican 46%
- Common ancestry
- Romanian 1% Lithuanian 1% Slovak 1%
- Foreign-born
- 18% · Canada, China, Vietnam
- Languages at home
- 57% English-only · Spanish 35% Tagalog/Filipino 2% Other Indo-European 1%
Political lean MEDSL · Fort Bend
- 2024 margin
- Toss-up / Even · D 49.5% · R 47.9% · Other 2.6%
- 2008→2024 swing
- +4.0pp toward D · 2008: -2.4pp · 2024: 1.6pp
- All cycles
- 2024: D+1.6 2020: D+10.6 2016: D+6.6 2012: R+6.8 2008: R+2.4
Not yet ingested
- Civics
- —
Market trends
- HPI YoY
- ▼ -74.06%
- Current HPI
- 309.5425
- Rent YoY
- ▼ -0.97%
- Metro
- Houston-The Woodlands-Sugar Land, TX
- State GDP YoY
- ▲ 3.95%
- F500 in state
- 110
Industry mix (Fortune 500 HQ in TX)
| Industry | F500 HQs | Revenue |
|---|---|---|
| Energy | 16 | $1,198B |
|
||
| Technology | 5 | $198B |
|
||
| Engineering / Construction | 4 | $72B |
|
||
| Energy Services | 3 | $60B |
|
||
| Utilities | 3 | $41B |
|
||
| Healthcare | 2 | $330B |
|
||
Price history
+178.5% since first listed19 events — show timeline
- 2026-06-10 Sold (MLS) — HARMLS
- 2026-05-20 Pending — HARMLS
- 2026-05-15 Pending — HARMLS
- 2026-05-14 Pending — HARMLS
- 2026-05-07 Pending — HARMLS
- 2026-04-30 Price Changed $220,000 HARMLS
- 2026-04-20 Listed $225,000 HARMLS
- 2026-04-19 Listing Removed — HARMLS
- 2026-04-18 Listed $230,000 HARMLS
- 2026-04-07 Listing Removed — HARMLS
- 2026-03-27 Listed $235,000 HARMLS
- 2026-03-26 Listing Removed — HARMLS
- 2026-03-04 Listing Removed — HARMLS
- 2026-03-04 Listed $240,000 HARMLS
- 2026-02-18 Listed $250,000 HARMLS
- 2012-02-13 Sold (Public Records) — Public Records
- 2012-02-03 Sold (MLS) — HARMLS
- 2012-01-30 Listing Removed — HARMLS
- 2012-01-09 Listed $79,000 HARMLS
Property tax history
+7.2%/yrLatest (2025): $5,382 · -0.0% YoY. Source: county tax records.
Cash-flow waterfall
monthlySold comps — $/sqft
last 12 mo · ≤1 miLoading sold comps…