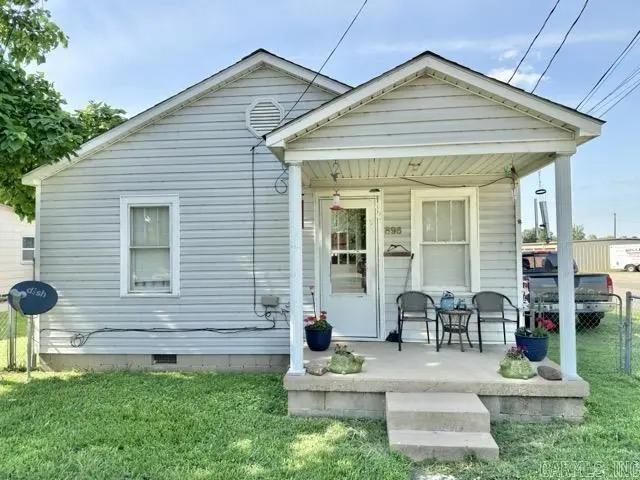
896 E Main St St · Piggott, AR
Flood risk No data
- FEMA flood zone
- —
- Chance of flooding over 30 yrs
- —
- Est. flood insurance / yr
- —
Fire risk No data
- Est. fire insurance / yr
- —
Heat risk No data
- Hot days now (above threshold)
- —
- Hot days in 30 yrs
- —
Wind risk No data
- Chance of severe wind over 30 yrs
- —
Air-quality risk No data
- Unhealthy air days now
- —
- Unhealthy air days in 30 yrs
- —
Risk factors via First Street. Map © Google.
Why this score? — see what drove the C- grade
The composite is a weighted blend of 9 inputs, each scored 0–100. Each bar is that input's sub-score; the figure is the points it added to the 100-point composite (weight × sub-score).
- Cash flow +15.0/30.0
- Appreciation +10.0/10.0
- ARV discount +7.5/15.0
- 1% rule +5.0/10.0
- DSCR +5.0/10.0
- Livability +3.5/5.0
- Rent growth +2.5/5.0
- Schools +2.5/10.0
- Condition / age +2.5/5.0
$1
🖨 Deal sheet (PDF) 📄 Offer letter ✓ Due diligence
Listing remarks
Investment opportunity in the heart of Piggott! This 2 bedroom, 1 bath home offers 752± square feet of living space on a 0.07± acre lot and is conveniently located just off Main Street, providing easy access to local shopping, dining, schools, and community amenities. The property features a utility room, a small storage building for additional storage space, and a partially fenced yard. Recent improvements include a new roof and new mini split HVAC system, both installed in 2024, offering added value and peace of mind. Currently tenant occupied, making this an excellent opportunity for investors seeking immediate rental income. Ask our office for more details on the current l
Key facts
- Utility room
- New roof
- 3,049 sq ft lot
Tags
Property features AI
Finance
- Other: Approx. 0.07 acre lot (about 3,049 sq ft)
Exterior
- Parking: Other parking (see remarks)
- Utilities: Public sewer; Public water; Municipal electric (Entergy); Natural gas
- Home design: Metal/vinyl siding exterior; Architectural shingle roof
- Construction: Metal/vinyl siding construction; Architectural shingle roof; Other foundation (see remarks)
- Exterior features: Partially fenced yard with chain link fence; Paved road access; Level lot; Inside city limits
Interior
- Kitchen: Free-standing stove; Gas range; Microwave
- Flooring: Vinyl
- Bathrooms: 1 full bathroom
- Heating & cooling: Mini split
- Interior features: Vinyl floors; Mini split heating and cooling
- Laundry & utility: Laundry room
Neighborhood map
What this means for you Summary
Snapshot
- This is a 2-bed/1.0-bath other listed at $1.
Deal economics
- At list price, monthly cash flow is $549 ($7k/yr) — positive.
- The deal already cash-flows at list — no discount required.
- Meets the 1% rule at list price ($695 rent vs $1).
- Cap rate 658858.0% vs local median 4.3% in Piggott — top-decile yield for the area; either an underpriced asset or a hidden risk that comps aren't pricing in. Stress-test before assuming the spread holds.
Location & tenants
- Location reads 70/100 on livability (#50 in AR) — a middle-class / working-renter tenant base. Strengths: crime A+, cost of living A+, housing A+; Watch: amenities F, commute F, employment F.
- Piggott School District (town): math 32% / reading 28% proficiency, ranked #157 of 238 in AR (top 66%) — families likely to look elsewhere, expect single-tenant / working-renter base with shorter leases.
- Zoned schools: Piggott Elementary School (math 42% / reading 30%, grade F, #248 of 454 statewide, top 55%, 488 students, 65% FRL); Piggott High School (math 22% / reading 26%, grade F, #206 of 292 statewide, top 71%, 361 students, 49% FRL).
- Market conditions: 71 active listings in the ZIP; 1 comparable units currently listed for rent nearby; 4 units permitted in Clay County in 2024 (0 in 5+ unit buildings).
Forward outlook
- Clay County population projected at -24% by 2050 — secular population decline; favor cash flow + early exit over multi-decade hold.
- At projected returns (10.0% appreciation + 3.0% rent growth), your $0 cash investment doubles in ~1 year — after that, you're playing with house money.
Negotiation context
- It's been on market 17 days — a 2% lower offer ($0) is reasonable based on typical stale-listing flexibility.
Questions for the listing agent
- Is there a deadline driving the sale (1031 exchange, divorce, estate, relocation)? That informs how much negotiation room exists.
- Schools are F-rated, which usually means shorter tenancies and higher turnover. Who's the typical renter profile here, and what's been the actual vacancy rate?
- What's the average days-on-market for RENTAL listings here right now (not sales)? A rising rental-DOM trend means longer vacancies and softer asking-rent achievability than the comps imply.
- What's the recent tenant-quality profile in this submarket — average credit score on applications, eviction rate, late-payment / NSF rate, and stable-employment percentage? A property-management company in the area should have these aggregated.
- How much new for-sale + rental construction is in the pipeline within 1–3 miles? Heavy new supply typically softens prices + rents 12–24 months out; constrained supply supports both.
Investment metrics
- 1% rule
- 69500.00% ✓
- Cap rate
- 658858.00%
- Cash-on-cash
- 2353041.81%
- DSCR
- 104698.12
- GRM
- 0.0
CMA / ARV
No comps found within radius.
Projected returns pro-forma
10.0% appreciation · 3.0% rent growth · sell at horizon
- IRR
- —
- Equity multiple
- 124929.13×
- Total profit
- $34,980
- Equity at exit
- $1
- IRR
- —
- Equity multiple
- 269756.60×
- Total profit
- $75,532
- Equity at exit
- $2
Cash invested: $0 (down + closing). Projections, not guarantees.
Landlord ↔ Tenant lean methodology
- Overall (STATE)
- 92 Strongly Landlord-Friendly
- State Arkansas
- 92 Strongly Landlord-Friendly · R+14
- County
- — inherits STATE
- City
- — inherits STATE
ZIP-level market 72454
- Home prices YoY
- 3.4%
- Active inventory
- 71
Monthly cashflow live
- Estimated rent
- $695 medium interval (Pro) →
- Mortgage (P&I)
- −$0
- Tax est. 1.5%
- −$0 /mo · $0/yr
- Insurance
- −$0
- HOA
- −$0
- Vacancy / Maint / Mgmt
- −$146
- Net cashflow
- $549
Break-even live
Sensitivity live
| Price | -10% $549 | -5% $549 | +0% $549 | +5% $549 | +10% $549 |
|---|---|---|---|---|---|
| Rent | -10% $494 | -5% $522 | +0% $549 | +5% $576 | +10% $604 |
| Rate | -1.0pp $549 | -0.5pp $549 | base $549 | +0.5pp $549 | +1.0pp $549 |
UW: 25.0% down · 7.5% · 30yr · 1.5% tax · 5.0% vac · 8.0% maint · 8.0% mgmt
Financing live
Cash to close
- Down payment
- $0
- Closing costs
- $0
- Reserves months
- —
- Total cash needed
- —
Loan-product check · same deal, 3 products live
Conventional
25% down · 7.5% · 30yr
- Down + closing
- —
- Monthly P&I
- —
- Monthly cashflow
- —
- DSCR
- —
- Eligible?
- —
Personal DTI + credit; lowest rate.
DSCR
20% down · 8.5% · 30yr
- Down + closing
- —
- Monthly P&I
- —
- Monthly cashflow
- —
- DSCR
- —
- Eligible?
- —
No personal income docs; deal must DSCR.
Hard money
10% down · 12.0% · 12mo
- Down + closing
- —
- Monthly P&I
- —
- Monthly cashflow
- —
- DSCR
- —
- Eligible?
- —
Short-term bridge; refi at stabilization.
Rent comps 1 comps
| Address | Beds | Baths | Sqft | Rent | $/sqft | DOM | Units | Dist |
|---|---|---|---|---|---|---|---|---|
| 473 S Thornton Ave Piggott, AR | 1.0 | 1.0 | 757 | $695 | $0.92 | 45d | 1 | 0.50mi |
Listing history 13 events
-
2026-06-22days on market $1 Active 17 DOM
-
2026-06-21days on market $1 Active 16 DOM
-
2026-06-19days on market $1 Active 14 DOM
-
2026-06-18days on market $1 Active 13 DOM
-
2026-06-17days on market $1 Active 12 DOM
-
2026-06-16days on market $1 Active 11 DOM
-
2026-06-15days on market $1 Active 10 DOM
-
2026-06-14days on market $1 Active 8 DOM
-
2026-06-12statusdays on market $1 Active 7 DOM
-
2026-06-09days on market $1 New Listing 4 DOM
-
2026-06-08days on market $1 New Listing 3 DOM
-
2026-06-07remarks 685-char remark
-
2026-06-07$1 New Listing 2 DOM
ⓘ Source: listings_history table (triggers on properties + properties_extension) + one-shot
backfill from property_details.listing_events for pre-trigger history.
Nearby sold comps map
Loading sold comps map…
Walkable amenities ~0.75 mi
Loading nearby amenities…
Taxation est. · year 1
- Rental income
- $8,340
- − Mortgage interest
- −$0
- − Property taxes
- −$0
- − Insurance
- −$0
- − Repairs & maintenance
- −$667
- − Management
- −$667
- − Depreciation
- −$0
- Taxable income
- $7,005
- Est. tax owed @ 24.0%
- −$1,681
- After-tax cash flow
- $4,907/yr
For passive investors: Depreciation is non-cash, so a rental often shows a tax loss while cash-flowing — sheltering income. Rental losses are passive: they offset passive income freely, and up to $25,000/yr can offset ordinary (W-2) income if you actively participate and your MAGI is under $100k (phasing out to $0 by $150k); unused losses carry forward. On sale, claimed depreciation is recaptured at up to 25%, and gains may owe capital-gains tax (a 1031 exchange can defer both). Figures are a year-1 estimate at your 24.0% rate — not tax advice; consult a CPA.
Schools (NCES district)
- District
- Piggott School District
- NCES district ID
- 0511370
- Math proficiency
- 32% ▼ -15.00%
- Reading proficiency
- 28% ▼ -10.00%
- Median HH income
- $33,336
- Composite
- 24.63/100
- National rank
- #7628
- State rank
- #157 of 238 in AR
Livability — Piggott
- Score
- 70/100
- State rank
- #50
- US rank
- #7358
Category grades
Schools grade is shown separately in the Schools card above.
Census & demographics
- Census place
- Piggott, AR
- Population (ZIP)
- 4,699
Population outlook (Clay County) Hauer SSP2
- Today (2025)
- 13,564 people
- By 2030
- 12,834 · -5.4%
- By 2040
- 11,498 · -15.2%
- By 2050
- 10,325 · -23.9%
- By 2075
- 8,228 · -39.3%
- By 2100
- 6,675 · -50.8%
Race, ethnicity, and origin ACS 2023
- Neighborhood character
- Predominantly White (94%)
- Race & ethnicity
- White 94% Two or more races 5% Hispanic / Latino 2%
- Common ancestry
- Slovak 1% Serbian 1% Italian 1%
- Foreign-born
- 1%
- Languages at home
- 99% English-only · German/W. Germanic 1%
Political lean MEDSL · Clay
- 2024 margin
- Solid R (+61.6) · D 18.3% · R 79.9% · Other 1.9%
- 2008→2024 swing
- -47.3pp toward R · 2008: -14.3pp · 2024: -61.6pp
- All cycles
- 2024: R+61.6 2020: R+60.3 2016: R+29.8 2012: R+29.1 2008: R+14.3
Not yet ingested
- Civics
- —
Market trends
- HPI YoY
- ▲ 11.57%
- Current HPI
- 355.7877
- Rent YoY
- —
- Metro
- —
- State GDP YoY
- ▲ 3.80%
- F500 in state
- 10
Industry mix (Fortune 500 HQ in AR)
| Industry | F500 HQs | Revenue |
|---|---|---|
| Retail | 1 | $681B |
|
||
| Food / Agriculture | 1 | $53B |
|
||
| Retail / Energy | 1 | $22B |
|
||
| Transportation / Logistics | 1 | $12B |
|
||
| Energy | 1 | $4B |
|
||
Cash-flow waterfall
monthlySold comps — $/sqft
last 12 mo · ≤1 miLoading sold comps…