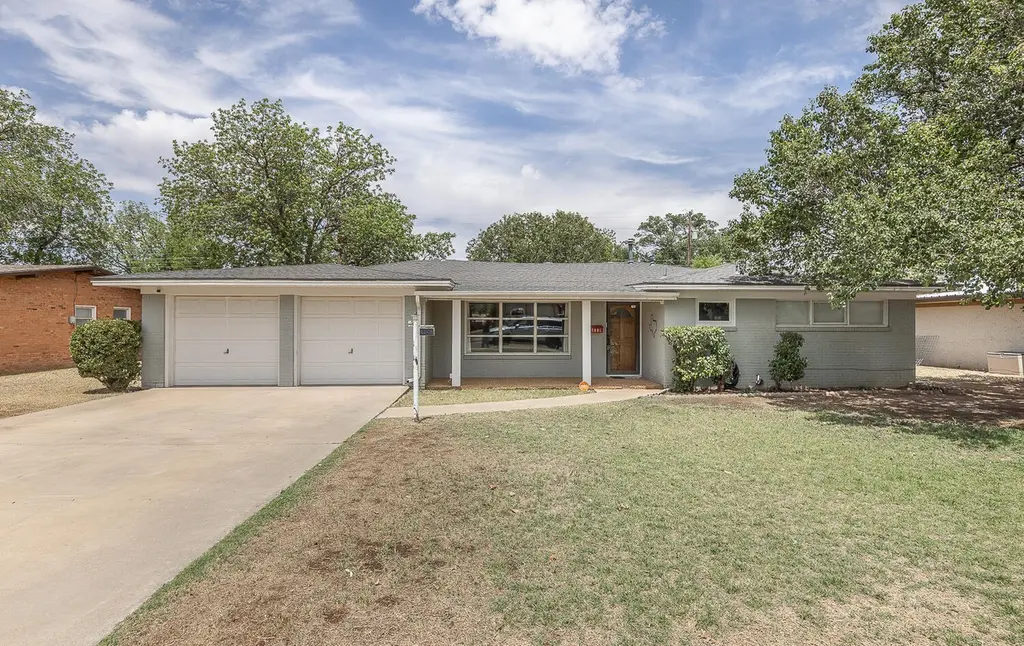
4006 49th St · Lubbock, TX
Flood risk 1/10 · Minimal
- FEMA flood zone
- X (unshaded)
- Chance of flooding over 30 yrs
- 0.0%
- Est. flood insurance / yr
- $507 – $1,088
Fire risk 1/10 · Minimal
- Est. fire insurance / yr
- $1,222 – $2,270
Heat risk 5/10 · Moderate
- Hot days now (above 99°F)
- 7 days/yr
- Hot days in 30 yrs
- 21 days/yr
Wind risk 2/10 · Minimal
- Chance of severe wind over 30 yrs
- —
Air-quality risk 2/10 · Minimal
- Unhealthy air days now
- 1 days/yr
- Unhealthy air days in 30 yrs
- 1 days/yr
Risk factors via First Street. Map © Google.
Why this score? — see what drove the C- grade
The composite is a weighted blend of 9 inputs, each scored 0–100. Each bar is that input's sub-score; the figure is the points it added to the 100-point composite (weight × sub-score).
- Cash flow +15.1/30.0
- ARV discount +14.8/15.0
- 1% rule +4.8/10.0
- DSCR +4.6/10.0
- Livability +4.0/5.0
- Schools +3.1/10.0
- Rent growth +3.0/5.0
- Condition / age +2.5/5.0
- Appreciation +0.0/10.0
$160,000
🖨 Deal sheet (PDF) 📄 Offer letter ✓ Due diligence
Listing remarks MLS
Adorable 3/2/2 in central Lubbock location is a perfect choice for Tech students or first time home buyers. The large living area is perfect for enjoying family time. Enjoy preparing that perfect meal in the spacious kitchen with a large bar and adjacent dining space with charming Parquet flooring. Each bedroom offers plenty of space and large closets along with newer carpet and fresh paint. Call today for your private showing.
Key facts
- 0.24 acre lot
- 2 garage spots
- Built 1955
Property features AI
Exterior
- Parking: Attached 2-car garage
- Utilities: Public water; Electricity connected; Sewer connected
- Home design: Single-family residence; Residential property
- Construction: Brick veneer construction; Composition roof; Slab foundation; Built area approximately 1,782 above-grade
- Exterior features: Rear porch; Fenced backyard; Other exterior features
Interior
- Flooring: Hardwood floors
- Bathrooms: 2 full bathrooms
- Heating & cooling: Central heating (natural gas); Central electric air conditioning
- Interior features: Other interior features
Neighborhood map
What this means for you Summary
Snapshot
- This is a 3-bed/2.0-bath single-family listed at $160k.
Deal economics
- At list price, monthly cash flow is $51 ($617/yr) — positive.
- The deal already cash-flows at list — no discount required.
- To meet the 1% rule (rent ≥ 1% of price), the offer needs to be $156k (2.4% below list).
- Recommended offer: $156k (2.4% below list) — sets the bar for 1% rule.
Location & tenants
- Location reads 80/100 on livability (#37 in TX, #1,749 nationally) — a professional / high-income tenant draw. Strengths: commute A+, cost of living A+, housing A+; Watch: employment C-, crime F.
- Lubbock ISD (urban): math 36% / reading 39% proficiency, ranked #481 of 826 in TX (top 58%) — families likely to look elsewhere, expect single-tenant / working-renter base with shorter leases; 60% free/reduced lunch — lower-income household profile, screen leases tightly.
- Zoned schools: Maedgen El (math 37% / reading 27%, grade F, #2,268 of 4,322 statewide, top 55%, 323 students, 91% FRL); Hutchinson Middle (math 57% / reading 63%, grade B, #158 of 1,662 statewide, top 10%, 833 students, 49% FRL); Monterey H S (math 28% / reading 37%, grade F, #1,029 of 1,632 statewide, top 64%, 2,114 students, 72% FRL).
- Market conditions: Rents rising (+1.9%/yr); 187 active listings in the ZIP; 40 comparable units currently listed for rent nearby; rentals lingering (median 46d on market — plan ~5-8 weeks vacancy on turnover, expect pricing pressure); 52% of comp listings sitting > 30 days — soft ceiling on asking rent; 2,219 units permitted in Lubbock County in 2024 (252 in 5+ unit buildings).
Forward outlook
- Local home prices are declining (-3.0%/yr); year-one equity from $1k of loan paydown is wiped out by about $5k of value loss. Plan a longer hold.
- Lubbock County population projected at +39% by 2050 — long-run rental-demand tailwind backs the buy-and-hold thesis.
Negotiation context
- Only 10 days on market — expect competitive offers; lowballing is unlikely to land.
- 3 sale attempts since 8y ago with the ask held roughly flat each time — persistent listings suggest the price (not the market) is what's stuck; bring a comps-based counter.
Risks & watch-outs
- Watch-outs: built in 1955 — expect roof / HVAC / electrical / plumbing capex.
- Climate carrying-cost: extreme-heat days projected 7→21/yr by 2055 (HVAC capex compounding) — expect insurance premiums to compound above CPI over the hold.
Questions for the listing agent
- Built in 1955 — when were the roof, HVAC, electrical panel, plumbing, and water heater last replaced?
- Is there a deadline driving the sale (1031 exchange, divorce, estate, relocation)? That informs how much negotiation room exists.
- Schools are D-rated, which usually means shorter tenancies and higher turnover. Who's the typical renter profile here, and what's been the actual vacancy rate?
- Crime grade is F in this area — have there been break-ins, vandalism, or insurance claims at this property in the last 3 years? What carrier currently insures it and at what premium?
- What's the average days-on-market for RENTAL listings here right now (not sales)? A rising rental-DOM trend means longer vacancies and softer asking-rent achievability than the comps imply.
- What's the recent tenant-quality profile in this submarket — average credit score on applications, eviction rate, late-payment / NSF rate, and stable-employment percentage? A property-management company in the area should have these aggregated.
- How much new for-sale + rental construction is in the pipeline within 1–3 miles? Heavy new supply typically softens prices + rents 12–24 months out; constrained supply supports both.
Investment metrics
- 1% rule
- 0.98% ✗
- Cap rate
- 6.68%
- Cash-on-cash
- 1.38%
- DSCR
- 1.06
- GRM
- 8.5
CMA / ARV
- ARV (median comp)
- $191,160
- List price
- $160,000
- Delta
- -16.30%
- Verdict
- UNDERPRICED
- Comps
- 2 within 1.0 mi
Projected returns pro-forma
-3.0% appreciation · 1.94% rent growth · sell at horizon
- IRR
- -15.3%
- Equity multiple
- 0.46×
- Total profit
- $-24,232
- Equity at exit
- $23,857
- IRR
- -8.8%
- Equity multiple
- 0.48×
- Total profit
- $-23,220
- Equity at exit
- $13,834
Cash invested: $44,800 (down + closing). Projections, not guarantees.
Landlord ↔ Tenant lean methodology
- Overall (STATE)
- 87 Strongly Landlord-Friendly
- State Texas
- 87 Strongly Landlord-Friendly · R+5
- County
- — inherits STATE
- City
- — inherits STATE
ZIP-level market 79413
- Rents YoY
- 1.9%
- Active inventory
- 187
- Price-to-rent
- 8.5×
Monthly cashflow live
- Estimated rent
- $1,562 high interval (Pro) →
- Mortgage (P&I)
- −$839
- Tax from tax record
- −$276 /mo · $3,318/yr
- Insurance
- −$67
- HOA
- −$0
- Vacancy / Maint / Mgmt
- −$328
- Net cashflow
- $51
Break-even live
Sensitivity live
| Price | -10% $142 | -5% $97 | +0% $51 | +5% $6 | +10% $-39 |
|---|---|---|---|---|---|
| Rent | -10% $-72 | -5% $-10 | +0% $51 | +5% $113 | +10% $175 |
| Rate | -1.0pp $132 | -0.5pp $92 | base $51 | +0.5pp $10 | +1.0pp $-32 |
UW: 25.0% down · 7.5% · 30yr · 1.5% tax · 5.0% vac · 8.0% maint · 8.0% mgmt
Financing live
Cash to close
- Down payment
- $40,000
- Closing costs
- $4,800
- Reserves months
- —
- Total cash needed
- —
Loan-product check · same deal, 3 products live
Conventional
25% down · 7.5% · 30yr
- Down + closing
- —
- Monthly P&I
- —
- Monthly cashflow
- —
- DSCR
- —
- Eligible?
- —
Personal DTI + credit; lowest rate.
DSCR
20% down · 8.5% · 30yr
- Down + closing
- —
- Monthly P&I
- —
- Monthly cashflow
- —
- DSCR
- —
- Eligible?
- —
No personal income docs; deal must DSCR.
Hard money
10% down · 12.0% · 12mo
- Down + closing
- —
- Monthly P&I
- —
- Monthly cashflow
- —
- DSCR
- —
- Eligible?
- —
Short-term bridge; refi at stabilization.
Rent comps 40 comps
| Address | Beds | Baths | Sqft | Rent | $/sqft | DOM | Units | Dist |
|---|---|---|---|---|---|---|---|---|
| 3712 47th St Lubbock, TX | 3.0 | 2.0 | 1767 | $1,400 | $0.79 | 23d | 1 | 0.23mi |
| 4210 52nd St Lubbock, TX | 3.0 | 2.0 | 1715 | $1,575 | $0.92 | 15d | 1 | 0.25mi |
| 3708 46th St Lubbock, TX | 3.0 | 2.0 | 2378 | $1,750 | $0.74 | 15d | 1 | 0.29mi |
| 4314 52nd St Unit A Lubbock, TX | 3.0 | 2.0 | 1863 | $1,400 | $0.75 | 23d | 1 | 0.36mi |
| 5018 Kenosha Ave Lubbock, TX | 2.0 | 1.5 | 1245 | $1,275 | $1.02 | 15d | 1 | 0.38mi |
| 4213 54th St Lubbock, TX | 3.0 | 2.0 | 1680 | $1,550 | $0.92 | 15d | 1 | 0.40mi |
| 5202 Kenosha Ave Lubbock, TX | 2.0 | 1.0–1.5 | 1082 | $1,022 | $0.94 | 23d | 1 | 0.40mi |
| 4313 53rd St Unit B Lubbock, TX | 2.0 | 1.5 | 1368 | $1,200 | $0.88 | 45d | 1 | 0.42mi |
| 3612 44th St Lubbock, TX | 3.0 | 2.0 | 1675 | $1,850 | $1.10 | 45d | 1 | 0.43mi |
| 5302 Kenosha Ave Unit 5324 Kenosha Lubbock, TX | 2.0 | 1.5 | 1300 | $950 | $0.73 | 15d | 1 | 0.43mi |
| 5302 Kenosha Ave Unit 5330 Lubbock, TX | 2.0 | 1.5 | 1300 | $1,050 | $0.81 | 45d | 1 | 0.43mi |
| 5324 Kenosha Ave Lubbock, TX | 2.0 | 1.5 | 1300 | $950 | $0.73 | 15d | 1 | 0.44mi |
| 5330 Kenosha Ave Lubbock, TX | 2.0 | 1.5 | 1300 | $1,050 | $0.81 | 45d | 1 | 0.45mi |
| 4211 41st St Lubbock, TX | 4.0 | 2.0 | 1960 | $1,599 | $0.82 | 45d | 1 | 0.50mi |
| 3505 46th St Lubbock, TX | 2.0 | 2.0 | 1686 | $1,550 | $0.92 | 45d | 1 | 0.51mi |
| 4310 42nd St Lubbock, TX | 3.0 | 2.0 | 1754 | $1,700 | $0.97 | 45d | 1 | 0.51mi |
| 4324 56th St Lubbock, TX | 4.0 | 2.0 | 2014 | $2,000 | $0.99 | 45d | 1 | 0.53mi |
| 3417 47th St Lubbock, TX | 3.0 | 2.0 | 1450 | $1,550 | $1.07 | 45d | 1 | 0.54mi |
| 4315 41st St Lubbock, TX | 3.0 | 2.0 | 1558 | $1,450 | $0.93 | 23d | 1 | 0.55mi |
| 3415 49th St Unit B Lubbock, TX | 3.0 | 2.0 | 1410 | $1,350 | $0.96 | 45d | 1 | 0.56mi |
| 4602 50th St Lubbock, TX | 1.0–3.0 | 1.0–2.5 | 1080 | $1,368 | $1.27 | 15d | 9 | 0.67mi |
| 3423 56th St Lubbock, TX | 3.0 | 2.0 | 2224 | $1,895 | $0.85 | 45d | 1 | 0.67mi |
| 3312 47th St Lubbock, TX | 3.0 | 2.0 | 1880 | $1,795 | $0.95 | 45d | 1 | 0.70mi |
| 3404 42nd St Lubbock, TX | 3.0 | 2.0 | 1475 | $1,500 | $1.02 | 45d | 1 | 0.76mi |
| 3712 37th St Lubbock, TX | 4.0 | 2.0 | 1672 | $2,100 | $1.26 | 45d | 1 | 0.77mi |
| 4619 43rd St Lubbock, TX | 3.0 | 1.0 | 1404 | $1,500 | $1.07 | 45d | 1 | 0.79mi |
| 3812 36th St Unit A Lubbock, TX | 3.0 | 2.0 | 1458 | $1,500 | $1.03 | 23d | 1 | 0.81mi |
| 4708 43rd St Lubbock, TX | 3.0 | 1.5 | 1249 | $1,350 | $1.08 | 45d | 1 | 0.85mi |
| 3408 38th St Lubbock, TX | 3.0 | 2.0 | 1927 | $1,895 | $0.98 | 45d | 1 | 0.91mi |
| 4803 43rd St Lubbock, TX | 3.0 | 2.0 | 1412 | $1,200 | $0.85 | 23d | 1 | 0.94mi |
| 4608 60th St Lubbock, TX | 3.0 | 2.0 | 1769 | $1,650 | $0.93 | 23d | 1 | 0.95mi |
| 6309 Nashville Dr Lubbock, TX | 3.0 | 2.0 | 2168 | $1,799 | $0.83 | 45d | 1 | 0.98mi |
| 4819 44th St Lubbock, TX | 3.0 | 2.0 | 1412 | $1,300 | $0.92 | 45d | 1 | 1.01mi |
| 4815 43rd St Lubbock, TX | 3.0 | 2.0 | 1282 | $1,500 | $1.17 | 23d | 1 | 1.01mi |
| 3105 44th St Lubbock, TX | 3.0 | 2.0 | 1348 | $1,375 | $1.02 | 23d | 1 | 1.03mi |
| 3019 47th St Lubbock, TX | 3.0 | 2.0 | 1298 | $1,400 | $1.08 | 23d | 1 | 1.04mi |
| 4606 35th St Lubbock, TX | 4.0 | 2.0 | 1684 | $1,800 | $1.07 | 45d | 1 | 1.07mi |
| 4926 48th St Lubbock, TX | 3.0 | 2.0 | 1354 | $1,500 | $1.11 | 23d | 1 | 1.07mi |
| 3114 40th St Lubbock, TX | 3.0 | 2.0 | 1488 | $1,375 | $0.92 | 45d | 1 | 1.08mi |
| 4916 46th St Lubbock, TX | 3.0 | 2.0 | 1377 | $1,450 | $1.05 | 15d | 1 | 1.08mi |
Listing history 13 events
-
2026-06-02status $160,000 Pending 10 DOM
-
2026-06-01days on market $160,000 Active 10 DOM
-
2026-05-31days on market $160,000 Active 9 DOM
-
2026-05-30days on market $160,000 Active 8 DOM
-
2026-05-18status Pending 467-char remark
-
2026-05-15$160,000 Active 467-char remark
-
2018-07-26soldstatus 431-char remark
Show marketing remark (431 chars)
Adorable 3/2/2 in central Lubbock location is a perfect choice for Tech students or first time home buyers. The large living area is perfect for enjoying family time. Enjoy preparing that perfect meal in the spacious kitchen with a large bar and adjacent dining space with charming Parquet flooring. Each bedroom offers plenty of space and large closets along with newer carpet and fresh paint. Call today for your private showing.
-
2018-07-26soldstatus
Show marketing remark (431 chars)
Adorable 3/2/2 in central Lubbock location is a perfect choice for Tech students or first time home buyers. The large living area is perfect for enjoying family time. Enjoy preparing that perfect meal in the spacious kitchen with a large bar and adjacent dining space with charming Parquet flooring. Each bedroom offers plenty of space and large closets along with newer carpet and fresh paint. Call today for your private showing.
-
2018-06-21$129,000 431-char remark
Show marketing remark (431 chars)
Adorable 3/2/2 in central Lubbock location is a perfect choice for Tech students or first time home buyers. The large living area is perfect for enjoying family time. Enjoy preparing that perfect meal in the spacious kitchen with a large bar and adjacent dining space with charming Parquet flooring. Each bedroom offers plenty of space and large closets along with newer carpet and fresh paint. Call today for your private showing.
-
2013-07-15soldstatus
-
2011-04-14soldstatus
-
1992-03-01soldstatus
-
1983-03-01soldstatus
ⓘ Source: listings_history table (triggers on properties + properties_extension) + one-shot
backfill from property_details.listing_events for pre-trigger history.
Tax reassessment forecast TX · Resets to sale price
- Current annual tax
- $3,318 · $276/mo
- Projected year-2 tax
- $3,318 · $276/mo
- Expected delta
- $0/yr ($0/mo · 0.0%)
ⓘ Screening estimate from a state-policy table — verify with the county assessor before closing.
Climate risk First Street
- Flood 1/10 Low FEMA zone X (unshaded) · 0% chance over 30 yrs
- Wildfire 1/10 Low
- Heat 5/10 Major 7 d/yr ≥99°F today · 21 d/yr by 30 yrs out
- Wind 2/10 Low
- Air quality 2/10 Low 1 unhealthy d/yr today · 1 by 30 yrs out
Nearby sold comps map
Loading sold comps map…
Walkable amenities ~0.75 mi
Loading nearby amenities…
Taxation est. · year 1
- Rental income
- $18,738
- − Mortgage interest
- −$8,962
- − Property taxes
- −$3,318
- − Insurance
- −$800
- − Repairs & maintenance
- −$1,499
- − Management
- −$1,499
- − Depreciation
- −$4,655
- Taxable loss
- −$1,995
- Est. tax savings @ 24.0%
- +$479
- After-tax cash flow
- $1,095/yr
For passive investors: Depreciation is non-cash, so a rental often shows a tax loss while cash-flowing — sheltering income. Rental losses are passive: they offset passive income freely, and up to $25,000/yr can offset ordinary (W-2) income if you actively participate and your MAGI is under $100k (phasing out to $0 by $150k); unused losses carry forward. On sale, claimed depreciation is recaptured at up to 25%, and gains may owe capital-gains tax (a 1031 exchange can defer both). Figures are a year-1 estimate at your 24.0% rate — not tax advice; consult a CPA.
Schools (NCES district)
- District
- Lubbock ISD
- NCES district ID
- 4828500
- Math proficiency
- 36% ▼ -8.00%
- Reading proficiency
- 39% ▼ -1.00%
- Median HH income
- $39,820
- Composite
- 31.44/100
- National rank
- #5984
- State rank
- #481 of 826 in TX
Livability — Lubbock
- Score
- 80/100
- State rank
- #37
- US rank
- #1749
Category grades
Schools grade is shown separately in the Schools card above.
Census & demographics
- Census place
- Lubbock, TX
- County
- Lubbock County · 293,542 people
- City population
- 283,030
- Metro
- Lubbock, TX
- Population (ZIP)
- 23,343
- Household income
- $69,400
- Rent vs Own
- Severe rent burden
- 1211.0
Population outlook (Lubbock County) Hauer SSP2
- Today (2025)
- 345,960 people
- By 2030
- 371,449 · +7.4%
- By 2040
- 424,539 · +22.7%
- By 2050
- 481,150 · +39.1%
- By 2075
- 633,467 · +83.1%
- By 2100
- 746,853 · +115.9%
Race, ethnicity, and origin ACS 2023
- Neighborhood character
- Diverse neighborhood (Simpson 0.59)
- Race & ethnicity
- White 54% Hispanic / Latino 34% Two or more races 18% Black 6%
- Hispanic origin (detail)
- Mexican 25%
- Common ancestry
- Slovak 2% Italian 2% Serbian 1%
- Foreign-born
- 3% · Canada, China
- Languages at home
- 88% English-only · Spanish 10% Chinese 1%
Political lean MEDSL · Lubbock
- 2024 margin
- Solid R (+39.5) · D 29.7% · R 69.2% · Other 1.0%
- 2008→2024 swing
- -2.8pp toward R · 2008: -36.7pp · 2024: -39.5pp
- All cycles
- 2024: R+39.5 2020: R+32.2 2016: R+38.4 2012: R+40.9 2008: R+36.7
Not yet ingested
- Civics
- —
Market trends
- HPI YoY
- ▼ -145.52%
- Current HPI
- 239.8854
- Rent YoY
- ▲ 1.94%
- Metro
- Lubbock, TX
- State GDP YoY
- ▲ 3.95%
- F500 in state
- 110
Industry mix (Fortune 500 HQ in TX)
| Industry | F500 HQs | Revenue |
|---|---|---|
| Energy | 16 | $1,198B |
|
||
| Technology | 5 | $198B |
|
||
| Engineering / Construction | 4 | $72B |
|
||
| Energy Services | 3 | $60B |
|
||
| Utilities | 3 | $41B |
|
||
| Healthcare | 2 | $330B |
|
||
Price history
+24.0% since first listed12 events — show timeline
- 2026-06-17 Sold (MLS) — LARMLS
- 2026-06-01 Pending — LARMLS
- 2026-05-25 Relisted — LARMLS
- 2026-05-18 Pending — LARMLS
- 2026-05-15 Listed $160,000 LARMLS
- 2018-07-26 Sold (Public Records) — Public Records
- 2018-07-26 Sold (MLS) — LARMLS
- 2018-06-21 Listed $129,000 LARMLS
- 2013-07-15 Sold (Public Records) — Public Records
- 2011-04-14 Sold (Public Records) — Public Records
- 1992-03-01 Sold (Public Records) — Public Records
- 1983-03-01 Sold (Public Records) — Public Records
Property tax history
+3.9%/yrLatest (2025): $3,318 · +1.2% YoY. Source: county tax records.
Cash-flow waterfall
monthlySold comps — $/sqft
last 12 mo · ≤1 miLoading sold comps…