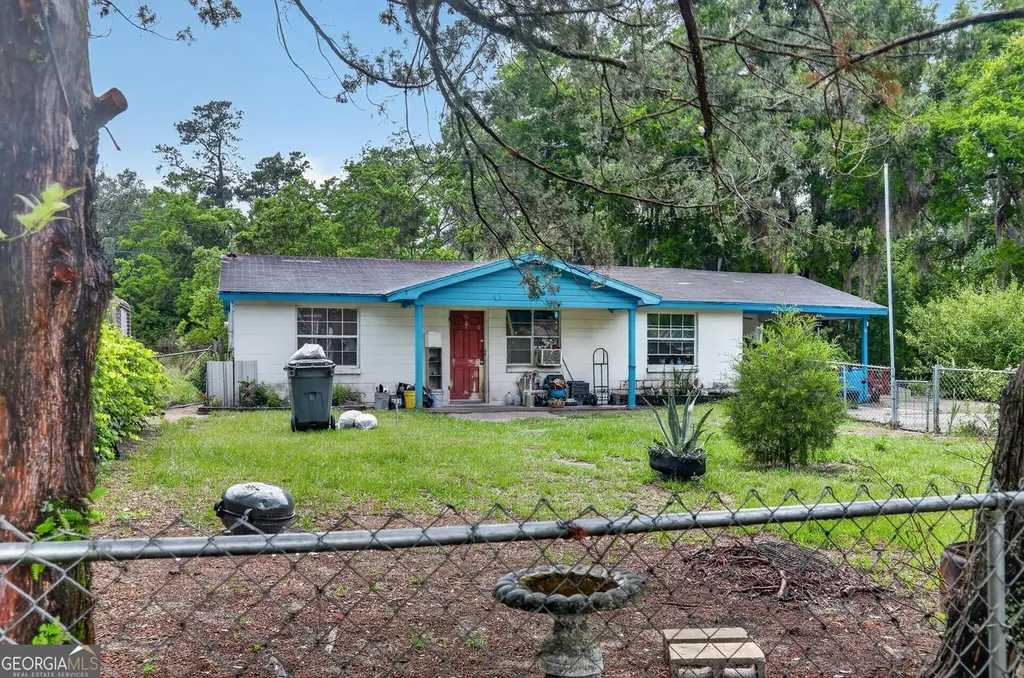
145 Elizabeth St · Folkston, GA
Flood risk 1/10 · Minimal
- FEMA flood zone
- X (unshaded)
- Chance of flooding over 30 yrs
- 0.0%
- Est. flood insurance / yr
- $507 – $1,088
Fire risk 8/10 · Major
- Est. fire insurance / yr
- $963 – $1,789
Heat risk 8/10 · Major
- Hot days now (above 109°F)
- 7 days/yr
- Hot days in 30 yrs
- 19 days/yr
Wind risk 9/10 · Severe
- Chance of severe wind over 30 yrs
- 99.0%
Air-quality risk 7/10 · Major
- Unhealthy air days now
- 15 days/yr
- Unhealthy air days in 30 yrs
- 15 days/yr
Risk factors via First Street. Map © Google.
Why this score? — see what drove the B+ grade
The composite is a weighted blend of 9 inputs, each scored 0–100. Each bar is that input's sub-score; the figure is the points it added to the 100-point composite (weight × sub-score).
- Cash flow +30.0/30.0
- 1% rule +10.0/10.0
- DSCR +10.0/10.0
- Appreciation +7.7/10.0
- ARV discount +7.5/15.0
- Livability +3.3/5.0
- Schools +2.6/10.0
- Rent growth +2.5/5.0
- Condition / age +2.5/5.0
$40,000
🖨 Deal sheet (PDF) 📄 Offer letter ✓ Due diligence
Listing remarks
Investor Special! This home is in need of a total rehab, handymen & builders - this one is for you. With new builds on our street selling just under $300,000, this presents an opportunity for new construction or fix and flip with large margins. The home is currently occupied with a non paying tenant that will convey with the sale.
Key facts
- 0.41 acre lot
- 4 parking spots
- Built 1964
Property features AI
Finance
- Other: Property condition: Fixer; Property type: Residential - Single Family Residence
- Financial info: Listing terms: Cash
- HOA & community: No HOA
Exterior
- Parking: Carport (parking for 4)
- Utilities: Public water available; Public sewer (sewer connected)
- Home design: Single-family residence (house); Built in 1964; One story
- Construction: Block construction; Composition roof; Built in 1964
- Exterior features: Cul-de-sac lot; Other exterior features
Interior
- Kitchen: Appliances: Other
- Bedrooms: 3 bedrooms on the main level
- Flooring: Other flooring
- Bathrooms: 1 full bathroom (main level)
- Heating & cooling: Central heating; Central air conditioning
- Interior features: One-level layout; Fireplace (1); Other interior features
- Laundry & utility: No laundry features listed
Neighborhood map
What this means for you Summary
Snapshot
- This is a 3-bed/1.0-bath single-family listed at $40k.
Deal economics
- At list price, monthly cash flow is $531 ($6k/yr) — positive.
- The deal already cash-flows at list — no discount required.
- Meets the 1% rule at list price ($995 rent vs $40k).
- Cap rate 22.2% vs local median 2.8% in Folkston — top-decile yield for the area; either an underpriced asset or a hidden risk that comps aren't pricing in. Stress-test before assuming the spread holds.
Location & tenants
- Location reads 66/100 on livability (#191 in GA) — a middle-class / working-renter tenant base. Strengths: crime A+, cost of living A+, health & safety A+; Watch: amenities F, commute F, employment F.
- Charlton County (rural): math 28% / reading 33% proficiency, ranked #94 of 174 in GA (top 54%) — families likely to look elsewhere, expect single-tenant / working-renter base with shorter leases; 63% free/reduced lunch — lower-income household profile, screen leases tightly.
- Zoned schools: Folkston Elementary School (math 42% / reading 42%, grade F, #380 of 1,228 statewide, top 33%, 469 students, 76% FRL).
- Market conditions: 83 active listings in the ZIP; 49 units permitted in Charlton County in 2024 (0 in 5+ unit buildings).
Forward outlook
- In year one you build about $2k of equity ($277 loan paydown + $2k appreciation (5.5% local appreciation)).
- At projected returns (5.5% appreciation + 3.0% rent growth), your $11k cash investment doubles in ~2 years — after that, you're playing with house money.
Negotiation context
- Only 2 days on market — expect competitive offers; lowballing is unlikely to land.
Risks & watch-outs
- Climate carrying-cost: severe wind risk, 99% chance of damaging wind over 30y; severe wildfire risk; extreme-heat days projected 7→19/yr by 2055 (HVAC capex compounding) — expect insurance premiums to compound above CPI over the hold.
Questions for the listing agent
- Built in 1964 — when were the roof, HVAC, electrical panel, plumbing, and water heater last replaced?
- Is there a deadline driving the sale (1031 exchange, divorce, estate, relocation)? That informs how much negotiation room exists.
- Schools are F-rated, which usually means shorter tenancies and higher turnover. Who's the typical renter profile here, and what's been the actual vacancy rate?
- What's the average days-on-market for RENTAL listings here right now (not sales)? A rising rental-DOM trend means longer vacancies and softer asking-rent achievability than the comps imply.
- What's the recent tenant-quality profile in this submarket — average credit score on applications, eviction rate, late-payment / NSF rate, and stable-employment percentage? A property-management company in the area should have these aggregated.
- How much new for-sale + rental construction is in the pipeline within 1–3 miles? Heavy new supply typically softens prices + rents 12–24 months out; constrained supply supports both.
Investment metrics
- 1% rule
- 2.49% ✓
- Cap rate
- 22.22%
- Cash-on-cash
- 56.88%
- DSCR
- 3.53
- GRM
- 3.3
CMA / ARV
No comps found within radius.
Projected returns pro-forma
5.49% appreciation · 3.0% rent growth · sell at horizon
- IRR
- 64.5%
- Equity multiple
- 4.94×
- Total profit
- $44,163
- Equity at exit
- $23,871
- IRR
- 61.9%
- Equity multiple
- 10.27×
- Total profit
- $103,788
- Equity at exit
- $42,228
Cash invested: $11,200 (down + closing). Projections, not guarantees.
Landlord ↔ Tenant lean methodology
- Overall (STATE)
- 90 Strongly Landlord-Friendly
- State Georgia
- 90 Strongly Landlord-Friendly · R+3
- County
- — inherits STATE
- City
- — inherits STATE
ZIP-level market 31537
- Home prices YoY
- 1.8%
- Active inventory
- 83
- Price-to-rent
- 3.3×
Monthly cashflow live
- Estimated rent
- $995 medium interval (Pro) →
- Mortgage (P&I)
- −$210
- Tax from tax record
- −$29 /mo · $345/yr
- Insurance
- −$17
- HOA
- −$0
- Vacancy / Maint / Mgmt
- −$209
- Net cashflow
- $531
Break-even live
Sensitivity live
| Price | -10% $554 | -5% $542 | +0% $531 | +5% $520 | +10% $508 |
|---|---|---|---|---|---|
| Rent | -10% $452 | -5% $492 | +0% $531 | +5% $570 | +10% $609 |
| Rate | -1.0pp $551 | -0.5pp $541 | base $531 | +0.5pp $520 | +1.0pp $510 |
UW: 25.0% down · 7.5% · 30yr · 1.5% tax · 5.0% vac · 8.0% maint · 8.0% mgmt
Financing live
Cash to close
- Down payment
- $10,000
- Closing costs
- $1,200
- Reserves months
- —
- Total cash needed
- —
Loan-product check · same deal, 3 products live
Conventional
25% down · 7.5% · 30yr
- Down + closing
- —
- Monthly P&I
- —
- Monthly cashflow
- —
- DSCR
- —
- Eligible?
- —
Personal DTI + credit; lowest rate.
DSCR
20% down · 8.5% · 30yr
- Down + closing
- —
- Monthly P&I
- —
- Monthly cashflow
- —
- DSCR
- —
- Eligible?
- —
No personal income docs; deal must DSCR.
Hard money
10% down · 12.0% · 12mo
- Down + closing
- —
- Monthly P&I
- —
- Monthly cashflow
- —
- DSCR
- —
- Eligible?
- —
Short-term bridge; refi at stabilization.
Listing history 6 events
-
2026-05-21status Under Contract
-
2026-05-19$40,000 New
-
2012-01-27soldstatus $68,000
-
2005-06-06soldstatus $48,000
-
2001-04-02soldstatus $45,500
-
1992-11-02soldstatus $40,000
ⓘ Source: listings_history table (triggers on properties + properties_extension) + one-shot
backfill from property_details.listing_events for pre-trigger history.
Tax reassessment forecast GA · Resets to sale price
- Current annual tax
- $345 · $29/mo
- Projected year-2 tax
- $368 · $31/mo
- Expected delta
- +$23/yr (+$2/mo · 6.5%)
ⓘ Screening estimate from a state-policy table — verify with the county assessor before closing.
Climate risk First Street
- Flood 1/10 Low FEMA zone X (unshaded) · 0% chance over 30 yrs
- Wildfire 8/10 Severe
- Heat 8/10 Severe 7 d/yr ≥109°F today · 19 d/yr by 30 yrs out
- Wind 9/10 Extreme 99% chance of damaging wind over 30 yrs
- Air quality 7/10 Severe 15 unhealthy d/yr today · 15 by 30 yrs out
Nearby sold comps map
Loading sold comps map…
Walkable amenities ~0.75 mi
Loading nearby amenities…
Taxation est. · year 1
- Rental income
- $11,940
- − Mortgage interest
- −$2,241
- − Property taxes
- −$345
- − Insurance
- −$200
- − Repairs & maintenance
- −$955
- − Management
- −$955
- − Depreciation
- −$1,164
- Taxable income
- $6,080
- Est. tax owed @ 24.0%
- −$1,459
- After-tax cash flow
- $4,911/yr
For passive investors: Depreciation is non-cash, so a rental often shows a tax loss while cash-flowing — sheltering income. Rental losses are passive: they offset passive income freely, and up to $25,000/yr can offset ordinary (W-2) income if you actively participate and your MAGI is under $100k (phasing out to $0 by $150k); unused losses carry forward. On sale, claimed depreciation is recaptured at up to 25%, and gains may owe capital-gains tax (a 1031 exchange can defer both). Figures are a year-1 estimate at your 24.0% rate — not tax advice; consult a CPA.
Schools (NCES district)
- District
- Charlton County
- NCES district ID
- 1300990
- Math proficiency
- 28% ▼ -14.00%
- Reading proficiency
- 33% ▼ -5.00%
- Median HH income
- $41,024
- Composite
- 25.75/100
- National rank
- #7374
- State rank
- #94 of 174 in GA
Livability — Folkston
- Score
- 66/100
- State rank
- #191
- US rank
- #11801
Category grades
Schools grade is shown separately in the Schools card above.
Census & demographics
- Census place
- Folkston, GA
- Population (ZIP)
- 9,343
Population outlook (Charlton County) Hauer SSP2
- Today (2025)
- 13,147 people
- By 2030
- 13,116 · -0.2%
- By 2040
- 13,025 · -0.9%
- By 2050
- 12,954 · -1.5%
- By 2075
- 12,941 · -1.6%
- By 2100
- 11,206 · -14.8%
Race, ethnicity, and origin ACS 2023
- Neighborhood character
- Diverse neighborhood (Simpson 0.57)
- Race & ethnicity
- White 56% Black 33% Two or more races 5% Hispanic / Latino 5% Asian 1%
- Common ancestry
- Italian 1% Slovak 1%
- Foreign-born
- 2% · Canada, Jamaica
- Languages at home
- 96% English-only · Spanish 3%
Political lean MEDSL · Charlton
- 2024 margin
- Solid R (+56.2) · D 21.8% · R 77.9%
- 2008→2024 swing
- -21.7pp toward R · 2008: -34.4pp · 2024: -56.2pp
- All cycles
- 2024: R+56.2 2020: R+50.7 2016: R+48.5 2012: R+35.3 2008: R+34.4
Not yet ingested
- Civics
- —
Market trends
- HPI YoY
- ▲ 5.49%
- Current HPI
- 318.9275
- Rent YoY
- —
- Metro
- —
- State GDP YoY
- ▲ 2.66%
- F500 in state
- 28
Industry mix (Fortune 500 HQ in GA)
| Industry | F500 HQs | Revenue |
|---|---|---|
| Paper / Packaging | 2 | $29B |
|
||
| Retail | 1 | $160B |
|
||
| Transportation / Logistics | 1 | $91B |
|
||
| Airlines | 1 | $62B |
|
||
| Consumer Goods | 1 | $47B |
|
||
| Utilities | 1 | $25B |
|
||
Price history
+0.0% since first listed6 events — show timeline
- 2026-05-21 Pending — GAMLS
- 2026-05-19 Listed $40,000 GAMLS
- 2012-01-27 Sold (Public Records) $68,000 Public Records
- 2005-06-06 Sold (Public Records) $48,000 Public Records
- 2001-04-02 Sold (Public Records) $45,500 Public Records
- 1992-11-02 Sold (Public Records) $40,000 Public Records
Property tax history
-4.9%/yrLatest (2025): $345 · +14.8% YoY. Source: county tax records.
Cash-flow waterfall
monthlySold comps — $/sqft
last 12 mo · ≤1 miLoading sold comps…