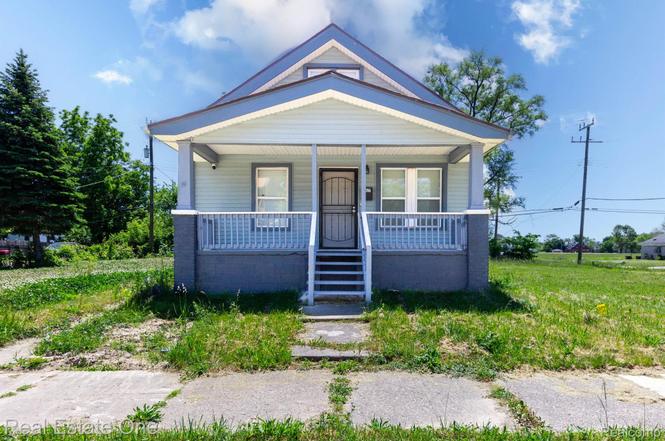
6427 Linsdale St · Detroit, MI
Flood risk 1/10 · Minimal
- FEMA flood zone
- X (unshaded)
- Chance of flooding over 30 yrs
- 0.0%
- Est. flood insurance / yr
- $473 – $860
Fire risk 1/10 · Minimal
- Est. fire insurance / yr
- $784 – $1,456
Heat risk 3/10 · Minor
- Hot days now (above 97°F)
- 7 days/yr
- Hot days in 30 yrs
- 15 days/yr
Wind risk 2/10 · Minimal
- Chance of severe wind over 30 yrs
- —
Air-quality risk 4/10 · Minor
- Unhealthy air days now
- 4 days/yr
- Unhealthy air days in 30 yrs
- 6 days/yr
Risk factors via First Street. Map © Google.
Why this score? — see what drove the C- grade
The composite is a weighted blend of 9 inputs, each scored 0–100. Each bar is that input's sub-score; the figure is the points it added to the 100-point composite (weight × sub-score).
- Cash flow +17.5/30.0
- Appreciation +10.0/10.0
- ARV discount +7.5/15.0
- DSCR +5.4/10.0
- Livability +3.7/5.0
- 1% rule +3.6/10.0
- Rent growth +2.5/5.0
- Condition / age +2.5/5.0
- Schools +1.3/10.0
$134,900
🖨 Deal sheet (PDF) 📄 Offer letter ✓ Due diligence
Listing remarks MLS
Welcome to 6427 Linsdale, Detroit! This well-maintained 3-bedroom, 1-bath home offers comfort, value, and numerous updates throughout. Major improvements completed within the last few years include the furnace, siding, roof, kitchen, bathroom, and hot water tank, providing peace of mind for the next owner. The home features a functional layout with spacious living areas, an updated kitchen and bath, and is conveniently located near schools, shopping, restaurants, and major freeways. Whether you're a first-time homebuyer or an investor, this move-in-ready property presents an excellent opportunity. With its desirable location and extensive updates, it also offers strong rental potential for those looking to add a solid income-producing property to their portfolio.
Key facts
- Updated bath
- Major improvements
- Updated kitchen
Tags
Property features AI
Exterior
- Parking: No garage
- Utilities: Public water; Public sewer
- Home design: Single-family residence; One and one-half stories; Ground-level entry with steps; Vinyl siding
- Construction: Block foundation
- Exterior features: Paved road access; Lot approximately 0.08 acres (35 x 104.26)
Interior
- Kitchen: No appliances listed
- Bedrooms: 6 total rooms (bedroom count not specified)
- Bathrooms: 1 full bathroom
- Heating & cooling: Forced air heating (natural gas); No cooling
- Interior features: Unfinished basement
- Laundry & utility: Has heating system (forced air, natural gas)
Neighborhood map
What this means for you Summary
Snapshot
- This is a 3-bed/1.0-bath single-family listed at $135k.
Deal economics
- At list price, monthly cash flow is $103 ($1k/yr) — positive.
- The deal already cash-flows at list — no discount required.
- To meet the 1% rule (rent ≥ 1% of price), the offer needs to be $116k (13.7% below list).
- Recommended offer: $116k (13.7% below list) — sets the bar for 1% rule.
- Cap rate 7.2% vs local median 10.0% in Detroit — below-typical yield; the buyer is paying a premium for something (appreciation thesis, condition, location) that the cap rate doesn't capture.
Location & tenants
- Location reads 73/100 on livability (#218 in MI) — a middle-class / working-renter tenant base. Strengths: amenities A+, commute A+, cost of living A+; Watch: crime F, employment F.
- Detroit Public Schools Community District (urban): math 10% / reading 24% proficiency, ranked #499 of 540 in MI (top 92%) — low school quality limits family demand, transient renter base, plan for 1-2y turnover; 90% free/reduced lunch — lower-income household profile, screen leases tightly.
- Zoned schools: Sampsonwebber Leadership Academy (350 students, 95% FRL); Northwestern High School (math 10% / reading 10%, grade F, #659 of 713 statewide, top 97%, 358 students, 88% FRL) — zoned schools at 92% FRL track the district average.
- Market conditions: 248 active listings in the ZIP; 29 comparable units currently listed for rent nearby; rentals at typical pace (median 26d on market — plan ~3-4 weeks tenant-placement turnaround); 41% of comp listings sitting > 30 days — soft ceiling on asking rent; lower-income renter base — watch delinquency; 2,639 units permitted in Wayne County in 2024 (1,216 in 5+ unit buildings).
Forward outlook
- In year one you build about $14k of equity ($933 loan paydown + $13k appreciation (10.0% local appreciation)).
- Wayne County population projected at -17% by 2050 — secular population decline; favor cash flow + early exit over multi-decade hold.
- At projected returns (10.0% appreciation + 3.0% rent growth), your $38k cash investment doubles in ~3 years — after that, you're playing with house money.
- By year 3, paydown + projected appreciation supports a ~$37k cash-out refi (75% LTV) — recoverable capital for the next deal without selling this one.
Negotiation context
- Only 6 days on market — expect competitive offers; lowballing is unlikely to land.
- 11 sale attempts since 22y ago with the ask held roughly flat each time — persistent listings suggest the price (not the market) is what's stuck; bring a comps-based counter.
- Current owner paid $2k; list at $135k implies a 6032% gain — meaningful room to come down on a strong offer.
Risks & watch-outs
- Watch-outs: built in 1926 — expect roof / HVAC / electrical / plumbing capex.
Questions for the listing agent
- Built in 1926 — when were the roof, HVAC, electrical panel, plumbing, and water heater last replaced?
- Is there a deadline driving the sale (1031 exchange, divorce, estate, relocation)? That informs how much negotiation room exists.
- Schools are F-rated, which usually means shorter tenancies and higher turnover. Who's the typical renter profile here, and what's been the actual vacancy rate?
- Crime grade is F in this area — have there been break-ins, vandalism, or insurance claims at this property in the last 3 years? What carrier currently insures it and at what premium?
- What's the average days-on-market for RENTAL listings here right now (not sales)? A rising rental-DOM trend means longer vacancies and softer asking-rent achievability than the comps imply.
- What's the recent tenant-quality profile in this submarket — average credit score on applications, eviction rate, late-payment / NSF rate, and stable-employment percentage? A property-management company in the area should have these aggregated.
- How much new for-sale + rental construction is in the pipeline within 1–3 miles? Heavy new supply typically softens prices + rents 12–24 months out; constrained supply supports both.
Investment metrics
- 1% rule
- 0.86% ✗
- Cap rate
- 7.20%
- Cash-on-cash
- 3.26%
- DSCR
- 1.14
- GRM
- 9.7
CMA / ARV
- ARV (on-the-fly)
- $76,680
- Comps found
- 12
Show comp detail 12 sales within ~0.75 mi
| Address | Dist | Beds/Ba | Sqft | Sold | Price | $/sf | Match |
|---|---|---|---|---|---|---|---|
| 8801 Monica St | 0.23mi | 3/1.0 | 1,176 (+9%) | 1mo | $120,000 | $102 | 74 |
| 7007 Joy Rd | 0.22mi | 4/1.0 (+1) | 1,200 (+11%) | 0mo | $85,000 | $71 | 66 |
| 7722 Wykes St | 0.43mi | 3/1.0 | 1,148 (+6%) | 4mo | $40,000 | $35 | 66 |
| 8849 Roselawn St | 0.54mi | 3/1.0 | 1,015 (-6%) | 4mo | $58,000 | $57 | 61 |
| 8245 Carbondale St | 0.29mi | 3/2.0 | 960 (-11%) | 4mo | $25,000 | $26 | 60 |
| 8553 Cloverlawn St | 0.55mi | 3/1.0 | 1,012 (-6%) | 5mo | $84,000 | $83 | 60 |
| 8294 Northlawn St | 0.56mi | 3/1.0 | 998 (-8%) | 4mo | $52,000 | $52 | 58 |
| 8088 Ohio St | 0.64mi | 3/1.0 | 1,002 (-7%) | 1mo | $83,000 | $83 | 57 |
| 9196 American St | 0.54mi | 2/1.0 (-1) | 1,035 (-4%) | 8mo | $90,000 | $87 | 56 |
| 8131 Greenlawn St | 0.45mi | 3/1.0 | 960 (-11%) | 6mo | $26,000 | $27 | 55 |
| 9115 Roselawn St | 0.65mi | 3/1.0 | 1,025 (-5%) | 13mo | $50,000 | $49 | 50 |
| 8136 Roselawn St | 0.48mi | 3/1.5 | 919 (-15%) | 10mo | $65,000 | $71 | 42 |
Match score weights: distance 35% · size 25% · config 20% · recency 20%. Top-matched comps best support the ARV.
Projected returns pro-forma
10.0% appreciation · 3.0% rent growth · sell at horizon
- IRR
- 26.6%
- Equity multiple
- 3.12×
- Total profit
- $79,947
- Equity at exit
- $121,529
- IRR
- 23.3%
- Equity multiple
- 7.09×
- Total profit
- $230,189
- Equity at exit
- $262,081
Cash invested: $37,772 (down + closing). Projections, not guarantees.
Landlord ↔ Tenant lean methodology
- Overall (STATE)
- 62 Landlord-Friendly
- State Michigan
- 62 Landlord-Friendly · EVEN
- County
- — inherits STATE
- City
- — inherits STATE
ZIP-level market 48204
- Home prices YoY
- 18.5%
- Active inventory
- 248
- Price-to-rent
- 9.7×
Monthly cashflow live
- Estimated rent
- $1,164 high interval (Pro) →
- Mortgage (P&I)
- −$707
- Tax from tax record
- −$53 /mo · $640/yr
- Insurance
- −$56
- HOA
- −$0
- Vacancy / Maint / Mgmt
- −$244
- Net cashflow
- $103
Break-even live
Sensitivity live
| Price | -10% $179 | -5% $141 | +0% $103 | +5% $64 | +10% $26 |
|---|---|---|---|---|---|
| Rent | -10% $11 | -5% $57 | +0% $103 | +5% $148 | +10% $194 |
| Rate | -1.0pp $170 | -0.5pp $137 | base $103 | +0.5pp $68 | +1.0pp $32 |
UW: 25.0% down · 7.5% · 30yr · 1.5% tax · 5.0% vac · 8.0% maint · 8.0% mgmt
Financing live
Cash to close
- Down payment
- $33,725
- Closing costs
- $4,047
- Reserves months
- —
- Total cash needed
- —
Loan-product check · same deal, 3 products live
Conventional
25% down · 7.5% · 30yr
- Down + closing
- —
- Monthly P&I
- —
- Monthly cashflow
- —
- DSCR
- —
- Eligible?
- —
Personal DTI + credit; lowest rate.
DSCR
20% down · 8.5% · 30yr
- Down + closing
- —
- Monthly P&I
- —
- Monthly cashflow
- —
- DSCR
- —
- Eligible?
- —
No personal income docs; deal must DSCR.
Hard money
10% down · 12.0% · 12mo
- Down + closing
- —
- Monthly P&I
- —
- Monthly cashflow
- —
- DSCR
- —
- Eligible?
- —
Short-term bridge; refi at stabilization.
Rent comps 29 comps
| Address | Beds | Baths | Sqft | Rent | $/sqft | DOM | Units | Dist |
|---|---|---|---|---|---|---|---|---|
| 8353 Alpine St Detroit, MI | 2.0 | 1.0 | 1000 | $1,050 | $1.05 | 45d | 1 | 0.34mi |
| 8762 Epworth St Unit 8768 Detroit, MI | 2.0 | 1.0 | 900 | $995 | $1.11 | 0d | 1 | 0.41mi |
| 8544 Cloverlawn St Detroit, MI | 2.0 | 1.0 | 800 | $800 | $1.00 | 19d | 1 | 0.51mi |
| 7424 Wykes St Detroit, MI | 3.0 | 1.0 | 1200 | $1,100 | $0.92 | 45d | 1 | 0.58mi |
| 8230 Ohio St Detroit, MI | 3.0 | 1.0 | 1350 | $1,200 | $0.89 | 18d | 1 | 0.60mi |
| 9022 Northlawn St Detroit, MI | 2.0 | 1.0 | 1100 | $1,300 | $1.18 | 26d | 1 | 0.66mi |
| 8143 Wisconsin St Detroit, MI | 4.0 | 1.0 | 1370 | $1,800 | $1.31 | 0d | 1 | 0.70mi |
| 5398 Allendale St Detroit, MI | 2.0 | 1.0 | 1100 | $1,200 | $1.09 | 26d | 1 | 0.76mi |
| 5101 Oregon St Detroit, MI | 2.0 | 1.0 | 1000 | $1,049 | $1.05 | 45d | 1 | 0.88mi |
| 9917 Woodside St Apt 1 Detroit, MI | 2.0 | 1.0 | 800 | $800 | $1.00 | 45d | 1 | 0.97mi |
| 4915 Maplewood St Detroit, MI | 3.0 | 1.0 | 1324 | $1,100 | $0.83 | 18d | 1 | 0.97mi |
| 5440 Milford St Unit 1 Detroit, MI | 2.0 | 1.0 | 850 | $1,150 | $1.35 | 45d | 1 | 1.01mi |
| 9353 Kentucky St Detroit, MI | 2.0 | 1.0 | 800 | $999 | $1.25 | 19d | 1 | 1.03mi |
| 4566 Seebaldt St Detroit, MI | 2.0 | 1.0 | 1200 | $1,250 | $1.04 | 24d | 1 | 1.15mi |
| 4345 W Euclid St Unit 2 Detroit, MI | 3.0 | 1.0 | 1300 | $1,450 | $1.12 | 26d | 1 | 1.22mi |
| 4345 W Euclid St Unit 1 Detroit, MI | 3.0 | 1.0 | 1300 | $1,400 | $1.08 | 26d | 1 | 1.22mi |
| 6307 Woodrow St Detroit, MI | 2.0 | 1.0 | 1000 | $750 | $0.75 | 45d | 1 | 1.24mi |
| 8283 Pinehurst St Unit 2 Detroit, MI | 2.0 | 1.0 | 1000 | $900 | $0.90 | 45d | 1 | 1.25mi |
| 10303 Morley St #1 Detroit, MI | 2.0 | 1.0 | 950 | $950 | $1.00 | 45d | 1 | 1.29mi |
| 9376 Otsego St Detroit, MI | 3.0 | 1.0 | 873 | $1,396 | $1.60 | 45d | 1 | 1.31mi |
| 10359 Violetlawn St Unit 1 Detroit, MI | 2.0 | 1.0 | 1200 | $985 | $0.82 | 45d | 1 | 1.37mi |
| 10345 Crocuslawn Ave Unit 2 Detroit, MI | 2.0 | 1.0 | 850 | $950 | $1.12 | 45d | 1 | 1.38mi |
| 12019 Stoepel St Detroit, MI | 2.0 | 1.0 | 1000 | $943 | $0.94 | 7d | 1 | 1.41mi |
| 3786 Carter St Unit 2 Detroit, MI | 3.0 | 1.0 | 1400 | $1,100 | $0.79 | 26d | 1 | 1.42mi |
| 12032 Santa Rosa Dr Unit 1 Detroit, MI | 3.0 | 1.0 | 900 | $1,278 | $1.42 | 0d | 1 | 1.43mi |
| 4016 Hogarth St Unit 4018 Hogarth Lower Detroit, MI | 2.0 | 1.0 | 1200 | $1,100 | $0.92 | 5d | 1 | 1.44mi |
| 3757 Blaine St Detroit, MI | 3.0 | 1.0 | 1169 | $1,480 | $1.27 | 18d | 1 | 1.44mi |
| 3759 Atkinson St Unit 2 Detroit, MI | 2.0 | 1.0 | 919 | $1,200 | $1.31 | 26d | 1 | 1.49mi |
| 4426 McGraw Ave Unit 1 Detroit, MI | 3.0 | 1.0 | 1400 | $1,200 | $0.86 | 45d | 1 | 1.50mi |
Listing history 5 events
-
2026-06-21days on market $134,900 Active 6 DOM
-
2026-06-18days on market $134,900 Active 3 DOM
-
2026-06-17days on market $134,900 Active 2 DOM
-
2026-06-15remarks 693-char remark
-
2026-06-15$134,900 Active 1 DOM
ⓘ Source: listings_history table (triggers on properties + properties_extension) + one-shot
backfill from property_details.listing_events for pre-trigger history.
Tax reassessment forecast MI · Partial reset (capped growth)
- Current annual tax
- $640 · $53/mo
- Projected year-2 tax
- $1,359 · $113/mo
- Expected delta
- +$719/yr (+$60/mo · 112.3%)
ⓘ Screening estimate from a state-policy table — verify with the county assessor before closing.
Climate risk First Street
- Flood 1/10 Low FEMA zone X (unshaded) · 0% chance over 30 yrs
- Wildfire 1/10 Low
- Heat 3/10 Moderate 7 d/yr ≥97°F today · 15 d/yr by 30 yrs out
- Wind 2/10 Low
- Air quality 4/10 Moderate 4 unhealthy d/yr today · 6 by 30 yrs out
Nearby sold comps map
Loading sold comps map…
Walkable amenities ~0.75 mi
Loading nearby amenities…
Taxation est. · year 1
- Rental income
- $13,967
- − Mortgage interest
- −$7,556
- − Property taxes
- −$640
- − Insurance
- −$674
- − Repairs & maintenance
- −$1,117
- − Management
- −$1,117
- − Depreciation
- −$3,924
- Taxable loss
- −$1,063
- Est. tax savings @ 24.0%
- +$255
- After-tax cash flow
- $1,485/yr
For passive investors: Depreciation is non-cash, so a rental often shows a tax loss while cash-flowing — sheltering income. Rental losses are passive: they offset passive income freely, and up to $25,000/yr can offset ordinary (W-2) income if you actively participate and your MAGI is under $100k (phasing out to $0 by $150k); unused losses carry forward. On sale, claimed depreciation is recaptured at up to 25%, and gains may owe capital-gains tax (a 1031 exchange can defer both). Figures are a year-1 estimate at your 24.0% rate — not tax advice; consult a CPA.
Schools (NCES district)
- District
- Detroit Public Schools Community District
- NCES district ID
- 2601103
- Math proficiency
- 10% ▼ -2.00%
- Reading proficiency
- 24% ▲ 6.00%
- Median HH income
- $25,815
- Composite
- 13.06/100
- National rank
- #9564
- State rank
- #499 of 540 in MI
Livability — Detroit
- Score
- 73/100
- State rank
- #218
- US rank
- #5427
Category grades
Schools grade is shown separately in the Schools card above.
Census & demographics
- Census place
- Detroit, MI
- County
- Wayne County · 1,562,939 people
- City population
- 572,865
- Metro
- Detroit-Warren-Dearborn, MI
- Population (ZIP)
- 20,696
- Household income
- $34,468
- Rent vs Own
- Severe rent burden
- 1418.0
Population outlook (Wayne County) Hauer SSP2
- Today (2025)
- 1,675,273 people
- By 2030
- 1,620,300 · -3.3%
- By 2040
- 1,502,341 · -10.3%
- By 2050
- 1,384,039 · -17.4%
- By 2075
- 1,124,592 · -32.9%
- By 2100
- 881,193 · -47.4%
Race, ethnicity, and origin ACS 2023
- Neighborhood character
- Predominantly Black (86%)
- Race & ethnicity
- Black 86% Two or more races 7% Hispanic / Latino 5% White 4% Native American 2%
- Hispanic origin (detail)
- Mexican 4%
- Common ancestry
- Hispanic 1% Romanian 1%
- Foreign-born
- 2% · Canada
- Languages at home
- 95% English-only · Spanish 4%
Political lean MEDSL · Wayne
- 2024 margin
- Strong D (+29.0) · D 62.7% · R 33.7% · Other 3.6%
- 2008→2024 swing
- -20.5pp toward R · 2008: 49.5pp · 2024: 29.0pp
- All cycles
- 2024: D+29.0 2020: D+38.1 2016: D+37.3 2012: D+46.9 2008: D+49.5
Not yet ingested
- Civics
- —
Market trends
- HPI YoY
- ▲ 36.51%
- Current HPI
- 234.0465
- Rent YoY
- —
- Metro
- Detroit-Warren-Dearborn, MI
- State GDP YoY
- ▲ 1.37%
- F500 in state
- 28
Industry mix (Fortune 500 HQ in MI)
| Industry | F500 HQs | Revenue |
|---|---|---|
| Automotive Parts | 3 | $48B |
|
||
| Automotive | 2 | $372B |
|
||
| Chemicals | 1 | $45B |
|
||
| Automotive Retail | 1 | $29B |
|
||
| Healthcare / Medical Devices | 1 | $23B |
|
||
| Automotive Technology | 1 | $20B |
|
||
Price history
+280.0% since first listed22 events — show timeline
- 2026-06-08 Listed $134,900 REALCOMP
- 2026-06-08 Listed $134,900 MiRealSource-MiMLS
- 2014-05-09 Listing Removed — REALCOMP
- 2014-05-09 Listing Removed — MiRealSource-MiMLS
- 2014-04-02 Listing Removed — REALCOMP
- 2014-04-02 Listing Removed — MiRealSource-MiMLS
- 2014-04-02 Listed $4,750 REALCOMP
- 2014-04-02 Listed $4,750 MiRealSource-MiMLS
- 2013-11-13 Listed $4,750 REALCOMP
- 2013-11-13 Listed $4,750 MiRealSource-MiMLS
- 2013-02-20 Listing Removed — MiRealSource-MiMLS
- 2013-02-20 Listing Removed — REALCOMP
- 2012-12-17 Listed $2,500 MiRealSource-MiMLS
- 2012-12-17 Listed $2,500 REALCOMP
- 2012-06-20 Sold (MLS) $2,200 REALCOMP
- 2012-06-20 Sold (MLS) $2,200 MiRealSource-MiMLS
- 2012-03-01 Listed $2,500 REALCOMP
- 2012-03-01 Listed $2,500 MiRealSource-MiMLS
- 2004-08-16 Sold (Public Records) $63,000 Public Records
- 2004-03-11 Sold (MLS) $26,500 MiRealSource-MiMLS
- 2004-03-05 Listing Removed — MiRealSource-MiMLS
- 2004-02-13 Listed $35,500 MiRealSource-MiMLS
Property tax history
-6.4%/yrLatest (2025): $640 · -49.6% YoY. Source: county tax records.
Cash-flow waterfall
monthlySold comps — $/sqft
last 12 mo · ≤1 miLoading sold comps…