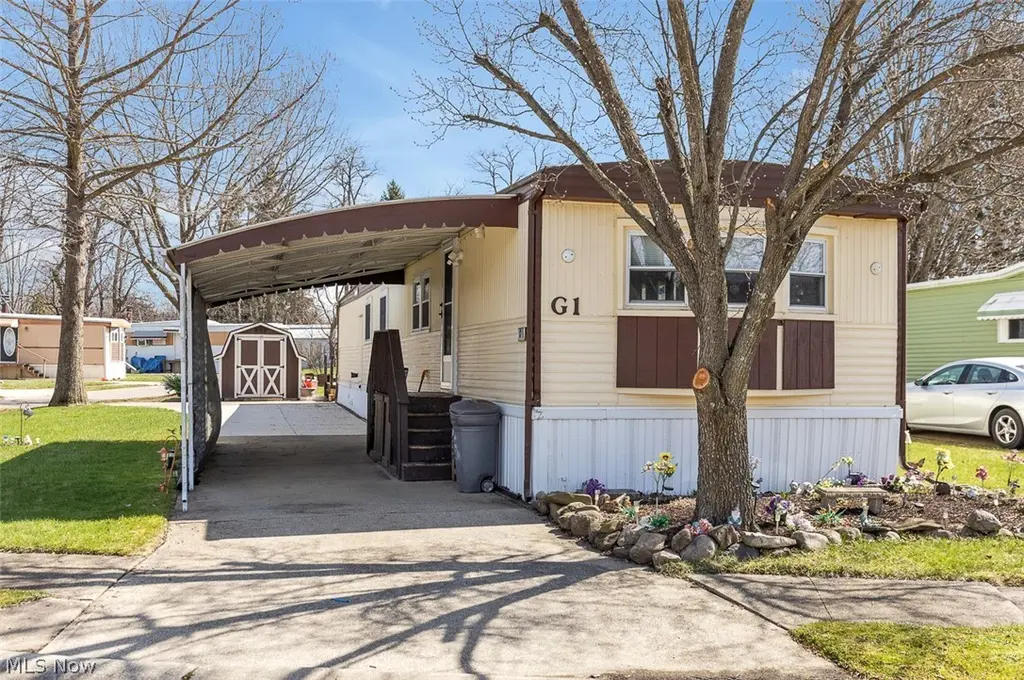
1166 Lafayette Rd Unit G1 · Medina, OH
Flood risk 5/10 · Moderate
- FEMA flood zone
- X (unshaded)
- Chance of flooding over 30 yrs
- 0.66%
- Est. flood insurance / yr
- $507 – $1,088
Fire risk 1/10 · Minimal
- Est. fire insurance / yr
- $713 – $1,323
Heat risk 2/10 · Minimal
- Hot days now (above 98°F)
- 7 days/yr
- Hot days in 30 yrs
- 16 days/yr
Wind risk 1/10 · Minimal
- Chance of severe wind over 30 yrs
- —
Air-quality risk 2/10 · Minimal
- Unhealthy air days now
- 1 days/yr
- Unhealthy air days in 30 yrs
- 2 days/yr
Risk factors via First Street. Map © Google.
Why this score? — see what drove the B grade
The composite is a weighted blend of 9 inputs, each scored 0–100. Each bar is that input's sub-score; the figure is the points it added to the 100-point composite (weight × sub-score).
- Cash flow +30.0/30.0
- 1% rule +10.0/10.0
- DSCR +10.0/10.0
- ARV discount +7.5/15.0
- Schools +6.3/10.0
- Livability +3.8/5.0
- Condition / age +3.8/5.0
- Rent growth +3.5/5.0
- Appreciation +0.0/10.0
$65,000
🖨 Deal sheet (PDF) 📄 Offer letter ✓ Due diligence
Listing remarks
This beautifully maintained mobile home is move in ready and won't last long! Situated on a desirable corner lot, this home features a convenient horseshoe driveway and a spacious attached carport. Enjoy the recently updated wraparound porch . This home has been exceptionally cared for throughout the years . The furnace and air conditioning have been professionally maintained and inspected annually for peace of mind. This home also features newer windows and front door (less than 2 yrs. old). Inside , you'll find a bright inviting layout with a large eat-in kitchen offering an abundance of cabinet space and a pantry. The home comes fully equipped with appliances including washer, dryer, d
Key facts
- Attached carport
- Horseshoe driveway
- Newer windows
Tags
Neighborhood map
What this means for you Summary
Snapshot
- This is a 3-bed/1.0-bath single-family listed at $65k. Condition is rated good.
Deal economics
- At list price, monthly cash flow is $682 ($8k/yr) — positive.
- The deal already cash-flows at list — no discount required.
- Meets the 1% rule at list price ($2k rent vs $65k).
- Recommended offer: $64k (1.5% below list) — sets the bar for market timing.
- Cap rate 18.9% vs local median 3.0% in Medina — top-decile yield for the area; either an underpriced asset or a hidden risk that comps aren't pricing in. Stress-test before assuming the spread holds.
Location & tenants
- Location reads 76/100 on livability (#209 in OH, #3,302 nationally) — a middle-class / working-renter tenant base. Strengths: crime A+, cost of living A+, housing A+; Watch: amenities F, commute F, health & safety F.
- Medina City SD (suburban): math 70% / reading 74% proficiency, ranked #115 of 656 in OH (top 18%) — strong family-tenant draw, lease renewals of 3-5y typical; only 16% free/reduced lunch — higher-income household profile.
- Zoned schools: H G Blake Elementary School (math 77% / reading 82%, grade A, #173 of 1,584 statewide, top 12%, 424 students, 13% FRL); A. I. Root Middle School (math 73% / reading 78%, grade A, #78 of 654 statewide, top 12%, 678 students, 12% FRL); Medina High School (math 57% / reading 77%, grade B, #137 of 781 statewide, top 19%, 1,998 students, 14% FRL) — zoned schools at 13% FRL track the district average.
- Market conditions: Rents rising fast (+4.2%/yr); 367 active listings in the ZIP; 1 comparable units currently listed for rent nearby; solid renter incomes; 471 units permitted in Medina County in 2024 (0 in 5+ unit buildings).
Forward outlook
- Local home prices are declining (-3.0%/yr); year-one equity from $449 of loan paydown is wiped out by about $2k of value loss. Plan a longer hold.
- At projected returns (-3.0% appreciation + 4.2% rent growth), your $18k cash investment doubles in ~3 years — after that, you're playing with house money.
Negotiation context
- It's been on market 21 days — a 2% lower offer ($64k) is reasonable based on typical stale-listing flexibility.
- 2 sale attempts; this cycle's ask has dropped $10k (13%) from the opening price — seller is motivated, your offer sets the floor, not the list.
Risks & watch-outs
- Watch-outs: HOA is 21% of rent.
- Climate carrying-cost: moderate flood risk — expect insurance premiums to compound above CPI over the hold.
Questions for the listing agent
- What does the HOA fee cover, when was the last increase, and are there any pending special assessments or reserve-fund shortfalls?
- Is there a deadline driving the sale (1031 exchange, divorce, estate, relocation)? That informs how much negotiation room exists.
- Schools are A-rated — typically a magnet for longer-tenancy family renters. What's the average tenant stay here, and is there a school-zone premium baked into asking?
- What's the average days-on-market for RENTAL listings here right now (not sales)? A rising rental-DOM trend means longer vacancies and softer asking-rent achievability than the comps imply.
- What's the recent tenant-quality profile in this submarket — average credit score on applications, eviction rate, late-payment / NSF rate, and stable-employment percentage? A property-management company in the area should have these aggregated.
- How much new for-sale + rental construction is in the pipeline within 1–3 miles? Heavy new supply typically softens prices + rents 12–24 months out; constrained supply supports both.
Investment metrics
- 1% rule
- 3.00% ✓
- Cap rate
- 18.88%
- Cash-on-cash
- 44.96%
- DSCR
- 3.00
- GRM
- 2.8
CMA / ARV
- ARV (median comp)
- $416,592
- List price
- $65,000
- Delta
- -83.20%
- Verdict
- UNDERPRICED
- Comps
- 14 within 1.0 mi
Show comp detail 1 sale within ~0.75 mi
| Address | Dist | Beds/Ba | Sqft | Sold | Price | $/sf | Match |
|---|---|---|---|---|---|---|---|
| 5831 Deerview Ln | 0.42mi | 4/2.0 (+1) | 1,144 (+9%) | 11mo | $375,000 | $328 | 48 |
Match score weights: distance 35% · size 25% · config 20% · recency 20%. Top-matched comps best support the ARV.
Projected returns pro-forma
-3.0% appreciation · 4.16% rent growth · sell at horizon
- IRR
- 44.0%
- Equity multiple
- 2.95×
- Total profit
- $35,480
- Equity at exit
- $9,692
- IRR
- 50.8%
- Equity multiple
- 6.36×
- Total profit
- $97,635
- Equity at exit
- $5,620
Cash invested: $18,200 (down + closing). Projections, not guarantees.
Landlord ↔ Tenant lean methodology
- Overall (STATE)
- 73 Landlord-Friendly
- State Ohio
- 73 Landlord-Friendly · R+6
- County
- — inherits STATE
- City
- — inherits STATE
ZIP-level market 44256
- Rents YoY
- 4.2%
- Active inventory
- 367
- Price-to-rent
- 2.8×
Monthly cashflow live
- Estimated rent
- $1,951 medium interval (Pro) →
- Mortgage (P&I)
- −$341
- Tax est. 1.5%
- −$81 /mo · $975/yr
- Insurance
- −$27
- HOA
- −$410
- Lot rent
- −$0
- Vacancy / Maint / Mgmt
- −$410
- Net cashflow
- $682
Break-even live
Sensitivity live
| Price | -10% $727 | -5% $704 | +0% $682 | +5% $659 | +10% $637 |
|---|---|---|---|---|---|
| Rent | -10% $528 | -5% $605 | +0% $682 | +5% $759 | +10% $836 |
| Rate | -1.0pp $715 | -0.5pp $698 | base $682 | +0.5pp $665 | +1.0pp $648 |
UW: 25.0% down · 7.5% · 30yr · 1.5% tax · 5.0% vac · 8.0% maint · 8.0% mgmt
Financing live
Cash to close
- Down payment
- $16,250
- Closing costs
- $1,950
- Reserves months
- —
- Total cash needed
- —
Loan-product check · same deal, 3 products live
Conventional
25% down · 7.5% · 30yr
- Down + closing
- —
- Monthly P&I
- —
- Monthly cashflow
- —
- DSCR
- —
- Eligible?
- —
Personal DTI + credit; lowest rate.
DSCR
20% down · 8.5% · 30yr
- Down + closing
- —
- Monthly P&I
- —
- Monthly cashflow
- —
- DSCR
- —
- Eligible?
- —
No personal income docs; deal must DSCR.
Hard money
10% down · 12.0% · 12mo
- Down + closing
- —
- Monthly P&I
- —
- Monthly cashflow
- —
- DSCR
- —
- Eligible?
- —
Short-term bridge; refi at stabilization.
Rent comps 1 comps
| Address | Beds | Baths | Sqft | Rent | $/sqft | DOM | Units | Dist |
|---|---|---|---|---|---|---|---|---|
| 5777 Coneflower Dr Medina, OH | 2.0 | 2.0 | 1318 | $1,836 | $1.39 | 0d | 9 | 0.77mi |
HOA detail
- Monthly dues
- $410 · $4,920/yr
Listing history 19 events
-
2026-06-22days on market $65,000 Active 21 DOM
-
2026-06-21days on market $65,000 Active 20 DOM
-
2026-06-18days on market $65,000 Active 17 DOM
-
2026-06-17days on market $65,000 Active 16 DOM
-
2026-06-16days on market $65,000 Active 15 DOM
-
2026-06-15days on market $65,000 Active 14 DOM
-
2026-06-13days on market $65,000 Active 12 DOM
-
2026-06-13days on market $65,000 Active 11 DOM
-
2026-06-10price $65,000 Active 8 DOM
-
2026-06-09days on market $75,000 Active 8 DOM
-
2026-06-08days on market $75,000 Active 7 DOM
-
2026-06-07days on market $75,000 Active 6 DOM
-
2026-06-03days on market $75,000 Active 2 DOM
-
2026-06-02remarks 699-char remark
-
2026-06-02pricestatusdays on market $75,000 Active 1 DOM
-
2026-05-18historical
-
2026-04-27price $70,000
-
2026-04-07price $75,000
-
2026-03-27$90,000 Active
ⓘ Source: listings_history table (triggers on properties + properties_extension) + one-shot
backfill from property_details.listing_events for pre-trigger history.
Climate risk First Street
- Flood 5/10 Major FEMA zone X (unshaded) · 66% chance over 30 yrs
- Wildfire 1/10 Low
- Heat 2/10 Low 7 d/yr ≥98°F today · 16 d/yr by 30 yrs out
- Wind 1/10 Low
- Air quality 2/10 Low 1 unhealthy d/yr today · 2 by 30 yrs out
Nearby sold comps map
Loading sold comps map…
Walkable amenities ~0.75 mi
Loading nearby amenities…
Taxation est. · year 1
- Rental income
- $23,409
- − Mortgage interest
- −$3,641
- − Property taxes
- −$975
- − Insurance
- −$325
- − Repairs & maintenance
- −$1,873
- − Management
- −$1,873
- − HOA
- −$4,920
- − Depreciation
- −$1,891
- Taxable income
- $7,911
- Est. tax owed @ 24.0%
- −$1,899
- After-tax cash flow
- $6,284/yr
For passive investors: Depreciation is non-cash, so a rental often shows a tax loss while cash-flowing — sheltering income. Rental losses are passive: they offset passive income freely, and up to $25,000/yr can offset ordinary (W-2) income if you actively participate and your MAGI is under $100k (phasing out to $0 by $150k); unused losses carry forward. On sale, claimed depreciation is recaptured at up to 25%, and gains may owe capital-gains tax (a 1031 exchange can defer both). Figures are a year-1 estimate at your 24.0% rate — not tax advice; consult a CPA.
Condition & rehab AI · 12 photos
This move-in ready mobile home is well-maintained with good condition and minimal repairs needed. Updates to the interior and exterior can significantly increase its value for resale or rental.
Value-add opportunities
- Resale Paint interior walls — Fresh paint enhances curb appeal and interior aesthetics.
- Resale Replace carpet with hardwood or tile — Hardwood or tile flooring is more durable and adds value.
- Resale Update kitchen and bath fixtures — Modernizing these spaces can significantly increase the home's value.
- Both Landscaping improvements — Enhanced landscaping can improve curb appeal and add value for both resale and rental.
Renovation cost estimate screening
Value-add ROI direction
- Resale Paint interior walls — Fresh paint enhances curb appeal and interior aesthetics. ↑
- Resale Replace carpet with hardwood or tile — Hardwood or tile flooring is more durable and adds value. ↑
- Resale Update kitchen and bath fixtures — Modernizing these spaces can significantly increase the home's value. ↑
- Both Landscaping improvements — Enhanced landscaping can improve curb appeal and add value for both resale and rental. ↑
ⓘ Cost ranges are severity-bucket heuristics (US national rule-of-thumb). Get contractor quotes + a written scope before underwriting a rehab budget.
Schools (NCES district)
- District
- Medina City SD
- NCES district ID
- 3904438
- Math proficiency
- 70% ▼ -8.00%
- Reading proficiency
- 74% ▼ -4.00%
- Median HH income
- $69,725
- Composite
- 62.9/100
- National rank
- #661
- State rank
- #115 of 656 in OH
Livability — Medina
- Score
- 76/100
- State rank
- #209
- US rank
- #3302
Category grades
Schools grade is shown separately in the Schools card above.
Census & demographics
- Census place
- Medina, OH
- County
- Medina County · 145,517 people
- City population
- 64,924
- Metro
- Cleveland-Elyria, OH
- Population (ZIP)
- 64,924
- Household income
- $99,923
- Rent vs Own
- Severe rent burden
- 919.0
Population outlook (Medina County) Hauer SSP2
- Today (2025)
- 185,249 people
- By 2030
- 188,174 · +1.6%
- By 2040
- 190,350 · +2.8%
- By 2050
- 187,283 · +1.1%
- By 2075
- 177,108 · -4.4%
- By 2100
- 151,304 · -18.3%
Race, ethnicity, and origin ACS 2023
- Neighborhood character
- Predominantly White (90%)
- Race & ethnicity
- White 90% Two or more races 5% Hispanic / Latino 3% Black 2%
- Common ancestry
- Romanian 9% Italian 2% Lithuanian 2%
- Foreign-born
- 3% · Canada
- Languages at home
- 96% English-only · Spanish 2% Russian/Polish/Slavic 1% Other Indo-European 1%
Political lean MEDSL · Medina
- 2024 margin
- Strong R (+24.8) · D 37.2% · R 62.0%
- 2008→2024 swing
- -16.8pp toward R · 2008: -8.0pp · 2024: -24.8pp
- All cycles
- 2024: R+24.8 2020: R+23.4 2016: R+24.9 2012: R+13.1 2008: R+8.0
Not yet ingested
- Civics
- —
Market trends
- HPI YoY
- ▼ -191.25%
- Current HPI
- 257.2597
- Rent YoY
- ▲ 4.16%
- Metro
- Cleveland-Elyria, OH
- State GDP YoY
- ▲ 1.98%
- F500 in state
- 48
Industry mix (Fortune 500 HQ in OH)
| Industry | F500 HQs | Revenue |
|---|---|---|
| Insurance | 3 | $145B |
|
||
| Industrial Machinery | 3 | $49B |
|
||
| Financial Services | 3 | $24B |
|
||
| Consumer Goods | 2 | $93B |
|
||
| Aerospace / Defense | 2 | $47B |
|
||
| Utilities | 2 | $33B |
|
||
Price history
-27.8% since first listed6 events — show timeline
- 2026-06-09 Price Changed $65,000 MLSNOW
- 2026-05-29 Listed $75,000 MLSNOW
- 2026-05-18 Listing Removed — MLSNOW
- 2026-04-27 Price Changed $70,000 MLSNOW
- 2026-04-07 Price Changed $75,000 MLSNOW
- 2026-03-27 Listed $90,000 MLSNOW
Cash-flow waterfall
monthlySold comps — $/sqft
last 12 mo · ≤1 miLoading sold comps…