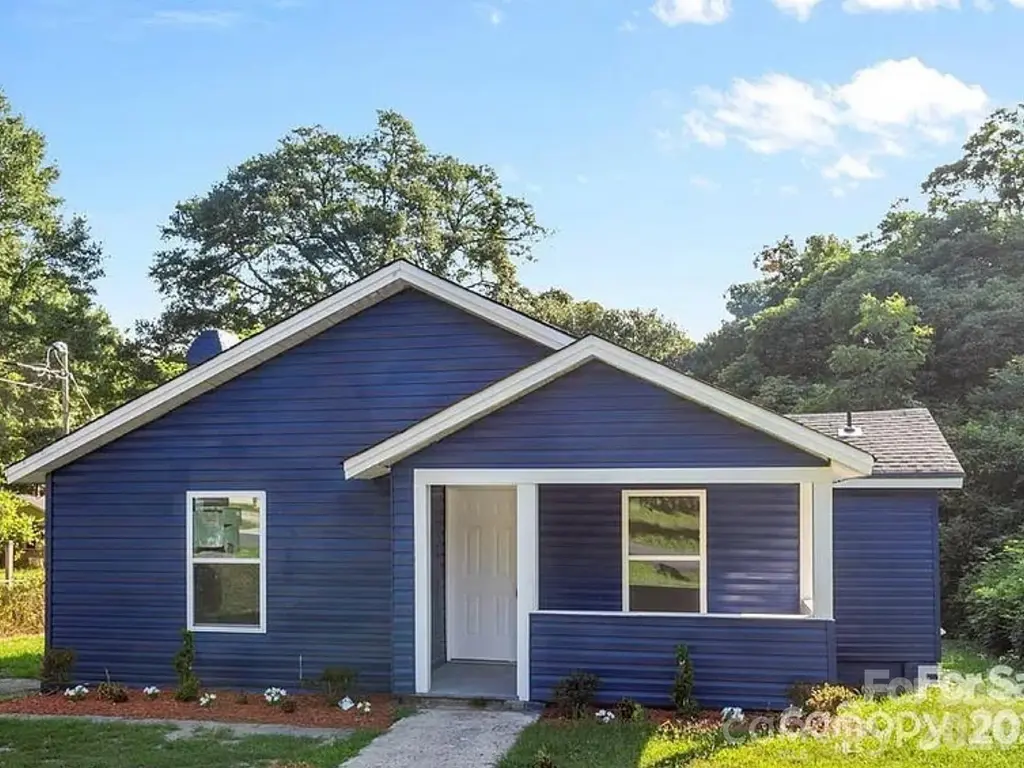
332 Mountain View St · Gastonia, NC
Flood risk 1/10 · Minimal
- FEMA flood zone
- X (unshaded)
- Chance of flooding over 30 yrs
- 0.0%
- Est. flood insurance / yr
- $507 – $1,088
Fire risk 3/10 · Minor
- Est. fire insurance / yr
- $906 – $1,684
Heat risk 6/10 · Moderate
- Hot days now (above 104°F)
- 7 days/yr
- Hot days in 30 yrs
- 16 days/yr
Wind risk 5/10 · Moderate
- Chance of severe wind over 30 yrs
- 22.0%
Air-quality risk 3/10 · Minor
- Unhealthy air days now
- 3 days/yr
- Unhealthy air days in 30 yrs
- 3 days/yr
Risk factors via First Street. Map © Google.
Why this score? — see what drove the D+ grade
The composite is a weighted blend of 9 inputs, each scored 0–100. Each bar is that input's sub-score; the figure is the points it added to the 100-point composite (weight × sub-score).
- ARV discount +15.0/15.0
- Cash flow +14.1/30.0
- DSCR +4.3/10.0
- Rent growth +3.9/5.0
- Schools +3.6/10.0
- 1% rule +3.2/10.0
- Livability +3.0/5.0
- Condition / age +2.5/5.0
- Appreciation +0.0/10.0
$190,000
🖨 Deal sheet (PDF) 📄 Offer letter ✓ Due diligence
Listing remarks
Perfect for any first time buyer! This fully renovated, like-new construction home offers 3 bedrooms and 1 bath with all the modern comforts you need. Enjoy a nice covered front porch and an open floor plan. The updated kitchen features quartz countertops and a beautiful backsplash. This GEM also boasts a brand new HVAC system, new plumbing and electrical updates, LVP flooring throughout, a fully tiled shower, fresh paint inside and out, new siding, and brand new windows. WOW! With convenient access to major highways, this home provides the perfect blend of modern comfort and suburban tranquility. Imagine cozy evenings in your beautifully updated living space, large backyard, peaceful morni
Key facts
- Covered front porch
- Open floor plan
- Quartz countertops
Tags
Property features AI
Finance
- HOA & community: No HOA
Exterior
- Parking: Detached carport (1 space); Driveway
- Utilities: Public water; Public sewer
- Home design: Single-family residence (residential); One level; R1 zoning
- Construction: Site-built construction; Vinyl exterior; Crawl space foundation; One-story
- Exterior features: Asphalt and concrete driveway/road surfaces; Publicly maintained road
Interior
- Kitchen: Dishwasher; Electric oven
- Bedrooms: 3 bedrooms (all on the main level)
- Flooring: Vinyl flooring
- Bathrooms: 1 full bathroom (main level)
- Heating & cooling: Heat pump heating; Central air conditioning
- Interior features: 6 total rooms; Dishwasher; Electric oven
- Laundry & utility: Laundry closet
Neighborhood map
What this means for you Summary
Snapshot
- This is a 3-bed/1.0-bath single-family listed at $190k.
Deal economics
- At list price, monthly cash flow is $26 ($315/yr) — positive.
- The deal already cash-flows at list — no discount required.
- To meet the 1% rule (rent ≥ 1% of price), the offer needs to be $156k (18.0% below list).
- Recommended offer: $156k (18.0% below list) — sets the bar for 1% rule.
- Cap rate 6.5% vs local median 3.7% in Gastonia — top-decile yield for the area; either an underpriced asset or a hidden risk that comps aren't pricing in. Stress-test before assuming the spread holds.
Location & tenants
- Location reads 59/100 on livability (#528 in NC) — a working-class tenant base; expect higher turnover. Strengths: cost of living A+, housing A+; Watch: employment D, crime F, amenities F.
- Gaston County Schools (suburban): math 44% / reading 42% proficiency, ranked #93 of 178 in NC (top 52%) — families likely to look elsewhere, expect single-tenant / working-renter base with shorter leases.
- Zoned schools: Lingerfeldt Elementary (math 22% / reading 22%, grade F, #1,190 of 1,410 statewide, top 86%, 408 students, 99% FRL); Southwest Middle (math 35% / reading 30%, grade F, #312 of 475 statewide, top 66%, 804 students, 100% FRL); Forestview High (math 72% / reading 59%, grade B, #159 of 535 statewide, top 30%, 1,081 students, 47% FRL) — zoned schools average 82% FRL vs 37% district-wide (45 pts higher); higher-poverty schools than district average — tighter screening recommended.
- Market conditions: Rents rising fast (+5.6%/yr); 352 active listings in the ZIP; 27 comparable units currently listed for rent nearby; rentals at typical pace (median 20d on market — plan ~3-4 weeks tenant-placement turnaround); 2,069 units permitted in Gaston County in 2024 (142 in 5+ unit buildings).
- This rent runs 38% of the median local income ($50k/yr) — at the standard rent-burdened threshold; future hikes will face affordability resistance.
Forward outlook
- Local home prices are declining (-3.0%/yr); year-one equity from $1k of loan paydown is wiped out by about $6k of value loss. Plan a longer hold.
- Gaston County population projected at +12% by 2050 — modest demand growth; plan on rents tracking national, not racing it.
Negotiation context
- It's been on market 61 days — a 6% lower offer ($179k) is reasonable based on typical stale-listing flexibility.
- 9 sale attempts since 2y ago; this cycle's ask has dropped $10k (5%) from the opening price — seller is motivated, your offer sets the floor, not the list.
- Current owner paid $30k; list at $190k implies a 533% gain — meaningful room to come down on a strong offer.
Risks & watch-outs
- Watch-outs: built in 1940 — expect roof / HVAC / electrical / plumbing capex.
- Climate carrying-cost: moderate wind risk, 22% chance of damaging wind over 30y; extreme-heat days projected 7→16/yr by 2055 (HVAC capex compounding) — expect insurance premiums to compound above CPI over the hold.
Questions for the listing agent
- It's been on market 61 days. Have you received any prior offers? Is the seller open to a 18% concession, seller financing, or rate buy-down credit?
- Built in 1940 — when were the roof, HVAC, electrical panel, plumbing, and water heater last replaced?
- Why hasn't it sold? Are there any deal-killer items the seller is aware of (foundation, flood, title, zoning, code violations)?
- Is there a deadline driving the sale (1031 exchange, divorce, estate, relocation)? That informs how much negotiation room exists.
- Schools are D-rated, which usually means shorter tenancies and higher turnover. Who's the typical renter profile here, and what's been the actual vacancy rate?
- Crime grade is F in this area — have there been break-ins, vandalism, or insurance claims at this property in the last 3 years? What carrier currently insures it and at what premium?
- The area grade is low — what's the realistic commute time and amenity access for the typical tenant pool here? Any planned neighborhood developments (good or bad) we should know about?
- What's the average days-on-market for RENTAL listings here right now (not sales)? A rising rental-DOM trend means longer vacancies and softer asking-rent achievability than the comps imply.
- What's the recent tenant-quality profile in this submarket — average credit score on applications, eviction rate, late-payment / NSF rate, and stable-employment percentage? A property-management company in the area should have these aggregated.
- How much new for-sale + rental construction is in the pipeline within 1–3 miles? Heavy new supply typically softens prices + rents 12–24 months out; constrained supply supports both.
Investment metrics
- 1% rule
- 0.82% ✗
- Cap rate
- 6.46%
- Cash-on-cash
- 0.59%
- DSCR
- 1.03
- GRM
- 10.2
CMA / ARV
- ARV (on-the-fly)
- $232,880
- Comps found
- 12
Show comp detail 12 sales within ~0.75 mi
| Address | Dist | Beds/Ba | Sqft | Sold | Price | $/sf | Match |
|---|---|---|---|---|---|---|---|
| 233 Proctor St | 0.16mi | 3/1.0 | 1,120 (-1%) | 1mo | $185,000 | $165 | 89 |
| 333 James St | 0.04mi | 3/1.0 | 1,050 (-8%) | 3mo | $199,000 | $190 | 83 |
| 2639 Goble St | 0.52mi | 3/2.0 | 1,126 (-1%) | 1mo | $250,000 | $222 | 69 |
| 2318 Knight Dr | 0.49mi | 3/1.0 | 1,141 (+0%) | 9mo | $238,000 | $209 | 69 |
| 2324 Knight Dr | 0.50mi | 3/1.0 | 1,136 (0%) | 12mo | $150,000 | $132 | 67 |
| 3001 Crawford Ave | 0.53mi | 3/2.0 | 1,161 (+2%) | 8mo | $259,900 | $224 | 61 |
| 2804 Westview St | 0.49mi | 2/2.0 (-1) | 1,176 (+4%) | 2mo | $280,000 | $238 | 60 |
| 3030 Crawford Ave | 0.57mi | 3/1.0 | 1,071 (-6%) | 4mo | $145,000 | $135 | 60 |
| 1525 Vanderlip Dr | 0.56mi | 3/2.0 | 1,090 (-4%) | 9mo | $235,000 | $216 | 55 |
| 2506 Lyon St | 0.60mi | 3/1.5 | 1,196 (+5%) | 8mo | $245,000 | $205 | 55 |
| 2452 Myers St | 0.30mi | 2/1.0 (-1) | 976 (-14%) | 5mo | $152,000 | $156 | 54 |
| 2521 Propst St | 0.42mi | 3/2.0 | 1,288 (+13%) | 4mo | $259,900 | $202 | 51 |
Match score weights: distance 35% · size 25% · config 20% · recency 20%. Top-matched comps best support the ARV.
Projected returns pro-forma
-3.0% appreciation · 5.63% rent growth · sell at horizon
- IRR
- -12.7%
- Equity multiple
- 0.53×
- Total profit
- $-24,925
- Equity at exit
- $28,330
- IRR
- -0.3%
- Equity multiple
- 0.97×
- Total profit
- $-1,392
- Equity at exit
- $16,428
Cash invested: $53,200 (down + closing). Projections, not guarantees.
Landlord ↔ Tenant lean methodology
- Overall (STATE)
- 85 Strongly Landlord-Friendly
- State North Carolina
- 85 Strongly Landlord-Friendly · R+3
- County
- — inherits STATE
- City
- — inherits STATE
ZIP-level market 28052
- Rents YoY
- 5.6%
- Active inventory
- 352
- Price-to-rent
- 10.2×
Monthly cashflow live
- Estimated rent
- $1,559 high interval (Pro) →
- Mortgage (P&I)
- −$996
- Tax from tax record
- −$129 /mo · $1,553/yr
- Insurance
- −$79
- HOA
- −$0
- Vacancy / Maint / Mgmt
- −$327
- Net cashflow
- $26
Break-even live
Sensitivity live
| Price | -10% $134 | -5% $80 | +0% $26 | +5% $-27 | +10% $-81 |
|---|---|---|---|---|---|
| Rent | -10% $-97 | -5% $-35 | +0% $26 | +5% $88 | +10% $149 |
| Rate | -1.0pp $122 | -0.5pp $75 | base $26 | +0.5pp $-23 | +1.0pp $-73 |
UW: 25.0% down · 7.5% · 30yr · 1.5% tax · 5.0% vac · 8.0% maint · 8.0% mgmt
Financing live
Cash to close
- Down payment
- $47,500
- Closing costs
- $5,700
- Reserves months
- —
- Total cash needed
- —
Loan-product check · same deal, 3 products live
Conventional
25% down · 7.5% · 30yr
- Down + closing
- —
- Monthly P&I
- —
- Monthly cashflow
- —
- DSCR
- —
- Eligible?
- —
Personal DTI + credit; lowest rate.
DSCR
20% down · 8.5% · 30yr
- Down + closing
- —
- Monthly P&I
- —
- Monthly cashflow
- —
- DSCR
- —
- Eligible?
- —
No personal income docs; deal must DSCR.
Hard money
10% down · 12.0% · 12mo
- Down + closing
- —
- Monthly P&I
- —
- Monthly cashflow
- —
- DSCR
- —
- Eligible?
- —
Short-term bridge; refi at stabilization.
Rent comps 27 comps
| Address | Beds | Baths | Sqft | Rent | $/sqft | DOM | Units | Dist |
|---|---|---|---|---|---|---|---|---|
| 225 Tanner St Gastonia, NC | 3.0 | 2.0 | 1154 | $1,693 | $1.47 | 3d | 1 | 0.11mi |
| 2443 Myers St Gastonia, NC | 3.0 | 1.0 | 1100 | $1,187 | $1.08 | 14d | 1 | 0.33mi |
| 807 Memory Ln Gastonia, NC | 3.0 | 1.0 | 864 | $1,200 | $1.39 | 25d | 1 | 0.48mi |
| 721 Day Lily Cir Gastonia, NC | 1.0–3.0 | 1.0–2.0 | 941 | $1,069 | $1.14 | 25d | 1 | 0.73mi |
| 2144 Hartford Dr Gastonia, NC | 3.0 | 2.0 | 1200 | $1,800 | $1.50 | 0d | 1 | 0.89mi |
| 1613 Greenview Dr Gastonia, NC | 2.0 | 2.0 | 960 | $1,255 | $1.31 | 12d | 1 | 0.89mi |
| 1613 Greenview Dr Gastonia, NC | 2.0 | 2.0 | 960 | $1,255 | $1.31 | 5d | 1 | 0.89mi |
| 1204 Iva Ave Gastonia, NC | 2.0 | 1.0 | 816 | $1,275 | $1.56 | 25d | 1 | 0.95mi |
| 3342 York Hwy Gastonia, NC | 2.0 | 1.0 | 1000 | $1,349 | $1.35 | 23d | 1 | 1.01mi |
| 1926 Hartford Dr Gastonia, NC | 1.0–3.0 | 1.0 | 772 | $1,400 | $1.81 | 0d | 1 | 1.01mi |
| 1502 Cloverdale Ln Gastonia, NC | 3.0 | 1.5 | 1368 | $1,599 | $1.17 | 18d | 1 | 1.04mi |
| 732 Inwood Hill Dr Gastonia, NC | 3.0 | 2.5 | 1330 | $2,195 | $1.65 | 22d | 1 | 1.08mi |
| 2711 Springbrook Cir Unit 2711 Gastonia, NC | 3.0 | 1.0 | 1040 | $1,350 | $1.30 | 25d | 1 | 1.11mi |
| 2248 Hudson Landings Dr Gastonia, NC | 2.0–3.0 | 1.0 | 930 | $1,415 | $1.52 | 0d | 8 | 1.12mi |
| 2248 Hudson Landings Dr Gastonia, NC | 2.0–3.0 | 1.0 | 930 | $1,405 | $1.51 | 25d | 1 | 1.12mi |
| 1216 Jackson Rd Gastonia, NC | 3.0 | 2.0 | 1254 | $1,825 | $1.46 | 25d | 1 | 1.16mi |
| 3377 Hunting Wood Ct Gastonia, NC | 3.0 | 2.0 | 1211 | $1,780 | $1.47 | 16d | 1 | 1.20mi |
| 538 Queens Rd Gastonia, NC | 3.0 | 2.0 | 1038 | $1,600 | $1.54 | 25d | 1 | 1.21mi |
| 112 Dean St Gastonia, NC | 2.0 | 2.0 | 882 | $1,400 | $1.59 | 25d | 1 | 1.27mi |
| 112 Miller St Gastonia, NC | 3.0 | 1.0 | 950 | $1,395 | $1.47 | 25d | 1 | 1.27mi |
| 112 Miller St Gastonia, NC | 3.0 | 1.0 | 950 | $1,395 | $1.47 | 0d | 1 | 1.27mi |
| 105 Summit St Gastonia, NC | 2.0 | 1.0 | 894 | $995 | $1.11 | 19d | 1 | 1.31mi |
| 2761 Penny Park Dr Gastonia, NC | 3.0 | 2.0 | 1456 | $1,700 | $1.17 | 14d | 1 | 1.32mi |
| 3531 Clover Valley Dr Gastonia, NC | 3.0 | 2.0 | 1182 | $1,825 | $1.54 | 21d | 1 | 1.34mi |
| 319 Osceola St Apt B Gastonia, NC | 2.0 | 2.0 | 785 | $1,275 | $1.62 | 6d | 1 | 1.45mi |
| 319 Osceola St Gastonia, NC | 2.0 | 1.0 | 785 | $1,275 | $1.62 | 5d | 1 | 1.45mi |
| 319 Osceola St Unit D Gastonia, NC | 2.0 | 1.0 | 785 | $1,300 | $1.66 | 19d | 1 | 1.45mi |
Listing history 45 events
-
2026-06-21days on market $190,000 Active 61 DOM
-
2026-06-18days on market $190,000 Active 58 DOM
-
2026-06-17days on market $190,000 Active 57 DOM
-
2026-06-16days on market $190,000 Active 56 DOM
-
2026-06-15days on market $190,000 Active 55 DOM
-
2026-06-13days on market $190,000 Active 53 DOM
-
2026-06-09days on market $190,000 Active 49 DOM
-
2026-06-08days on market $190,000 Active 48 DOM
-
2026-06-07days on market $190,000 Active 47 DOM
-
2026-06-04days on market $190,000 Active 44 DOM
-
2026-06-03pricedays on market $190,000 Active 43 DOM
-
2026-06-02days on market $195,000 Active 42 DOM
-
2026-06-01days on market $195,000 Active 41 DOM
-
2026-05-31days on market $195,000 Active 40 DOM
-
2026-04-22price $195,000
-
2026-04-21$200,000 Active
-
2026-04-06price $199,999
-
2026-04-01price $202,999
-
2026-03-18price $205,999
-
2026-03-05price $207,999
-
2026-02-13price $208,000
-
2026-01-14price $209,000
-
2025-11-06price $190,000
-
2025-10-24$195,000 Active
-
2025-10-06price $195,000
-
2025-09-13price $199,900
-
2025-07-31price $203,000
-
2025-07-02status Active
-
2025-06-01price $205,000
-
2025-05-13status Active
-
2025-04-30historical Active Under Contract
-
2025-04-11price $208,000
-
2025-02-14$210,000 Active
-
2024-12-27price $200,000
-
2024-12-18price $205,000
-
2024-12-14price $210,000
-
2024-12-11status Active
-
2024-11-12status Pending
-
2024-10-01$200,000 Active
-
2024-07-28price $209,000
-
2024-07-17$215,000 Active
-
2024-07-05price $219,000
-
2024-06-29price $225,000
-
2024-06-17$230,000 Active
-
1996-10-23soldstatus $30,000
ⓘ Source: listings_history table (triggers on properties + properties_extension) + one-shot
backfill from property_details.listing_events for pre-trigger history.
Tax reassessment forecast NC · Resets to sale price
- Current annual tax
- $1,553 · $129/mo
- Projected year-2 tax
- $1,558 · $130/mo
- Expected delta
- +$5/yr ($0/mo · 0.3%)
ⓘ Screening estimate from a state-policy table — verify with the county assessor before closing.
Climate risk First Street
- Flood 1/10 Low FEMA zone X (unshaded) · 0% chance over 30 yrs
- Wildfire 3/10 Moderate
- Heat 6/10 Major 7 d/yr ≥104°F today · 16 d/yr by 30 yrs out
- Wind 5/10 Major 22% chance of damaging wind over 30 yrs
- Air quality 3/10 Moderate 3 unhealthy d/yr today · 3 by 30 yrs out
Nearby sold comps map
Loading sold comps map…
Walkable amenities ~0.75 mi
Loading nearby amenities…
Taxation est. · year 1
- Rental income
- $18,702
- − Mortgage interest
- −$10,643
- − Property taxes
- −$1,553
- − Insurance
- −$950
- − Repairs & maintenance
- −$1,496
- − Management
- −$1,496
- − Depreciation
- −$5,527
- Taxable loss
- −$2,963
- Est. tax savings @ 24.0%
- +$711
- After-tax cash flow
- $1,027/yr
For passive investors: Depreciation is non-cash, so a rental often shows a tax loss while cash-flowing — sheltering income. Rental losses are passive: they offset passive income freely, and up to $25,000/yr can offset ordinary (W-2) income if you actively participate and your MAGI is under $100k (phasing out to $0 by $150k); unused losses carry forward. On sale, claimed depreciation is recaptured at up to 25%, and gains may owe capital-gains tax (a 1031 exchange can defer both). Figures are a year-1 estimate at your 24.0% rate — not tax advice; consult a CPA.
Schools (NCES district)
- District
- Gaston County Schools
- NCES district ID
- 3701620
- Math proficiency
- 44% ▲ 4.00%
- Reading proficiency
- 42% ▲ 1.00%
- Median HH income
- $43,644
- Composite
- 36.39/100
- National rank
- #4680
- State rank
- #93 of 178 in NC
Livability — Gastonia
- Score
- 59/100
- State rank
- #528
- US rank
- #19444
Category grades
Schools grade is shown separately in the Schools card above.
Census & demographics
- Census place
- Gastonia, NC
- County
- Gaston County · 201,497 people
- City population
- 114,179
- Metro
- Charlotte-Concord-Gastonia, NC-SC
- Population (ZIP)
- 36,272
- Household income
- $49,643
- Rent vs Own
- Severe rent burden
- 1521.0
Population outlook (Gaston County) Hauer SSP2
- Today (2025)
- 230,027 people
- By 2030
- 237,300 · +3.2%
- By 2040
- 249,659 · +8.5%
- By 2050
- 257,806 · +12.1%
- By 2075
- 272,163 · +18.3%
- By 2100
- 268,652 · +16.8%
Race, ethnicity, and origin ACS 2023
- Neighborhood character
- Diverse neighborhood (Simpson 0.65)
- Race & ethnicity
- White 46% Black 33% Hispanic / Latino 16% Two or more races 9%
- Hispanic origin (detail)
- Mexican 6% Puerto Rican 2%
- Common ancestry
- Serbian 2% Slovak 1% Italian 1%
- Foreign-born
- 7% · Canada, Dominican Republic, Jamaica
- Languages at home
- 86% English-only · Spanish 13%
Political lean MEDSL · Gaston
- 2024 margin
- Strong R (+25.0) · D 37.0% · R 62.1%
- 2008→2024 swing
- 0.0pp no change · 2008: -25.0pp · 2024: -25.0pp
- All cycles
- 2024: R+25.0 2020: R+27.8 2016: R+32.1 2012: R+25.6 2008: R+25.0
Not yet ingested
- Civics
- —
Market trends
- HPI YoY
- ▼ -348.71%
- Current HPI
- 252.912
- Rent YoY
- ▲ 5.63%
- Metro
- Charlotte-Concord-Gastonia, NC-SC
- State GDP YoY
- ▲ 3.28%
- F500 in state
- 26
Industry mix (Fortune 500 HQ in NC)
| Industry | F500 HQs | Revenue |
|---|---|---|
| Financial Services | 2 | $213B |
|
||
| Retail | 2 | $95B |
|
||
| Industrial Conglomerate | 1 | $38B |
|
||
| Metals / Steel | 1 | $35B |
|
||
| Utilities | 1 | $30B |
|
||
| Industrial Machinery | 1 | $19B |
|
||
Price history
+550.0% since first listed31 events — show timeline
- 2026-04-22 Price Changed $195,000 CANOPYMLS as Distributed by MLS Grid
- 2026-04-21 Listed $200,000 CANOPYMLS as Distributed by MLS Grid
- 2026-04-06 Price Changed $199,999 CANOPYMLS as Distributed by MLS Grid
- 2026-04-01 Price Changed $202,999 CANOPYMLS as Distributed by MLS Grid
- 2026-03-18 Price Changed $205,999 CANOPYMLS as Distributed by MLS Grid
- 2026-03-05 Price Changed $207,999 CANOPYMLS as Distributed by MLS Grid
- 2026-02-13 Price Changed $208,000 CANOPYMLS as Distributed by MLS Grid
- 2026-01-14 Price Changed $209,000 CANOPYMLS as Distributed by MLS Grid
- 2025-11-06 Price Changed $190,000 CANOPYMLS as Distributed by MLS Grid
- 2025-10-24 Listed $195,000 CANOPYMLS as Distributed by MLS Grid
- 2025-10-06 Price Changed $195,000 CANOPYMLS as Distributed by MLS Grid
- 2025-09-13 Price Changed $199,900 CANOPYMLS as Distributed by MLS Grid
- 2025-07-31 Price Changed $203,000 CANOPYMLS as Distributed by MLS Grid
- 2025-07-02 Relisted — CANOPYMLS as Distributed by MLS Grid
- 2025-06-01 Price Changed $205,000 CANOPYMLS as Distributed by MLS Grid
- 2025-05-13 Relisted — CANOPYMLS as Distributed by MLS Grid
- 2025-04-30 Contingent — CANOPYMLS as Distributed by MLS Grid
- 2025-04-11 Price Changed $208,000 CANOPYMLS as Distributed by MLS Grid
- 2025-02-14 Listed $210,000 CANOPYMLS as Distributed by MLS Grid
- 2024-12-27 Price Changed $200,000 CANOPYMLS as Distributed by MLS Grid
- 2024-12-18 Price Changed $205,000 CANOPYMLS as Distributed by MLS Grid
- 2024-12-14 Price Changed $210,000 CANOPYMLS as Distributed by MLS Grid
- 2024-12-11 Relisted — CANOPYMLS as Distributed by MLS Grid
- 2024-11-12 Pending — CANOPYMLS as Distributed by MLS Grid
- 2024-10-01 Listed $200,000 CANOPYMLS as Distributed by MLS Grid
- 2024-07-28 Price Changed $209,000 CANOPYMLS as Distributed by MLS Grid
- 2024-07-17 Listed $215,000 CANOPYMLS as Distributed by MLS Grid
- 2024-07-05 Price Changed $219,000 CANOPYMLS as Distributed by MLS Grid
- 2024-06-29 Price Changed $225,000 CANOPYMLS as Distributed by MLS Grid
- 2024-06-17 Listed $230,000 CANOPYMLS as Distributed by MLS Grid
- 1996-10-23 Sold (Public Records) $30,000 Public Records
Property tax history
+9.5%/yrLatest (2025): $1,553 · +144.6% YoY. Source: county tax records.
Cash-flow waterfall
monthlySold comps — $/sqft
last 12 mo · ≤1 miLoading sold comps…