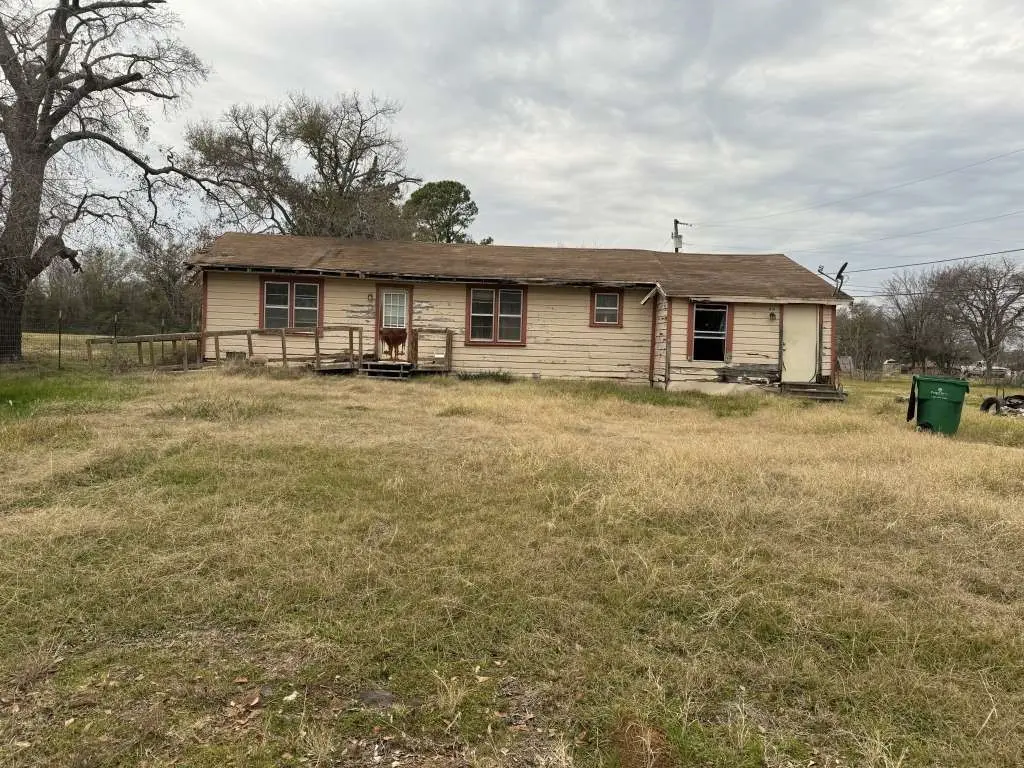
801 Clark St · Fairfield, TX
Flood risk 1/10 · Minimal
- FEMA flood zone
- X
- Chance of flooding over 30 yrs
- 0.0%
- Est. flood insurance / yr
- $507 – $1,088
Fire risk 4/10 · Minor
- Est. fire insurance / yr
- $1,222 – $2,270
Heat risk 7/10 · Major
- Hot days now (above 110°F)
- 7 days/yr
- Hot days in 30 yrs
- 26 days/yr
Wind risk 7/10 · Major
- Chance of severe wind over 30 yrs
- 78.0%
Air-quality risk 2/10 · Minimal
- Unhealthy air days now
- 1 days/yr
- Unhealthy air days in 30 yrs
- 1 days/yr
Risk factors via First Street. Map © Google.
Why this score? — see what drove the B+ grade
The composite is a weighted blend of 9 inputs, each scored 0–100. Each bar is that input's sub-score; the figure is the points it added to the 100-point composite (weight × sub-score).
- Cash flow +30.0/30.0
- ARV discount +15.0/15.0
- DSCR +10.0/10.0
- 1% rule +9.6/10.0
- Schools +3.2/10.0
- Livability +3.2/5.0
- Rent growth +2.5/5.0
- Condition / age +2.5/5.0
- Appreciation +0.0/10.0
$67,899
🖨 Deal sheet (PDF) 📄 Offer letter ✓ Due diligence
Listing remarks MLS
NEW LISTING! Welcome to 801 Clark St in Fairfield, TX. It is a charming blend of small-town atmosphere and convenient access to local amenities. This property features 2 bedrooms and 1 bathroom. Situated near shops, eateries, and parks, the property is perfect for families, with Fairfield's commitment to quality education and outdoor activities. Nearby Fairfield Lake State Park offers hiking, fishing, and wildlife, catering to nature enthusiasts. 801 Clark St represents an opportunity for a peaceful suburban life within a vibrant, close-knit community, making it an appealing choice for those seeking tranquility and community spirit. It is being sold AS IS but has a lot of potential. WE MAKE IT EASY TO OWN. This is a great opportunity! Don't wait, call us today to get more information on the owner's easy terms and smooth process that may be able to put the deed in your name and make this your dream home. Call Us Now Request Information
Key facts
- Convenient access
- Near parks
- Quality education
Tags
Neighborhood map
What this means for you Summary
Snapshot
- This is a 3-bed/1.0-bath single-family listed at $68k.
Deal economics
- At list price, monthly cash flow is $375 ($5k/yr) — positive.
- The deal already cash-flows at list — no discount required.
- Meets the 1% rule at list price ($988 rent vs $68k).
- Recommended offer: $60k (12.0% below list) — sets the bar for market timing.
- Cap rate 12.9% vs local median 2.5% in Fairfield — top-decile yield for the area; either an underpriced asset or a hidden risk that comps aren't pricing in. Stress-test before assuming the spread holds.
Location & tenants
- Location reads 64/100 on livability (#736 in TX) — a middle-class / working-renter tenant base. Strengths: cost of living A+, housing A+; Watch: employment C-, amenities F, commute F.
- Fairfield ISD (town): math 33% / reading 41% proficiency, ranked #475 of 826 in TX (top 58%) — families likely to look elsewhere, expect single-tenant / working-renter base with shorter leases.
- Zoned schools: Fairfield El (391 students, 71% FRL); Fairfield J H (math 28% / reading 36%, grade F, #971 of 1,662 statewide, top 60%, 409 students, 59% FRL); Fairfield H S (math 42% / reading 57%, grade D, #509 of 1,632 statewide, top 34%, 489 students, 52% FRL).
- Market conditions: 96 active listings in the ZIP; 2 units permitted in Freestone County in 2024 (0 in 5+ unit buildings).
Forward outlook
- Local home prices are declining (-3.0%/yr); year-one equity from $469 of loan paydown is wiped out by about $2k of value loss. Plan a longer hold.
- Freestone County population projected to shrink 4% by 2050 — rents likely to lag national; underwrite the cash flow, not the appreciation.
- At projected returns (-3.0% appreciation + 3.0% rent growth), your $19k cash investment doubles in ~6 years — after that, you're playing with house money.
Negotiation context
- It's been on market 371 days — a 12% lower offer ($60k) is reasonable based on typical stale-listing flexibility.
Risks & watch-outs
- Climate carrying-cost: major wind risk, 78% chance of damaging wind over 30y; extreme-heat days projected 7→26/yr by 2055 (HVAC capex compounding) — expect insurance premiums to compound above CPI over the hold.
Questions for the listing agent
- It's been on market 371 days. Have you received any prior offers? Is the seller open to a 12% concession, seller financing, or rate buy-down credit?
- Built in 1965 — when were the roof, HVAC, electrical panel, plumbing, and water heater last replaced?
- Why hasn't it sold? Are there any deal-killer items the seller is aware of (foundation, flood, title, zoning, code violations)?
- Is there a deadline driving the sale (1031 exchange, divorce, estate, relocation)? That informs how much negotiation room exists.
- Schools are D-rated, which usually means shorter tenancies and higher turnover. Who's the typical renter profile here, and what's been the actual vacancy rate?
- What's the average days-on-market for RENTAL listings here right now (not sales)? A rising rental-DOM trend means longer vacancies and softer asking-rent achievability than the comps imply.
- What's the recent tenant-quality profile in this submarket — average credit score on applications, eviction rate, late-payment / NSF rate, and stable-employment percentage? A property-management company in the area should have these aggregated.
- How much new for-sale + rental construction is in the pipeline within 1–3 miles? Heavy new supply typically softens prices + rents 12–24 months out; constrained supply supports both.
Investment metrics
- 1% rule
- 1.46% ✓
- Cap rate
- 12.93%
- Cash-on-cash
- 23.69%
- DSCR
- 2.05
- GRM
- 5.7
CMA / ARV
- ARV (median comp)
- $129,873
- List price
- $67,899
- Delta
- -47.72%
- Verdict
- UNDERPRICED
- Comps
- 12 within 1.0 mi
Show comp detail 3 sales within ~0.75 mi
| Address | Dist | Beds/Ba | Sqft | Sold | Price | $/sf | Match |
|---|---|---|---|---|---|---|---|
| 447 Mockingbird Ln | 0.60mi | 3/1.5 | 1,028 (+8%) | 9mo | $150,000 | $146 | 50 |
| 613 S Bateman Rd | 0.25mi | 2/1.0 (-1) | 1,040 (+9%) | 23mo | $59,900 | $58 | 50 |
| 303 S Hall St | 0.70mi | 2/1.5 (-1) | 1,023 (+7%) | 8mo | $83,000 | $81 | 42 |
Match score weights: distance 35% · size 25% · config 20% · recency 20%. Top-matched comps best support the ARV.
Projected returns pro-forma
-3.0% appreciation · 3.0% rent growth · sell at horizon
- IRR
- 16.8%
- Equity multiple
- 1.68×
- Total profit
- $12,880
- Equity at exit
- $10,124
- IRR
- 25.3%
- Equity multiple
- 3.20×
- Total profit
- $41,900
- Equity at exit
- $5,871
Cash invested: $19,012 (down + closing). Projections, not guarantees.
Landlord ↔ Tenant lean methodology
- Overall (STATE)
- 87 Strongly Landlord-Friendly
- State Texas
- 87 Strongly Landlord-Friendly · R+5
- County
- — inherits STATE
- City
- — inherits STATE
ZIP-level market 75840
- Home prices YoY
- -10.4%
- Active inventory
- 96
- Price-to-rent
- 5.7×
Monthly cashflow live
- Estimated rent
- $988 medium interval (Pro) →
- Mortgage (P&I)
- −$356
- Tax from tax record
- −$21 /mo · $253/yr
- Insurance
- −$28
- HOA
- −$0
- Lot rent
- −$0
- Vacancy / Maint / Mgmt
- −$208
- Net cashflow
- $375
Break-even live
Sensitivity live
| Price | -10% $414 | -5% $395 | +0% $375 | +5% $356 | +10% $337 |
|---|---|---|---|---|---|
| Rent | -10% $297 | -5% $336 | +0% $375 | +5% $414 | +10% $453 |
| Rate | -1.0pp $410 | -0.5pp $393 | base $375 | +0.5pp $358 | +1.0pp $340 |
UW: 25.0% down · 7.5% · 30yr · 1.5% tax · 5.0% vac · 8.0% maint · 8.0% mgmt
Financing live
Cash to close
- Down payment
- $16,975
- Closing costs
- $2,037
- Reserves months
- —
- Total cash needed
- —
Loan-product check · same deal, 3 products live
Conventional
25% down · 7.5% · 30yr
- Down + closing
- —
- Monthly P&I
- —
- Monthly cashflow
- —
- DSCR
- —
- Eligible?
- —
Personal DTI + credit; lowest rate.
DSCR
20% down · 8.5% · 30yr
- Down + closing
- —
- Monthly P&I
- —
- Monthly cashflow
- —
- DSCR
- —
- Eligible?
- —
No personal income docs; deal must DSCR.
Hard money
10% down · 12.0% · 12mo
- Down + closing
- —
- Monthly P&I
- —
- Monthly cashflow
- —
- DSCR
- —
- Eligible?
- —
Short-term bridge; refi at stabilization.
Listing history 19 events
-
2026-06-22days on market $67,899 Active 371 DOM
-
2026-06-21days on market $67,899 Active 370 DOM
-
2026-06-19days on market $67,899 Active 368 DOM
-
2026-06-18days on market $67,899 Active 367 DOM
-
2026-06-17days on market $67,899 Active 366 DOM
-
2026-06-16days on market $67,899 Active 365 DOM
-
2026-06-15days on market $67,899 Active 364 DOM
-
2026-06-14days on market $67,899 Active 362 DOM
-
2026-06-12days on market $67,899 Active 361 DOM
-
2026-06-09days on market $67,899 Active 358 DOM
-
2026-06-08days on market $67,899 Active 357 DOM
-
2026-06-07days on market $67,899 Active 356 DOM
-
2026-06-05days on market $67,899 Active 353 DOM
-
2026-06-03days on market $67,899 Active 352 DOM
-
2026-06-02days on market $67,899 Active 351 DOM
-
2026-06-01days on market $67,899 Active 350 DOM
-
2026-05-31days on market $67,899 Active 349 DOM
-
2026-05-30days on market $67,899 Active 348 DOM
-
2025-06-16$67,899 Active 953-char remark
Show marketing remark (953 chars)
NEW LISTING! Welcome to 801 Clark St in Fairfield, TX. It is a charming blend of small-town atmosphere and convenient access to local amenities. This property features 2 bedrooms and 1 bathroom. Situated near shops, eateries, and parks, the property is perfect for families, with Fairfield's commitment to quality education and outdoor activities. Nearby Fairfield Lake State Park offers hiking, fishing, and wildlife, catering to nature enthusiasts. 801 Clark St represents an opportunity for a peaceful suburban life within a vibrant, close-knit community, making it an appealing choice for those seeking tranquility and community spirit. It is being sold AS IS but has a lot of potential. WE MAKE IT EASY TO OWN. This is a great opportunity! Don't wait, call us today to get more information on the owner's easy terms and smooth process that may be able to put the deed in your name and make this your dream home. Call Us Now Request Information
ⓘ Source: listings_history table (triggers on properties + properties_extension) + one-shot
backfill from property_details.listing_events for pre-trigger history.
Tax reassessment forecast TX · Resets to sale price
- Current annual tax
- $253 · $21/mo
- Projected year-2 tax
- $1,243 · $104/mo
- Expected delta
- +$990/yr (+$82/mo · 391.2%)
ⓘ Screening estimate from a state-policy table — verify with the county assessor before closing.
Climate risk First Street
- Flood 1/10 Low FEMA zone X · 0% chance over 30 yrs
- Wildfire 4/10 Moderate
- Heat 7/10 Severe 7 d/yr ≥110°F today · 26 d/yr by 30 yrs out
- Wind 7/10 Severe 78% chance of damaging wind over 30 yrs
- Air quality 2/10 Low 1 unhealthy d/yr today · 1 by 30 yrs out
Nearby sold comps map
Loading sold comps map…
Walkable amenities ~0.75 mi
Loading nearby amenities…
Taxation est. · year 1
- Rental income
- $11,860
- − Mortgage interest
- −$3,803
- − Property taxes
- −$253
- − Insurance
- −$339
- − Repairs & maintenance
- −$949
- − Management
- −$949
- − Depreciation
- −$1,975
- Taxable income
- $3,591
- Est. tax owed @ 24.0%
- −$862
- After-tax cash flow
- $3,642/yr
For passive investors: Depreciation is non-cash, so a rental often shows a tax loss while cash-flowing — sheltering income. Rental losses are passive: they offset passive income freely, and up to $25,000/yr can offset ordinary (W-2) income if you actively participate and your MAGI is under $100k (phasing out to $0 by $150k); unused losses carry forward. On sale, claimed depreciation is recaptured at up to 25%, and gains may owe capital-gains tax (a 1031 exchange can defer both). Figures are a year-1 estimate at your 24.0% rate — not tax advice; consult a CPA.
Schools (NCES district)
- District
- Fairfield ISD
- NCES district ID
- 4818940
- Math proficiency
- 33% ▼ -9.00%
- Reading proficiency
- 41% ▼ -9.00%
- Median HH income
- $46,909
- Composite
- 31.68/100
- National rank
- #5926
- State rank
- #475 of 826 in TX
Livability — Fairfield
- Score
- 64/100
- State rank
- #736
- US rank
- #13679
Category grades
Schools grade is shown separately in the Schools card above.
Census & demographics
- Census place
- Fairfield, TX
- Population (ZIP)
- 6,993
Population outlook (Freestone County) Hauer SSP2
- Today (2025)
- 19,591 people
- By 2030
- 19,470 · -0.6%
- By 2040
- 19,111 · -2.5%
- By 2050
- 18,700 · -4.5%
- By 2075
- 17,586 · -10.2%
- By 2100
- 14,933 · -23.8%
Race, ethnicity, and origin ACS 2023
- Neighborhood character
- Predominantly White (69%)
- Race & ethnicity
- White 69% Hispanic / Latino 15% Black 13% Two or more races 12%
- Hispanic origin (detail)
- Mexican 14%
- Common ancestry
- Slovak 3% Lithuanian 1% Serbian 1%
- Foreign-born
- 5% · Canada
- Languages at home
- 88% English-only · Spanish 12%
Political lean MEDSL · Freestone
- 2024 margin
- Solid R (+66.3) · D 16.6% · R 82.9%
- 2008→2024 swing
- -22.8pp toward R · 2008: -43.5pp · 2024: -66.3pp
- All cycles
- 2024: R+66.3 2020: R+61.5 2016: R+59.6 2012: R+50.2 2008: R+43.5
Not yet ingested
- Civics
- —
Market trends
- HPI YoY
- ▼ -21.43%
- Current HPI
- 185.1167
- Rent YoY
- —
- Metro
- —
- State GDP YoY
- ▲ 3.95%
- F500 in state
- 110
Industry mix (Fortune 500 HQ in TX)
| Industry | F500 HQs | Revenue |
|---|---|---|
| Energy | 16 | $1,198B |
|
||
| Technology | 5 | $198B |
|
||
| Engineering / Construction | 4 | $72B |
|
||
| Energy Services | 3 | $60B |
|
||
| Utilities | 3 | $41B |
|
||
| Healthcare | 2 | $330B |
|
||
Price history
1 event — show timeline
- 2025-06-16 Listed $67,899 HARMLS
Property tax history
-4.0%/yrLatest (2025): $253 · -44.2% YoY. Source: county tax records.
Cash-flow waterfall
monthlySold comps — $/sqft
last 12 mo · ≤1 miLoading sold comps…