8066 Tolles Dr · Suncoast Estates, FL
Flood risk 1/10 · Minimal
- FEMA flood zone
- X (unshaded)
- Chance of flooding over 30 yrs
- 0.0%
- Est. flood insurance / yr
- $507 – $1,088
Fire risk 2/10 · Minimal
- Est. fire insurance / yr
- $947 – $1,759
Heat risk 10/10 · Severe
- Hot days now (above 107°F)
- 7 days/yr
- Hot days in 30 yrs
- 29 days/yr
Wind risk 10/10 · Severe
- Chance of severe wind over 30 yrs
- 99.0%
Air-quality risk 2/10 · Minimal
- Unhealthy air days now
- 1 days/yr
- Unhealthy air days in 30 yrs
- 1 days/yr
Risk factors via First Street. Map © Google.
Why this score? — see what drove the B grade
The composite is a weighted blend of 9 inputs, each scored 0–100. Each bar is that input's sub-score; the figure is the points it added to the 100-point composite (weight × sub-score).
- Cash flow +30.0/30.0
- 1% rule +10.0/10.0
- DSCR +10.0/10.0
- ARV discount +7.5/15.0
- Schools +4.1/10.0
- Livability +3.4/5.0
- Rent growth +3.2/5.0
- Condition / age +2.5/5.0
- Appreciation +0.0/10.0
$74,700
🖨 Deal sheet (PDF) 📄 Offer letter ✓ Due diligence
Listing remarks MLS
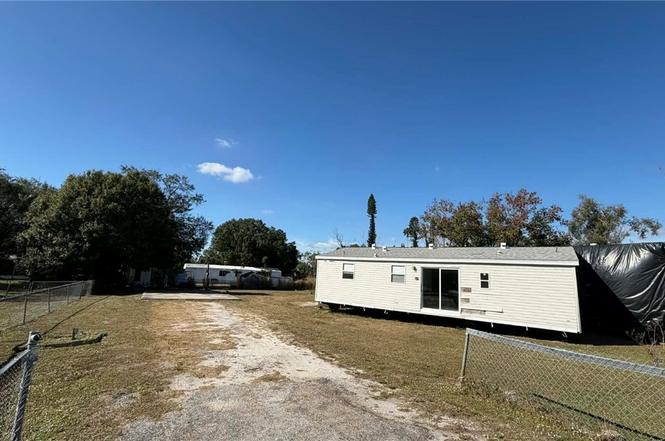
This property has so much potential!! It is already cleared, fenced, has a well, and a culvert. Save money on impact fees when you go to rebuild. OWN THE LAND - no hoa or park fees! Seller is selling AS-IS and has no knowledge about condition of anything on property. Please do not enter home as it is a tear down. Perfect opportunity for a buyer to save money on the build of their new home! Manufactured homes allowed
Key facts
- Fully gutted
- Land ownership
- Impact fees paid
Tags
Property features AI
Finance
- Other: Zoned MH-1; Lot dimensions approximately 100 x 140 (0.325 acre)
- HOA & community: No association fee
Exterior
- Utilities: Septic tank sewer; Well water; Cable not available
- Home design: Manufactured home; Single-story; Entry level 1; Faces east; Resale condition
- Construction: Vinyl siding; Shingle roof
- Exterior features: Rectangular lot; West exposure
Interior
- Bathrooms: 2 full bathrooms
- Interior features: Single hung windows; Unfurnished; Other interior features
Neighborhood map
What this means for you Summary
Snapshot
- This is a 2-bed/2.0-bath land listed at $75k.
Deal economics
- At list price, monthly cash flow is $479 ($6k/yr) — positive.
- The deal already cash-flows at list — no discount required.
- Meets the 1% rule at list price ($1k rent vs $75k).
- Recommended offer: $66k (12.0% below list) — sets the bar for market timing.
Location & tenants
- Location reads 68/100 on livability (#507 in FL) — a middle-class / working-renter tenant base. Strengths: cost of living A+, housing A+, crime B; Watch: commute D, schools F, amenities F.
- Lee (suburban): math 47% / reading 50% proficiency, ranked #42 of 73 in FL (top 58%) — families likely to look elsewhere, expect single-tenant / working-renter base with shorter leases.
- Market conditions: Rents rising (+2.6%/yr); 841 active listings in the ZIP; 18 comparable units currently listed for rent nearby; rentals at typical pace (median 25d on market — plan ~3-4 weeks tenant-placement turnaround); 15,411 units permitted in Lee County in 2024 (4,686 in 5+ unit buildings).
Forward outlook
- Local home prices are declining (-3.0%/yr); year-one equity from $516 of loan paydown is wiped out by about $2k of value loss. Plan a longer hold.
- Lee County population projected at +44% by 2050 — long-run rental-demand tailwind backs the buy-and-hold thesis.
- At projected returns (-3.0% appreciation + 2.6% rent growth), your $21k cash investment doubles in ~5 years — after that, you're playing with house money.
Negotiation context
- It's been on market 191 days — a 12% lower offer ($66k) is reasonable based on typical stale-listing flexibility.
- 2 sale attempts since 3y ago with the ask held roughly flat each time — persistent listings suggest the price (not the market) is what's stuck; bring a comps-based counter.
- Current owner paid $36k; list at $75k implies a 108% gain — meaningful room to come down on a strong offer.
Risks & watch-outs
- Climate carrying-cost: severe wind risk, 99% chance of damaging wind over 30y; extreme-heat days projected 7→29/yr by 2055 (HVAC capex compounding) — expect insurance premiums to compound above CPI over the hold.
Questions for the listing agent
- It's been on market 191 days. Have you received any prior offers? Is the seller open to a 12% concession, seller financing, or rate buy-down credit?
- Why hasn't it sold? Are there any deal-killer items the seller is aware of (foundation, flood, title, zoning, code violations)?
- Is there a deadline driving the sale (1031 exchange, divorce, estate, relocation)? That informs how much negotiation room exists.
- Schools are F-rated, which usually means shorter tenancies and higher turnover. Who's the typical renter profile here, and what's been the actual vacancy rate?
- What's the average days-on-market for RENTAL listings here right now (not sales)? A rising rental-DOM trend means longer vacancies and softer asking-rent achievability than the comps imply.
- What's the recent tenant-quality profile in this submarket — average credit score on applications, eviction rate, late-payment / NSF rate, and stable-employment percentage? A property-management company in the area should have these aggregated.
- How much new for-sale + rental construction is in the pipeline within 1–3 miles? Heavy new supply typically softens prices + rents 12–24 months out; constrained supply supports both.
Investment metrics
- 1% rule
- 1.60% ✓
- Cap rate
- 13.99%
- Cash-on-cash
- 27.49%
- DSCR
- 2.22
- GRM
- 5.2
CMA / ARV
No comps found within radius.
Projected returns pro-forma
-3.0% appreciation · 2.63% rent growth · sell at horizon
- IRR
- 21.1%
- Equity multiple
- 1.86×
- Total profit
- $17,950
- Equity at exit
- $11,138
- IRR
- 29.0%
- Equity multiple
- 3.54×
- Total profit
- $53,059
- Equity at exit
- $6,459
Cash invested: $20,916 (down + closing). Projections, not guarantees.
Landlord ↔ Tenant lean methodology
- Overall (STATE)
- 87 Strongly Landlord-Friendly
- State Florida
- 87 Strongly Landlord-Friendly · R+3
- County
- — inherits STATE
- City
- — inherits STATE
ZIP-level market 33917
- Home prices YoY
- -30.2%
- Rents YoY
- 2.6%
- Active inventory
- 841
- Price-to-rent
- 5.2×
Monthly cashflow live
- Estimated rent
- $1,194 high interval (Pro) →
- Mortgage (P&I)
- −$392
- Tax from tax record
- −$41 /mo · $495/yr
- Insurance
- −$31
- HOA
- −$0
- Vacancy / Maint / Mgmt
- −$251
- Net cashflow
- $479
Break-even live
Sensitivity live
| Price | -10% $521 | -5% $500 | +0% $479 | +5% $458 | +10% $437 |
|---|---|---|---|---|---|
| Rent | -10% $385 | -5% $432 | +0% $479 | +5% $526 | +10% $573 |
| Rate | -1.0pp $517 | -0.5pp $498 | base $479 | +0.5pp $460 | +1.0pp $440 |
UW: 25.0% down · 7.5% · 30yr · 1.5% tax · 5.0% vac · 8.0% maint · 8.0% mgmt
Financing live
Cash to close
- Down payment
- $18,675
- Closing costs
- $2,241
- Reserves months
- —
- Total cash needed
- —
Loan-product check · same deal, 3 products live
Conventional
25% down · 7.5% · 30yr
- Down + closing
- —
- Monthly P&I
- —
- Monthly cashflow
- —
- DSCR
- —
- Eligible?
- —
Personal DTI + credit; lowest rate.
DSCR
20% down · 8.5% · 30yr
- Down + closing
- —
- Monthly P&I
- —
- Monthly cashflow
- —
- DSCR
- —
- Eligible?
- —
No personal income docs; deal must DSCR.
Hard money
10% down · 12.0% · 12mo
- Down + closing
- —
- Monthly P&I
- —
- Monthly cashflow
- —
- DSCR
- —
- Eligible?
- —
Short-term bridge; refi at stabilization.
Rent comps 18 comps
| Address | Beds | Baths | Sqft | Rent | $/sqft | DOM | Units | Dist |
|---|---|---|---|---|---|---|---|---|
| 8146 Tolles Dr North Fort Myers, FL | 2.0 | 1.0 | 784 | $850 | $1.08 | 24d | 1 | 0.12mi |
| 8205 Suncoast Dr North Fort Myers, FL | 2.0 | 1.0 | 672 | $850 | $1.26 | 24d | 1 | 0.27mi |
| 8028 Breeze Dr North Fort Myers, FL | 2.0 | 1.0 | 750 | $850 | $1.13 | 24d | 1 | 0.30mi |
| 2211 Cantor Ln North Fort Myers, FL | 2.0 | 2.0 | 672 | $850 | $1.26 | 3d | 1 | 0.34mi |
| 8086 Heck Dr Unit 6 North Fort Myers, FL | 2.0 | 1.0 | 600 | $800 | $1.33 | 24d | 1 | 0.40mi |
| 7869 Suncoast Dr North Fort Myers, FL | 2.0 | 1.0 | 564 | $850 | $1.51 | 3d | 1 | 0.45mi |
| 2388 Case Ln North Fort Myers, FL | 3.0 | 2.0 | 1064 | $1,825 | $1.72 | 4d | 1 | 0.47mi |
| 7535 McDaniel Dr North Fort Myers, FL | 2.0 | 1.0 | 644 | $850 | $1.32 | 15d | 1 | 1.08mi |
| 7535 McDaniel Dr North Fort Myers, FL | 2.0 | 1.0 | 644 | $850 | $1.32 | 24d | 1 | 1.08mi |
| 2027 Eloise Cir North Fort Myers, FL | 2.0 | 1.0 | 822 | $1,300 | $1.58 | 4d | 1 | 1.09mi |
| 2095 Eloise Cir North Fort Myers, FL | 2.0 | 1.0 | 840 | $1,295 | $1.54 | 24d | 1 | 1.11mi |
| 16363 Teresa Ln North Fort Myers, FL | 2.0 | 1.0 | 1000 | $1,000 | $1.00 | 24d | 1 | 1.17mi |
| 16900 Slater Rd North Fort Myers, FL | 2.0–4.0 | 2.0 | 1120 | $1,349 | $1.20 | 3d | 17 | 1.18mi |
| 249 Fireball Ln North Fort Myers, FL | 2.0 | 1.5 | 624 | $1,350 | $2.16 | 4d | 1 | 1.31mi |
| 4120 Pine Drop Ln North Fort Myers, FL | 3.0 | 2.0 | 957 | $1,895 | $1.98 | 24d | 1 | 1.35mi |
| 280 Flame Ln North Fort Myers, FL | 2.0 | 2.0 | 980 | $1,350 | $1.38 | 4d | 1 | 1.36mi |
| 121 Coachlight Ln North Fort Myers, FL | 1.0 | 1.0 | 552 | $795 | $1.44 | 24d | 1 | 1.43mi |
| 106 Gaslight Ave North Fort Myers, FL | 2.0 | 2.0 | 1056 | $1,400 | $1.33 | 4d | 1 | 1.43mi |
Listing history 17 events
-
2026-06-17status $74,700 Pending 191 DOM
-
2026-06-17price $74,700 Active 191 DOM
-
2026-06-17days on market $49,900 Active 191 DOM
-
2026-06-16pricedays on market $49,900 Active 190 DOM
-
2026-06-15days on market $74,700 Active 189 DOM
-
2026-06-13days on market $74,700 Active 187 DOM
-
2026-06-09days on market $74,700 Active 183 DOM
-
2026-06-07pricedays on market $74,700 Active 181 DOM
-
2026-06-02days on market $74,800 Active 176 DOM
-
2026-06-01days on market $74,800 Active 175 DOM
-
2026-06-01days on market $74,800 Active 174 DOM
-
2026-04-29price $74,800
-
2026-02-09price $74,900
-
2025-12-03$75,000 Active
-
2023-04-12soldstatus $36,000 Closed 419-char remark
Show marketing remark (419 chars)
This property has so much potential!! It is already cleared, fenced, has a well, and a culvert. Save money on impact fees when you go to rebuild. OWN THE LAND - no hoa or park fees! Seller is selling AS-IS and has no knowledge about condition of anything on property. Please do not enter home as it is a tear down. Perfect opportunity for a buyer to save money on the build of their new home! Manufactured homes allowed
-
2023-03-14status Pending 419-char remark
Show marketing remark (419 chars)
This property has so much potential!! It is already cleared, fenced, has a well, and a culvert. Save money on impact fees when you go to rebuild. OWN THE LAND - no hoa or park fees! Seller is selling AS-IS and has no knowledge about condition of anything on property. Please do not enter home as it is a tear down. Perfect opportunity for a buyer to save money on the build of their new home! Manufactured homes allowed
-
2023-03-10$29,900 Active 419-char remark
Show marketing remark (419 chars)
This property has so much potential!! It is already cleared, fenced, has a well, and a culvert. Save money on impact fees when you go to rebuild. OWN THE LAND - no hoa or park fees! Seller is selling AS-IS and has no knowledge about condition of anything on property. Please do not enter home as it is a tear down. Perfect opportunity for a buyer to save money on the build of their new home! Manufactured homes allowed
ⓘ Source: listings_history table (triggers on properties + properties_extension) + one-shot
backfill from property_details.listing_events for pre-trigger history.
Tax reassessment forecast FL · Resets to sale price
- Current annual tax
- $495 · $41/mo
- Projected year-2 tax
- $620 · $52/mo
- Expected delta
- +$125/yr (+$10/mo · 25.2%)
ⓘ Screening estimate from a state-policy table — verify with the county assessor before closing.
Climate risk First Street
- Flood 1/10 Low FEMA zone X (unshaded) · 0% chance over 30 yrs
- Wildfire 2/10 Low
- Heat 10/10 Extreme 7 d/yr ≥107°F today · 29 d/yr by 30 yrs out
- Wind 10/10 Extreme 99% chance of damaging wind over 30 yrs
- Air quality 2/10 Low 1 unhealthy d/yr today · 1 by 30 yrs out
Nearby sold comps map
Loading sold comps map…
Walkable amenities ~0.75 mi
Loading nearby amenities…
Taxation est. · year 1
- Rental income
- $14,327
- − Mortgage interest
- −$4,184
- − Property taxes
- −$495
- − Insurance
- −$374
- − Repairs & maintenance
- −$1,146
- − Management
- −$1,146
- − Depreciation
- −$2,173
- Taxable income
- $4,809
- Est. tax owed @ 24.0%
- −$1,154
- After-tax cash flow
- $4,595/yr
For passive investors: Depreciation is non-cash, so a rental often shows a tax loss while cash-flowing — sheltering income. Rental losses are passive: they offset passive income freely, and up to $25,000/yr can offset ordinary (W-2) income if you actively participate and your MAGI is under $100k (phasing out to $0 by $150k); unused losses carry forward. On sale, claimed depreciation is recaptured at up to 25%, and gains may owe capital-gains tax (a 1031 exchange can defer both). Figures are a year-1 estimate at your 24.0% rate — not tax advice; consult a CPA.
Schools (NCES district)
- District
- Lee
- NCES district ID
- 1201080
- Math proficiency
- 47% ▼ -11.00%
- Reading proficiency
- 50% ▼ -4.00%
- Median HH income
- $49,518
- Composite
- 41.49/100
- National rank
- #3458
- State rank
- #42 of 73 in FL
Livability — Suncoast Estates
- Score
- 68/100
- State rank
- #507
- US rank
- #9351
Category grades
Schools grade is shown separately in the Schools card above.
Census & demographics
- Census place
- Suncoast Estates, FL
- County
- Lee County · 788,662 people
- City population
- 57,035
- Metro
- Cape Coral-Fort Myers, FL
- Population (ZIP)
- 33,380
- Household income
- $55,000
- Rent vs Own
- Severe rent burden
- 775.0
Population outlook (Lee County) Hauer SSP2
- Today (2025)
- 871,946 people
- By 2030
- 955,468 · +9.6%
- By 2040
- 1,113,587 · +27.7%
- By 2050
- 1,256,891 · +44.1%
- By 2075
- 1,560,270 · +78.9%
- By 2100
- 1,726,848 · +98.0%
Race, ethnicity, and origin ACS 2023
- Neighborhood character
- Predominantly White (85%)
- Race & ethnicity
- White 85% Hispanic / Latino 10% Two or more races 7% Asian 1% Black 1%
- Hispanic origin (detail)
- Mexican 2% Puerto Rican 1% Cuban 3%
- Common ancestry
- Lithuanian 3% Romanian 3% Slovak 2%
- Foreign-born
- 10% · Canada
- Languages at home
- 88% English-only · Spanish 9% Other Indo-European 1% Russian/Polish/Slavic 1%
Political lean MEDSL · Lee
- 2024 margin
- Strong R (+28.4) · D 35.5% · R 63.9%
- 2008→2024 swing
- -18.0pp toward R · 2008: -10.4pp · 2024: -28.4pp
- All cycles
- 2024: R+28.4 2020: R+19.2 2016: R+20.4 2012: R+16.6 2008: R+10.4
Not yet ingested
- Civics
- —
Market trends
- HPI YoY
- ▼ -122.28%
- Current HPI
- 282.2895
- Rent YoY
- ▲ 2.63%
- Metro
- Cape Coral-Fort Myers, FL
- State GDP YoY
- ▲ 3.28%
- F500 in state
- 36
Industry mix (Fortune 500 HQ in FL)
| Industry | F500 HQs | Revenue |
|---|---|---|
| Industrial Technology | 2 | $29B |
|
||
| Insurance | 2 | $17B |
|
||
| Retail | 1 | $60B |
|
||
| Technology Distribution | 1 | $58B |
|
||
| Homebuilding | 1 | $35B |
|
||
| Technology Manufacturing | 1 | $35B |
|
||
Price history
+150.2% since first listed6 events — show timeline
- 2026-04-29 Price Changed $74,800 FORTMLS
- 2026-02-09 Price Changed $74,900 FORTMLS
- 2025-12-03 Listed $75,000 FORTMLS
- 2023-04-12 Sold (MLS) $36,000 FORTMLS
- 2023-03-14 Pending — FORTMLS
- 2023-03-10 Listed $29,900 FORTMLS
Property tax history
+2.1%/yrLatest (2025): $495 · +14.8% YoY. Source: county tax records.
Cash-flow waterfall
monthlySold comps — $/sqft
last 12 mo · ≤1 miLoading sold comps…