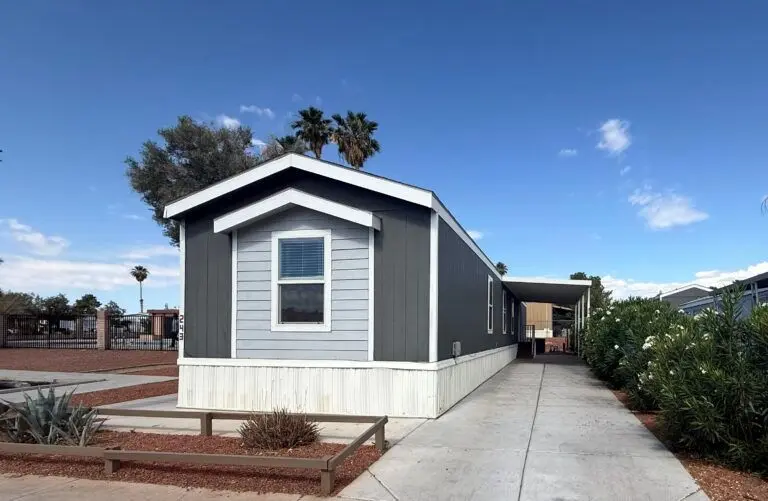
3751 S Nellis Blvd #243 · Paradise, NV
Flood risk No data
- FEMA flood zone
- —
- Chance of flooding over 30 yrs
- —
- Est. flood insurance / yr
- —
Fire risk No data
- Est. fire insurance / yr
- —
Heat risk 8/10 · Major
- Hot days now (above threshold)
- 7 days/yr
- Hot days in 30 yrs
- 17 days/yr
Wind risk No data
- Chance of severe wind over 30 yrs
- —
Air-quality risk 3/10 · Minor
- Unhealthy air days now
- 3 days/yr
- Unhealthy air days in 30 yrs
- 4 days/yr
Risk factors via First Street. Map © Google.
Why this score? — see what drove the B- grade
The composite is a weighted blend of 9 inputs, each scored 0–100. Each bar is that input's sub-score; the figure is the points it added to the 100-point composite (weight × sub-score).
- Cash flow +30.0/30.0
- 1% rule +10.0/10.0
- DSCR +10.0/10.0
- ARV discount +7.5/15.0
- Livability +3.8/5.0
- Schools +2.6/10.0
- Rent growth +2.5/5.0
- Condition / age +2.2/5.0
- Appreciation +0.0/10.0
$72,900
🖨 Deal sheet (PDF) 📄 Offer letter ✓ Due diligence
Listing remarks
Amazing Value!! Don't Miss Out!!
Key facts
- Built 2026
- Listed 14 days
Property features AI
Finance
- Financial info: List price $72,900
Exterior
- Home design: Spec inventory, Prescott plan
- Exterior features: Address: 3751 S Nellis Blvd #243, Las Vegas, NV 89121
Interior
- Bedrooms: 3 bedrooms
- Bathrooms: 2 full bathrooms
- Interior features: Living area approximately 1,216
Neighborhood map
What this means for you Summary
Snapshot
- This is a 3-bed/2.0-bath manufactured listed at $73k. Condition is rated fair.
Deal economics
- At list price, monthly cash flow is $681 ($8k/yr) — positive.
- The deal already cash-flows at list — no discount required.
- Meets the 1% rule at list price ($2k rent vs $73k).
Location & tenants
- Location reads 76/100 on livability (#10 in NV, #3,494 nationally) — a middle-class / working-renter tenant base. Strengths: commute A+, housing A-, cost of living B; Watch: employment D+, crime D-.
- Clark County School District (urban): math 21% / reading 39% proficiency, ranked #11 of 17 in NV (top 65%) — families likely to look elsewhere, expect single-tenant / working-renter base with shorter leases.
- Zoned schools: Smith Hal Es (math 6% / reading 12%, grade F, #396 of 402 statewide, top 99%, 708 students, 100% FRL); Harney Kathleen & Tim Ms (math 12% / reading 25%, grade F, #81 of 109 statewide, top 74%, 1,279 students, 100% FRL); Chaparral Hs (math 3% / reading 15%, grade F, #128 of 131 statewide, top 98%, 2,256 students, 100% FRL) — zoned schools average 100% FRL vs 52% district-wide (48 pts higher); higher-poverty schools than district average — tighter screening recommended.
- Zoned-school proficiency averages 12% at this address vs 30% district-wide (-18 pts) — the specific schools serving this property underperform the Clark County School District average; the district grade overstates school quality for this exact location.
- Market conditions: Rents soft (-0.1%/yr); 413 active listings in the ZIP; 40 comparable units currently listed for rent nearby; rentals at typical pace (median 17d on market — plan ~3-4 weeks tenant-placement turnaround); 14,754 units permitted in Clark County in 2024 (2,301 in 5+ unit buildings).
- This rent runs 32% of the median local income ($56k/yr) — at the standard rent-burdened threshold; future hikes will face affordability resistance.
Forward outlook
- Local home prices are declining (-3.0%/yr); year-one equity from $504 of loan paydown is wiped out by about $2k of value loss. Plan a longer hold.
- Clark County population projected at +36% by 2050 — long-run rental-demand tailwind backs the buy-and-hold thesis.
- At projected returns (-3.0% appreciation + 0.0% rent growth), your $20k cash investment doubles in ~4 years — after that, you're playing with house money.
Negotiation context
- Only 14 days on market — expect competitive offers; lowballing is unlikely to land.
Risks & watch-outs
- Climate carrying-cost: extreme-heat days projected 7→17/yr by 2055 (HVAC capex compounding) — expect insurance premiums to compound above CPI over the hold.
Questions for the listing agent
- Have any recent inspections been done? Can we get a copy of the seller's disclosures and any deferred-maintenance estimates?
- Is there a deadline driving the sale (1031 exchange, divorce, estate, relocation)? That informs how much negotiation room exists.
- Schools are F-rated, which usually means shorter tenancies and higher turnover. Who's the typical renter profile here, and what's been the actual vacancy rate?
- Crime grade is D in this area — have there been break-ins, vandalism, or insurance claims at this property in the last 3 years? What carrier currently insures it and at what premium?
- What's the average days-on-market for RENTAL listings here right now (not sales)? A rising rental-DOM trend means longer vacancies and softer asking-rent achievability than the comps imply.
- What's the recent tenant-quality profile in this submarket — average credit score on applications, eviction rate, late-payment / NSF rate, and stable-employment percentage? A property-management company in the area should have these aggregated.
- How much new for-sale + rental construction is in the pipeline within 1–3 miles? Heavy new supply typically softens prices + rents 12–24 months out; constrained supply supports both.
Investment metrics
- 1% rule
- 2.06% ✓
- Cap rate
- 17.51%
- Cash-on-cash
- 40.05%
- DSCR
- 2.78
- GRM
- 4.0
CMA / ARV
No comps found within radius.
Projected returns pro-forma
-3.0% appreciation · 0.0% rent growth · sell at horizon
- IRR
- 33.0%
- Equity multiple
- 2.33×
- Total profit
- $27,204
- Equity at exit
- $10,870
- IRR
- 38.3%
- Equity multiple
- 4.07×
- Total profit
- $62,664
- Equity at exit
- $6,303
Cash invested: $20,412 (down + closing). Projections, not guarantees.
Landlord ↔ Tenant lean methodology
- Overall (STATE)
- 71 Landlord-Friendly
- State Nevada
- 71 Landlord-Friendly · R+1
- County
- — inherits STATE
- City
- — inherits STATE
ZIP-level market 89121
- Rents YoY
- -0.1%
- Active inventory
- 413
- Price-to-rent
- 4.0×
Monthly cashflow live
- Estimated rent
- $1,500 high interval (Pro) →
- Mortgage (P&I)
- −$382
- Tax est. 1.5%
- −$91 /mo · $1,094/yr
- Insurance
- −$30
- HOA
- −$0
- Vacancy / Maint / Mgmt
- −$315
- Net cashflow
- $681
Break-even live
Sensitivity live
| Price | -10% $732 | -5% $706 | +0% $681 | +5% $656 | +10% $631 |
|---|---|---|---|---|---|
| Rent | -10% $563 | -5% $622 | +0% $681 | +5% $741 | +10% $800 |
| Rate | -1.0pp $718 | -0.5pp $700 | base $681 | +0.5pp $662 | +1.0pp $643 |
UW: 25.0% down · 7.5% · 30yr · 1.5% tax · 5.0% vac · 8.0% maint · 8.0% mgmt
Financing live
Cash to close
- Down payment
- $18,225
- Closing costs
- $2,187
- Reserves months
- —
- Total cash needed
- —
Loan-product check · same deal, 3 products live
Conventional
25% down · 7.5% · 30yr
- Down + closing
- —
- Monthly P&I
- —
- Monthly cashflow
- —
- DSCR
- —
- Eligible?
- —
Personal DTI + credit; lowest rate.
DSCR
20% down · 8.5% · 30yr
- Down + closing
- —
- Monthly P&I
- —
- Monthly cashflow
- —
- DSCR
- —
- Eligible?
- —
No personal income docs; deal must DSCR.
Hard money
10% down · 12.0% · 12mo
- Down + closing
- —
- Monthly P&I
- —
- Monthly cashflow
- —
- DSCR
- —
- Eligible?
- —
Short-term bridge; refi at stabilization.
Rent comps 40 comps
| Address | Beds | Baths | Sqft | Rent | $/sqft | DOM | Units | Dist |
|---|---|---|---|---|---|---|---|---|
| 3800 S Nellis Blvd Las Vegas, NV | 1.0–3.0 | 1.0–2.0 | 943 | $1,635 | $1.73 | 0d | 24 | 0.21mi |
| 5051 Sitka Ln Las Vegas, NV | 3.0 | 2.0 | 1265 | $1,225 | $0.97 | 45d | 1 | 0.26mi |
| 5101 E Twain Ave Las Vegas, NV | 1.0–2.0 | 1.0–2.0 | 780 | $1,150 | $1.47 | 45d | 4 | 0.32mi |
| 3850 Mountain Vista St Las Vegas, NV | 1.0–3.0 | 1.0–2.0 | 802 | $1,406 | $1.75 | 16d | 9 | 0.37mi |
| 3481 Cape Cod Dr Las Vegas, NV | 2.0 | 2.0 | 840 | $1,300 | $1.55 | 4d | 1 | 0.42mi |
| 4455 E Twain Ave Las Vegas, NV | 1.0–3.0 | 1.0–2.0 | 871 | $1,352 | $1.55 | 0d | 9 | 0.46mi |
| 3956 Clear View Dr Las Vegas, NV | 3.0 | 2.0 | 1306 | $2,600 | $1.99 | 19d | 1 | 0.59mi |
| 4014 Great Plains Way Las Vegas, NV | 2.0 | 1.5 | 1152 | $1,548 | $1.34 | 6d | 1 | 0.75mi |
| 4264 White Sands Ave Las Vegas, NV | 4.0 | 2.0 | 1392 | $1,650 | $1.19 | 13d | 1 | 0.82mi |
| 4952 E Harmon Ave Las Vegas, NV | 2.0 | 1.0 | 800 | $1,900 | $2.38 | 25d | 1 | 0.92mi |
| 3055 S Nellis Blvd Las Vegas, NV | 1.0–2.0 | 1.0–2.0 | 983 | $1,432 | $1.46 | 0d | 41 | 0.93mi |
| 3400 Cabana Dr Las Vegas, NV | 2.0–3.0 | 2.0 | 1124 | $1,350 | $1.20 | 23d | 2 | 0.93mi |
| 3400 Cabana Dr #2019 Las Vegas, NV | 2.0 | 2.0 | 1053 | $1,350 | $1.28 | 16d | 1 | 0.93mi |
| 3400 Cabana Dr #2049 Las Vegas, NV | 2.0 | 2.0 | 1053 | $1,350 | $1.28 | 0d | 1 | 0.93mi |
| 3037 Aloha Ave Las Vegas, NV | 3.0 | 2.0 | 1270 | $1,750 | $1.38 | 0d | 1 | 0.93mi |
| 3021 Aloha Ave Las Vegas, NV | 3.0 | 2.0 | 1270 | $1,800 | $1.42 | 5d | 1 | 0.95mi |
| 4549 Oakdale Ave Las Vegas, NV | 4.0 | 2.0 | 1496 | $1,800 | $1.20 | 0d | 1 | 1.01mi |
| 4379 Hilldale Ave Las Vegas, NV | 2.0 | 1.0 | 954 | $1,485 | $1.56 | 9d | 1 | 1.01mi |
| 4855 E Vegas Valley Dr Las Vegas, NV | 1.0–3.0 | 1.0–2.0 | 949 | $1,579 | $1.66 | 0d | 13 | 1.09mi |
| 3012 S Mountain Vista St Unit MV Condo Las Vegas, NV | 2.0 | 1.0 | 828 | $945 | $1.14 | 45d | 1 | 1.09mi |
| 5421 E Harmon Ave Las Vegas, NV | 1.0–2.0 | 1.0–2.0 | 523 | $1,195 | $2.28 | 0d | 16 | 1.13mi |
| 2977 Juniper Hills Blvd #104 Las Vegas, NV | 2.0 | 2.0 | 896 | $1,050 | $1.17 | 9d | 1 | 1.17mi |
| 2975 Juniper Hills Blvd #204 Las Vegas, NV | 2.0 | 2.0 | 884 | $1,000 | $1.13 | 45d | 1 | 1.17mi |
| 2979 Juniper Hills Blvd #203 Las Vegas, NV | 2.0 | 2.0 | 889 | $1,195 | $1.34 | 22d | 1 | 1.18mi |
| 4640 Vegas Valley Dr Las Vegas, NV | 1.0–2.0 | 1.0–2.0 | 853 | $1,340 | $1.57 | 45d | 1 | 1.19mi |
| 2985 Juniper Hills Blvd #102 Las Vegas, NV | 2.0 | 2.0 | 891 | $1,225 | $1.37 | 16d | 1 | 1.19mi |
| 2985 Juniper Hills Blvd #203 Las Vegas, NV | 2.0 | 2.0 | 884 | $1,000 | $1.13 | 9d | 1 | 1.19mi |
| 2967 Juniper Hills Blvd Las Vegas, NV | 2.0 | 2.0 | 884 | $1,190 | $1.35 | 19d | 1 | 1.20mi |
| 2967 Juniper Hills Blvd #104 Las Vegas, NV | 2.0 | 4.0 | 891 | $1,350 | $1.52 | 45d | 1 | 1.21mi |
| 2967 Juniper Hills Blvd #203 Las Vegas, NV | 2.0 | 2.0 | 884 | $1,190 | $1.35 | 45d | 1 | 1.21mi |
| 2883 Wheelwright Dr Unit 1 Las Vegas, NV | 2.0 | 2.0 | 918 | $1,195 | $1.30 | 9d | 1 | 1.21mi |
| 2963 Juniper Hills Blvd #204 Las Vegas, NV | 2.0 | 2.0 | 884 | $1,250 | $1.41 | 45d | 1 | 1.22mi |
| 2963 Juniper Hills Blvd #204 Las Vegas, NV | 2.0 | 2.0 | 884 | $1,250 | $1.41 | 18d | 1 | 1.22mi |
| 2982 Juniper Hills Blvd #202 Las Vegas, NV | 3.0 | 2.0 | 1074 | $1,700 | $1.58 | 45d | 1 | 1.24mi |
| 2980 Juniper Hills Blvd Las Vegas, NV | 2.0 | 2.0 | 896 | $1,090 | $1.22 | 5d | 1 | 1.24mi |
| 2980 Juniper Hills Blvd #103 Las Vegas, NV | 2.0 | 2.0 | 896 | $1,090 | $1.22 | 14d | 1 | 1.24mi |
| 2978 Juniper Hills Blvd #204 Las Vegas, NV | 2.0 | 2.0 | 884 | $1,245 | $1.41 | 22d | 1 | 1.25mi |
| 2967 Ferndale St Las Vegas, NV | 3.0 | 2.0 | 1134 | $1,835 | $1.62 | 25d | 1 | 1.25mi |
| 2962 Juniper Hills Blvd #104 Las Vegas, NV | 3.0 | 2.0 | 1074 | $1,550 | $1.44 | 45d | 1 | 1.25mi |
| 4570 Carriage Park Dr Unit B Las Vegas, NV | 2.0 | 2.0 | 918 | $1,395 | $1.52 | 19d | 1 | 1.25mi |
Listing history 9 events
-
2026-06-21days on market $72,900 Active 14 DOM
-
2026-06-18days on market $72,900 Active 11 DOM
-
2026-06-17days on market $72,900 Active 10 DOM
-
2026-06-15days on market $72,900 Active 8 DOM
-
2026-06-13days on market $72,900 Active 6 DOM
-
2026-06-09days on market $72,900 Active 4 DOM
-
2026-06-08days on market $72,900 Active 3 DOM
-
2026-06-08remarks 32-char remark
-
2026-06-08$72,900 Active 2 DOM
ⓘ Source: listings_history table (triggers on properties + properties_extension) + one-shot
backfill from property_details.listing_events for pre-trigger history.
Climate risk First Street
- Heat 8/10 Severe
- Air quality 3/10 Moderate 3 unhealthy d/yr today · 4 by 30 yrs out
Nearby sold comps map
Loading sold comps map…
Walkable amenities ~0.75 mi
Loading nearby amenities…
Taxation est. · year 1
- Rental income
- $18,001
- − Mortgage interest
- −$4,084
- − Property taxes
- −$1,094
- − Insurance
- −$364
- − Repairs & maintenance
- −$1,440
- − Management
- −$1,440
- − Depreciation
- −$2,121
- Taxable income
- $7,459
- Est. tax owed @ 24.0%
- −$1,790
- After-tax cash flow
- $6,385/yr
For passive investors: Depreciation is non-cash, so a rental often shows a tax loss while cash-flowing — sheltering income. Rental losses are passive: they offset passive income freely, and up to $25,000/yr can offset ordinary (W-2) income if you actively participate and your MAGI is under $100k (phasing out to $0 by $150k); unused losses carry forward. On sale, claimed depreciation is recaptured at up to 25%, and gains may owe capital-gains tax (a 1031 exchange can defer both). Figures are a year-1 estimate at your 24.0% rate — not tax advice; consult a CPA.
Condition & rehab AI · 4 photos
The home presents a fair condition with cosmetic updates needed to enhance its appearance and value. The exterior appears good, but the interior and landscaping could benefit from some improvements.
Repairs flagged
- Minor tile flooring — The tile flooring may need a fresh coat of sealant to maintain its appearance.
- Minor interior walls — The interior walls may need a fresh coat of paint to improve their appearance.
- Minor landscaping — The landscaping could benefit from some additional greenery or decorative elements to enhance the curb appeal.
Value-add opportunities
- Both paint interior walls — Refreshing the interior walls with fresh paint can improve the overall appearance and appeal of the home.
- Both install decorative landscaping — Adding more greenery and decorative elements to the landscaping can significantly enhance the curb appeal and overall aesthetic of the home.
- Both update kitchen appliances — Upgrading the kitchen appliances can improve the functionality and appeal of the kitchen, making it more attractive to potential buyers or renters.
Renovation cost estimate screening
| Repair item | Severity | Est. cost |
|---|---|---|
| tile flooring · The tile flooring may need a fresh coat of sealant to maintain its appearance. | Minor | $500–3,000 |
| interior walls · The interior walls may need a fresh coat of paint to improve their appearance. | Minor | $500–3,000 |
| landscaping · The landscaping could benefit from some additional greenery or decorative elements to enhance the curb appeal. | Minor | $500–3,000 |
| Total estimated repair cost · 3 items | $1,500–9,000 |
Value-add ROI direction
- Both paint interior walls — Refreshing the interior walls with fresh paint can improve the overall appearance and appeal of the home. ↑
- Both install decorative landscaping — Adding more greenery and decorative elements to the landscaping can significantly enhance the curb appeal and overall aesthetic of the home. ↑
- Both update kitchen appliances — Upgrading the kitchen appliances can improve the functionality and appeal of the kitchen, making it more attractive to potential buyers or renters. ↑
ⓘ Cost ranges are severity-bucket heuristics (US national rule-of-thumb). Get contractor quotes + a written scope before underwriting a rehab budget.
Schools (NCES district)
- District
- Clark County School District
- NCES district ID
- 3200060
- Math proficiency
- 21% ▼ -13.00%
- Reading proficiency
- 39% ▼ -8.00%
- Median HH income
- $53,611
- Composite
- 26.48/100
- National rank
- #7211
- State rank
- #11 of 17 in NV
Livability — Paradise
- Score
- 76/100
- State rank
- #10
- US rank
- #3494
Category grades
Schools grade is shown separately in the Schools card above.
Census & demographics
- Census place
- Paradise, NV
- County
- Clark County · 2,306,105 people
- City population
- 227,885
- Metro
- Las Vegas-Henderson-Paradise, NV
- Population (ZIP)
- 68,406
- Household income
- $55,758
- Rent vs Own
- Severe rent burden
- 4080.0
Population outlook (Clark County) Hauer SSP2
- Today (2025)
- 2,504,101 people
- By 2030
- 2,693,770 · +7.6%
- By 2040
- 3,061,208 · +22.2%
- By 2050
- 3,400,072 · +35.8%
- By 2075
- 4,139,522 · +65.3%
- By 2100
- 4,596,916 · +83.6%
Race, ethnicity, and origin ACS 2023
- Neighborhood character
- Diverse neighborhood (Simpson 0.65)
- Race & ethnicity
- Hispanic / Latino 49% White 31% Two or more races 16% Black 11% Asian 4% Native American 1%
- Hispanic origin (detail)
- Mexican 30% Puerto Rican 1% Cuban 5%
- Common ancestry
- Lithuanian 2% Romanian 1% Slovak 1%
- Foreign-born
- 27% · Canada, Dominican Republic, Jamaica
- Languages at home
- 57% English-only · Spanish 37% Tagalog/Filipino 2% Other Asian/Pacific 1%
Political lean MEDSL · Clark
- 2024 margin
- Toss-up / Even · D 50.4% · R 47.8% · Other 1.7%
- 2008→2024 swing
- -16.5pp toward R · 2008: 19.1pp · 2024: 2.6pp
- All cycles
- 2024: D+2.6 2020: D+9.3 2016: D+10.7 2012: D+14.5 2008: D+19.1
Not yet ingested
- Civics
- —
Market trends
- HPI YoY
- ▼ -241.85%
- Current HPI
- 302.201
- Rent YoY
- ▼ -0.10%
- Metro
- Las Vegas-Henderson-Paradise, NV
- State GDP YoY
- ▲ 3.08%
- F500 in state
- 6
Industry mix (Fortune 500 HQ in NV)
| Industry | F500 HQs | Revenue |
|---|---|---|
| Hotels / Casinos | 3 | $36B |
|
||
Cash-flow waterfall
monthlySold comps — $/sqft
last 12 mo · ≤1 miLoading sold comps…