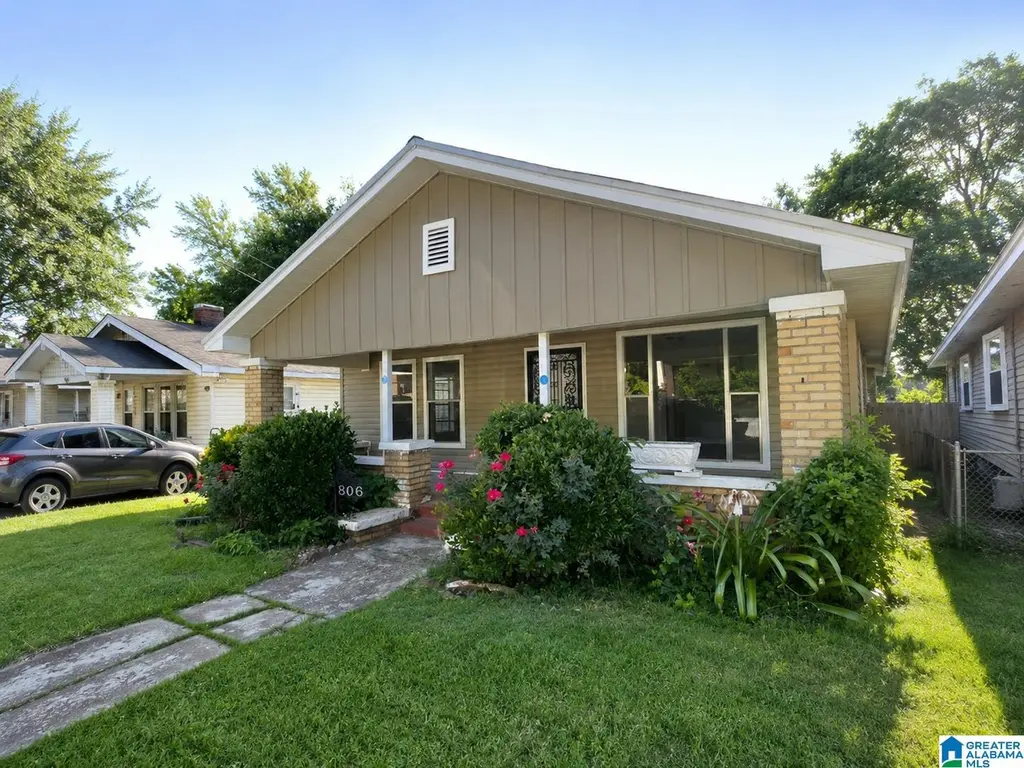
806 Gamma St S · Birmingham, AL
Flood risk 1/10 · Minimal
- FEMA flood zone
- X (unshaded)
- Chance of flooding over 30 yrs
- 0.0%
- Est. flood insurance / yr
- $507 – $1,088
Fire risk 1/10 · Minimal
- Est. fire insurance / yr
- $916 – $1,700
Heat risk 7/10 · Major
- Hot days now (above 106°F)
- 7 days/yr
- Hot days in 30 yrs
- 19 days/yr
Wind risk 6/10 · Moderate
- Chance of severe wind over 30 yrs
- 27.0%
Air-quality risk 4/10 · Minor
- Unhealthy air days now
- 6 days/yr
- Unhealthy air days in 30 yrs
- 8 days/yr
Risk factors via First Street. Map © Google.
Why this score? — see what drove the C+ grade
The composite is a weighted blend of 9 inputs, each scored 0–100. Each bar is that input's sub-score; the figure is the points it added to the 100-point composite (weight × sub-score).
- Cash flow +25.5/30.0
- ARV discount +12.2/15.0
- DSCR +8.5/10.0
- 1% rule +6.7/10.0
- Livability +3.4/5.0
- Rent growth +3.1/5.0
- Condition / age +2.5/5.0
- Schools +0.9/10.0
- Appreciation +0.0/10.0
$109,900
🖨 Deal sheet (PDF) 📄 Offer letter ✓ Due diligence
Listing remarks
This 3-bedroom home offers strong potential for rental income or value-add renovation. Featuring a functional floor plan, spacious bedrooms, and solid bones, this property is ideal for investors looking to buy and hold or first time home buyers. Over 52K in recent renovations completed. Call for copy of scope of work or see in documents. 1 Year Builder Warranty.
Key facts
- 3,920 sq ft lot
- Built 1920
- Listed 35 days
Property features AI
Finance
- Other: Subdivision: Titusville
Exterior
- Parking: Off-street parking
- Utilities: Public water; Connected sewer; Electric water heater; Internet service available
- Home design: Existing construction; Siding finished with Hardiplank
- Construction: Slab foundation
- Exterior features: No pool, patio, decks, or garden/patio; Not waterfront; Lot approximately 0.09 acres; Not in flood plain; No notable lot view
Interior
- Kitchen: Laminate countertops
- Bedrooms: Three bedrooms on main level
- Flooring: Hardwood and laminate floors
- Bathrooms: One full bathroom with tub/shower combo
- Heating & cooling: Central heating; Central cooling
- Interior features: Ceilings: other (see remarks); Has attic with pull-down access; Living area reported as 1,148
- Laundry & utility: Washer hookup; Electric dryer hookup; Laundry located on main level
Neighborhood map
What this means for you Summary
Snapshot
- This is a 3-bed/1.0-bath single-family listed at $110k.
Deal economics
- At list price, monthly cash flow is $257 ($3k/yr) — positive.
- The deal already cash-flows at list — no discount required.
- Meets the 1% rule at list price ($1k rent vs $110k).
- Recommended offer: $107k (3.0% below list) — sets the bar for market timing.
- Cap rate 9.1% vs local median 6.2% in Birmingham — top-decile yield for the area; either an underpriced asset or a hidden risk that comps aren't pricing in. Stress-test before assuming the spread holds.
Location & tenants
- Location reads 67/100 on livability (#78 in AL) — a middle-class / working-renter tenant base. Strengths: commute A+, cost of living A+, housing A+; Watch: amenities C-, crime F, employment F.
- Birmingham City (urban): math 4% / reading 20% proficiency, ranked #116 of 129 in AL (top 90%) — low school quality limits family demand, transient renter base, plan for 1-2y turnover; 82% free/reduced lunch — lower-income household profile, screen leases tightly.
- Zoned schools: Washington K8 (math 5% / reading 18%, grade F, #556 of 627 statewide, top 89%, 567 students, 92% FRL); Parker High School (math 2% / reading 2%, grade F, #291 of 305 statewide, top 100%, 826 students, 90% FRL).
- Market conditions: Rents rising (+2.6%/yr); 125 active listings in the ZIP; 40 comparable units currently listed for rent nearby; rentals at typical pace (median 19d on market — plan ~3-4 weeks tenant-placement turnaround); 2,114 units permitted in Jefferson County in 2024 (556 in 5+ unit buildings).
- This rent runs 30% of the median local income ($51k/yr) — at the standard rent-burdened threshold; future hikes will face affordability resistance.
Forward outlook
- Local home prices are declining (-3.0%/yr); year-one equity from $760 of loan paydown is wiped out by about $3k of value loss. Plan a longer hold.
- Jefferson County population projected to shrink 4% by 2050 — rents likely to lag national; underwrite the cash flow, not the appreciation.
Negotiation context
- It's been on market 35 days — a 3% lower offer ($107k) is reasonable based on typical stale-listing flexibility.
- 2 sale attempts with the ask held roughly flat each time — persistent listings suggest the price (not the market) is what's stuck; bring a comps-based counter.
- Current owner paid $50k; list at $110k implies a 120% gain — meaningful room to come down on a strong offer.
Risks & watch-outs
- Watch-outs: built in 1920 — expect roof / HVAC / electrical / plumbing capex.
- Climate carrying-cost: major wind risk, 27% chance of damaging wind over 30y; extreme-heat days projected 7→19/yr by 2055 (HVAC capex compounding) — expect insurance premiums to compound above CPI over the hold.
Questions for the listing agent
- It's been on market 35 days. Have you received any prior offers? Is the seller open to a 3% concession, seller financing, or rate buy-down credit?
- Built in 1920 — when were the roof, HVAC, electrical panel, plumbing, and water heater last replaced?
- Is there a deadline driving the sale (1031 exchange, divorce, estate, relocation)? That informs how much negotiation room exists.
- Schools are F-rated, which usually means shorter tenancies and higher turnover. Who's the typical renter profile here, and what's been the actual vacancy rate?
- Crime grade is F in this area — have there been break-ins, vandalism, or insurance claims at this property in the last 3 years? What carrier currently insures it and at what premium?
- What's the average days-on-market for RENTAL listings here right now (not sales)? A rising rental-DOM trend means longer vacancies and softer asking-rent achievability than the comps imply.
- What's the recent tenant-quality profile in this submarket — average credit score on applications, eviction rate, late-payment / NSF rate, and stable-employment percentage? A property-management company in the area should have these aggregated.
- How much new for-sale + rental construction is in the pipeline within 1–3 miles? Heavy new supply typically softens prices + rents 12–24 months out; constrained supply supports both.
Investment metrics
- 1% rule
- 1.17% ✓
- Cap rate
- 9.10%
- Cash-on-cash
- 10.02%
- DSCR
- 1.45
- GRM
- 7.1
CMA / ARV
- ARV (on-the-fly)
- $122,836
- Comps found
- 12
Show comp detail 12 sales within ~0.75 mi
| Address | Dist | Beds/Ba | Sqft | Sold | Price | $/sf | Match |
|---|---|---|---|---|---|---|---|
| 216 S 3rd Ave | 0.46mi | 3/1.0 | 1,143 (-0%) | 2mo | $75,000 | $66 | 76 |
| 728 Center Pl SW | 0.50mi | 3/1.0 | 1,143 (-0%) | 1mo | $140,000 | $122 | 75 |
| 1724 1st Pl S | 0.20mi | 3/1.0 | 1,250 (+9%) | 1mo | $85,000 | $68 | 75 |
| 741 Center Pl | 0.49mi | 3/1.0 | 1,101 (-4%) | 2mo | $141,000 | $128 | 69 |
| 45 5th Ct | 0.34mi | 3/2.0 | 1,200 (+4%) | 6mo | $152,500 | $127 | 68 |
| 629 Center Pl SW | 0.45mi | 3/1.0 | 1,197 (+4%) | 7mo | $65,500 | $55 | 66 |
| 417 Goldwire St SW | 0.63mi | 3/1.0 | 1,107 (-4%) | 2mo | $95,000 | $86 | 63 |
| 2019 Hollins Dr | 0.54mi | 3/2.0 | 1,120 (-2%) | 5mo | $165,000 | $147 | 62 |
| 1724 Center St S | 0.43mi | 3/2.0 | 1,250 (+9%) | 4mo | $175,493 | $140 | 58 |
| 1601 Center St S | 0.38mi | 3/1.0 | 988 (-14%) | 10mo | $106,000 | $107 | 51 |
| 112 Kappa Ave S | 0.62mi | 3/1.0 | 1,034 (-10%) | 7mo | $25,000 | $24 | 48 |
| 345 Iota Ave S | 0.52mi | 2/1.0 (-1) | 1,279 (+11%) | 4mo | $20,000 | $16 | 48 |
Match score weights: distance 35% · size 25% · config 20% · recency 20%. Top-matched comps best support the ARV.
Projected returns pro-forma
-3.0% appreciation · 2.59% rent growth · sell at horizon
- IRR
- -1.7%
- Equity multiple
- 0.94×
- Total profit
- $-1,945
- Equity at exit
- $16,386
- IRR
- 7.6%
- Equity multiple
- 1.56×
- Total profit
- $17,315
- Equity at exit
- $9,502
Cash invested: $30,772 (down + closing). Projections, not guarantees.
Landlord ↔ Tenant lean methodology
- Overall (STATE)
- 90 Strongly Landlord-Friendly
- State Alabama
- 90 Strongly Landlord-Friendly · R+15
- County
- — inherits STATE
- City
- — inherits STATE
ZIP-level market 35205
- Rents YoY
- 2.6%
- Active inventory
- 125
- Price-to-rent
- 7.1×
Monthly cashflow live
- Estimated rent
- $1,287 high interval (Pro) →
- Mortgage (P&I)
- −$576
- Tax est. 1.5%
- −$137 /mo · $1,648/yr
- Insurance
- −$46
- HOA
- −$0
- Lot rent
- −$0
- Vacancy / Maint / Mgmt
- −$270
- Net cashflow
- $257
Break-even live
Sensitivity live
| Price | -10% $333 | -5% $295 | +0% $257 | +5% $219 | +10% $181 |
|---|---|---|---|---|---|
| Rent | -10% $155 | -5% $206 | +0% $257 | +5% $308 | +10% $359 |
| Rate | -1.0pp $312 | -0.5pp $285 | base $257 | +0.5pp $229 | +1.0pp $200 |
UW: 25.0% down · 7.5% · 30yr · 1.5% tax · 5.0% vac · 8.0% maint · 8.0% mgmt
Financing live
Cash to close
- Down payment
- $27,475
- Closing costs
- $3,297
- Reserves months
- —
- Total cash needed
- —
Loan-product check · same deal, 3 products live
Conventional
25% down · 7.5% · 30yr
- Down + closing
- —
- Monthly P&I
- —
- Monthly cashflow
- —
- DSCR
- —
- Eligible?
- —
Personal DTI + credit; lowest rate.
DSCR
20% down · 8.5% · 30yr
- Down + closing
- —
- Monthly P&I
- —
- Monthly cashflow
- —
- DSCR
- —
- Eligible?
- —
No personal income docs; deal must DSCR.
Hard money
10% down · 12.0% · 12mo
- Down + closing
- —
- Monthly P&I
- —
- Monthly cashflow
- —
- DSCR
- —
- Eligible?
- —
Short-term bridge; refi at stabilization.
Rent comps 40 comps
| Address | Beds | Baths | Sqft | Rent | $/sqft | DOM | Units | Dist |
|---|---|---|---|---|---|---|---|---|
| 806 Gamma St S Birmingham, AL | 3.0 | 1.0 | 1252 | $1,200 | $0.96 | 46d | 1 | 0.02mi |
| 313 Beta St S Unit 317A Birmingham, AL | 2.0 | 1.0 | 850 | $799 | $0.94 | 4d | 1 | 0.42mi |
| 310 Gamma St S Birmingham, AL | 3.0 | 1.5 | 1001 | $1,200 | $1.20 | 18d | 1 | 0.44mi |
| 506 Alpha St S Birmingham, AL | 3.0 | 1.0 | 944 | $1,373 | $1.45 | 46d | 1 | 0.44mi |
| 741 Center Pl SW Birmingham, AL | 3.0 | 1.0 | 1101 | $1,250 | $1.14 | 18d | 1 | 0.48mi |
| 609 Idlewild Cir Apt B Birmingham, AL | 2.0 | 1.0 | 705 | $875 | $1.24 | 6d | 1 | 0.51mi |
| 12 4th Ave SW Unit 1 Birmingham, AL | 3.0 | 1.0 | 1336 | $1,100 | $0.82 | 46d | 1 | 0.55mi |
| 691 Idlewild Cir Birmingham, AL | 2.0 | 2.0 | 777 | $1,382 | $1.78 | 6d | 3 | 0.58mi |
| 407 Green Springs Ave S Birmingham, AL | 2.0 | 1.0 | 866 | $2,000 | $2.31 | 4d | 1 | 0.62mi |
| 856 Center Way SW Birmingham, AL | 3.0 | 2.0 | 1142 | $1,200 | $1.05 | 46d | 1 | 0.63mi |
| 112 Kappa Ave S Birmingham, AL | 3.0 | 2.0 | 1034 | $1,100 | $1.06 | 46d | 1 | 0.64mi |
| 1101 10th Pl S Birmingham, AL | 1.0–2.0 | 1.0–2.0 | 986 | $1,825 | $1.85 | 6d | 11 | 0.72mi |
| 261 3rd Ave SW Birmingham, AL | 1.0–2.0 | 1.0 | 634 | $850 | $1.34 | 6d | 14 | 0.82mi |
| 1413 11th Pl S Birmingham, AL | 2.0 | 1.0 | 829 | $1,282 | $1.55 | 46d | 4 | 0.86mi |
| 1131 16th Ave S Unit A Birmingham, AL | 2.0 | 1.0 | 900 | $1,215 | $1.35 | 5d | 1 | 0.87mi |
| 2217-2249 Green Springs Hwy Unit 2249-E Birmingham, AL | 2.0 | 1.0 | 900 | $910 | $1.01 | 46d | 1 | 0.88mi |
| 2217-2249 Green Springs Hwy Unit 2241-M Birmingham, AL | 3.0 | 2.0 | 1100 | $1,109 | $1.01 | 24d | 1 | 0.88mi |
| 1639 11th Pl S Unit K Birmingham, AL | 2.0 | 1.0 | 845 | $875 | $1.04 | 14d | 1 | 0.88mi |
| 1639 11th Pl S Apt D Birmingham, AL | 2.0 | 1.0 | 845 | $895 | $1.06 | 14d | 1 | 0.88mi |
| 1144 16th Ave S Birmingham, AL | 1.0–2.0 | 1.0–1.5 | 720 | $1,119 | $1.55 | 6d | 6 | 0.91mi |
| 451 2nd Ave N Birmingham, AL | 4.0 | 3.0 | 1400 | $1,600 | $1.14 | 26d | 1 | 0.95mi |
| 1010 Beacon Pkwy E Birmingham, AL | 1.0–2.0 | 1.0–2.0 | 945 | $2,275 | $2.41 | 4d | 18 | 0.96mi |
| 1120 Beacon Pkwy E #408 Birmingham, AL | 2.0 | 2.0 | 1482 | $1,950 | $1.32 | 4d | 1 | 0.97mi |
| 1640 12th St S Unit 1640-J Birmingham, AL | 2.0 | 1.0 | 760 | $1,070 | $1.41 | 24d | 1 | 0.98mi |
| 1644 12th St S Birmingham, AL | 1.0–2.0 | 1.0 | 674 | $1,222 | $1.81 | 4d | 2 | 0.98mi |
| 1229 Beacon Pkwy E Birmingham, AL | 1.0–3.0 | 1.0–2.0 | 1130 | $1,200 | $1.06 | 6d | 16 | 0.99mi |
| 1425 13th St S Unit A Birmingham, AL | 2.0 | 1.0 | 1368 | $1,450 | $1.06 | 46d | 1 | 1.08mi |
| 834 Golden Gate Ln Birmingham, AL | 1.0–3.0 | 1.0–2.0 | 1050 | $1,450 | $1.38 | 46d | 12 | 1.11mi |
| 834 Golden Gate Ln Birmingham, AL | 1.0–3.0 | 1.0–2.0 | 1050 | $1,400 | $1.33 | 4d | 13 | 1.11mi |
| 925 Beacon Pkwy E Birmingham, AL | 1.0–3.0 | 1.0–2.0 | 1259 | $1,199 | $0.95 | 46d | 1 | 1.12mi |
| 1417 13th Pl S Birmingham, AL | 2.0 | 2.0 | 1245 | $1,950 | $1.57 | 24d | 1 | 1.13mi |
| 1322 15th Ave S Unit 1330-D Birmingham, AL | 2.0 | 1.0 | 756 | $1,128 | $1.49 | 24d | 1 | 1.14mi |
| 1322 15th Ave S Unit 1328-A Birmingham, AL | 2.0 | 1.0 | 756 | $1,135 | $1.50 | 18d | 1 | 1.14mi |
| 1322 15th Ave S Unit 1326-F Birmingham, AL | 2.0 | 1.0 | 756 | $1,134 | $1.50 | 18d | 1 | 1.14mi |
| 1322 15th Ave S Birmingham, AL | 2.0 | 1.0 | 582 | $1,297 | $2.23 | 6d | 4 | 1.14mi |
| 1332 14th Ave S Birmingham, AL | 2.0 | 1.5 | 892 | $1,075 | $1.21 | 26d | 2 | 1.15mi |
| 915 Valley Ridge Dr Birmingham, AL | 1.0–3.0 | 1.0–2.5 | 1087 | $1,660 | $1.53 | 4d | 34 | 1.16mi |
| 1340 18th Ave S Apt C2 Birmingham, AL | 2.0 | 1.0 | 750 | $850 | $1.13 | 46d | 1 | 1.20mi |
| 1409 14th St S Birmingham, AL | 2.0 | 1.0 | 940 | $1,257 | $1.34 | 17d | 1 | 1.22mi |
| 1414 13th Ave S Unit 1418 Birmingham, AL | 2.0 | 2.0 | 1039 | $1,700 | $1.64 | 46d | 1 | 1.22mi |
Listing history 19 events
-
2026-06-22days on market $109,900 Active 35 DOM
-
2026-06-21days on market $109,900 Active 34 DOM
-
2026-06-18days on market $109,900 Active 31 DOM
-
2026-06-17days on market $109,900 Active 30 DOM
-
2026-06-16days on market $109,900 Active 29 DOM
-
2026-06-15days on market $109,900 Active 28 DOM
-
2026-06-13days on market $109,900 Active 26 DOM
-
2026-06-10days on market $109,900 Active 23 DOM
-
2026-06-09days on market $109,900 Active 22 DOM
-
2026-06-08days on market $109,900 Active 21 DOM
-
2026-06-07days on market $109,900 Active 20 DOM
-
2026-06-03days on market $109,900 Active 16 DOM
-
2026-06-02days on market $109,900 Active 15 DOM
-
2026-06-01days on market $109,900 Active 14 DOM
-
2026-05-31remarks 364-char remark
-
2026-05-31days on market $109,900 Active 13 DOM
-
2026-05-18$109,900 Active
-
2026-04-16$1,200
-
2025-12-04soldstatus $50,000
ⓘ Source: listings_history table (triggers on properties + properties_extension) + one-shot
backfill from property_details.listing_events for pre-trigger history.
Climate risk First Street
- Flood 1/10 Low FEMA zone X (unshaded) · 0% chance over 30 yrs
- Wildfire 1/10 Low
- Heat 7/10 Severe 7 d/yr ≥106°F today · 19 d/yr by 30 yrs out
- Wind 6/10 Major 27% chance of damaging wind over 30 yrs
- Air quality 4/10 Moderate 6 unhealthy d/yr today · 8 by 30 yrs out
Nearby sold comps map
Loading sold comps map…
Walkable amenities ~0.75 mi
Loading nearby amenities…
Taxation est. · year 1
- Rental income
- $15,441
- − Mortgage interest
- −$6,156
- − Property taxes
- −$1,648
- − Insurance
- −$550
- − Repairs & maintenance
- −$1,235
- − Management
- −$1,235
- − Depreciation
- −$3,197
- Taxable income
- $1,420
- Est. tax owed @ 24.0%
- −$341
- After-tax cash flow
- $2,744/yr
For passive investors: Depreciation is non-cash, so a rental often shows a tax loss while cash-flowing — sheltering income. Rental losses are passive: they offset passive income freely, and up to $25,000/yr can offset ordinary (W-2) income if you actively participate and your MAGI is under $100k (phasing out to $0 by $150k); unused losses carry forward. On sale, claimed depreciation is recaptured at up to 25%, and gains may owe capital-gains tax (a 1031 exchange can defer both). Figures are a year-1 estimate at your 24.0% rate — not tax advice; consult a CPA.
Schools (NCES district)
- District
- Birmingham City
- NCES district ID
- 0100390
- Math proficiency
- 4% ▼ -17.00%
- Reading proficiency
- 20% ▼ -4.00%
- Median HH income
- $31,988
- Composite
- 9.49/100
- National rank
- #9850
- State rank
- #116 of 129 in AL
Livability — Birmingham
- Score
- 67/100
- State rank
- #78
- US rank
- #10412
Category grades
Schools grade is shown separately in the Schools card above.
Census & demographics
- Census place
- Birmingham, AL
- County
- Jefferson County · 527,445 people
- City population
- 210,422
- Metro
- Birmingham-Hoover, AL
- Population (ZIP)
- 18,858
- Household income
- $51,158
- Rent vs Own
- Severe rent burden
- 1468.0
Population outlook (Jefferson County) Hauer SSP2
- Today (2025)
- 669,185 people
- By 2030
- 669,694 · +0.1%
- By 2040
- 661,388 · -1.2%
- By 2050
- 643,086 · -3.9%
- By 2075
- 577,267 · -13.7%
- By 2100
- 474,758 · -29.1%
Race, ethnicity, and origin ACS 2023
- Neighborhood character
- Diverse neighborhood (Simpson 0.56)
- Race & ethnicity
- White 60% Black 26% Hispanic / Latino 5% Asian 5% Two or more races 4%
- Hispanic origin (detail)
- Mexican 3%
- Common ancestry
- Slovak 3% Italian 2% Serbian 2%
- Foreign-born
- 9% · Canada, China, Vietnam
- Languages at home
- 90% English-only · Spanish 4% Other Indo-European 2% Chinese 1%
Political lean MEDSL · Jefferson
- 2024 margin
- D (+10.4) · D 54.6% · R 44.2% · Other 1.2%
- 2008→2024 swing
- +5.4pp toward D · 2008: 5.1pp · 2024: 10.4pp
- All cycles
- 2024: D+10.4 2020: D+13.2 2016: D+7.2 2012: D+6.0 2008: D+5.1
Not yet ingested
- Civics
- —
Market trends
- HPI YoY
- ▼ -199.42%
- Current HPI
- 291.38
- Rent YoY
- ▲ 2.59%
- Metro
- Birmingham-Hoover, AL
- State GDP YoY
- ▲ 2.94%
- F500 in state
- 4
Industry mix (Fortune 500 HQ in AL)
| Industry | F500 HQs | Revenue |
|---|---|---|
| Financial Services | 1 | $8B |
|
||
| Healthcare | 1 | $5B |
|
||
Price history
+119.8% since first listed3 events — show timeline
- 2026-05-18 Listed $109,900 Greater Alabama MLS
- 2026-04-16 Listed for Rent $1,200 BUILDIUM
- 2025-12-04 Sold (Public Records) $50,000 Public Records
Cash-flow waterfall
monthlySold comps — $/sqft
last 12 mo · ≤1 miLoading sold comps…