 🌊 Lakefront
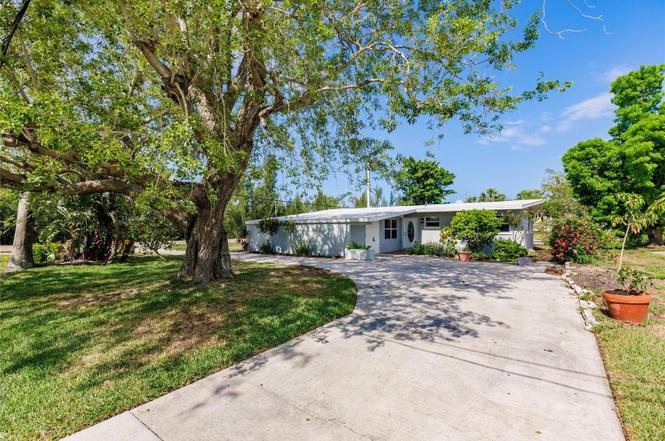
3129 Buttonwood Pl · Charlotte Park, FL
Flood risk 10/10 · Severe
- FEMA flood zone
- AE
- Chance of flooding over 30 yrs
- 0.99%
- Est. flood insurance / yr
- $1,737 – $8,500
Fire risk 2/10 · Minimal
- Est. fire insurance / yr
- $947 – $1,759
Heat risk 10/10 · Severe
- Hot days now (above 107°F)
- 7 days/yr
- Hot days in 30 yrs
- 28 days/yr
Wind risk 10/10 · Severe
- Chance of severe wind over 30 yrs
- 99.0%
Air-quality risk 3/10 · Minor
- Unhealthy air days now
- 2 days/yr
- Unhealthy air days in 30 yrs
- 2 days/yr
Risk factors via First Street. Map © Google.
Why this score? — see what drove the C+ grade
The composite is a weighted blend of 9 inputs, each scored 0–100. Each bar is that input's sub-score; the figure is the points it added to the 100-point composite (weight × sub-score).
- Cash flow +21.9/30.0
- ARV discount +15.0/15.0
- DSCR +7.0/10.0
- 1% rule +4.6/10.0
- Schools +4.6/10.0
- Livability +3.3/5.0
- Rent growth +2.5/5.0
- Condition / age +2.5/5.0
- Appreciation +0.0/10.0
$285,000
🖨 Deal sheet (PDF) 📄 Offer letter ✓ Due diligence
Listing remarks
Nestled on a spacious corner lot with a striking oak tree in the front yard, this canal-front single-family home offers 1,642 square feet of well-designed living space—perfect for a growing family. Featuring 3 bedrooms, 2 bathrooms, and a flexible bonus room, this home combines comfort, function, and versatility. A brand-new roof (2024), large circular driveway, and updated interior add both curb appeal and peace of mind. Step inside to discover a thoughtfully updated interior that blends modern convenience with inviting warmth. The open split floor plan features tile flooring throughout the main living areas, enhancing the home's clean and cohesive design. The heart of the home is th
Key facts
- Canal front
- Brand new roof
- Remodeled kitchen
Tags
Property features AI
Finance
- Other: Homestead exemption indicated
- Financial info: No lease restrictions
- HOA & community: No association fees; no association approval required; Pets allowed
Exterior
- Parking: Boat parking; Circular driveway; Driveway; Off-street parking; Oversized parking
- Security: Smoke detector(s)
- Utilities: Public water; Septic tank; Cable connected and available; Broadband/high-speed internet available; Electricity connected and available
- Home design: Single family residence; One-story; East-facing; Residential zoning (RSF5)
- Construction: Block and stucco construction; Other roof type; Slab foundation; Built on a 0.24-acre corner lot (level, oversized, street dead-end, flood zone)
- Exterior features: Outdoor lighting; Seawall (concrete); Canal water view and waterfront access; Mature landscaping; Paved roads and public maintained road
Interior
- Kitchen: Dishwasher; Microwave; Range; Refrigerator; Electric water heater
- Bedrooms: 4 bedrooms
- Flooring: Ceramic tile
- Bathrooms: 2 full bathrooms
- Heating & cooling: Electric heating; Central air conditioning
- Interior features: Ceiling fans; Eat-in kitchen; Open floorplan; Split bedroom layout; Window treatments; Smoke detectors
- Laundry & utility: Inside laundry room with washer and electric dryer hookups
Neighborhood map
What this means for you Summary
Snapshot
- This is a 3-bed/2.0-bath single-family listed at $285k.
Deal economics
- At list price, monthly cash flow is $23 ($281/yr) — positive.
- The deal already cash-flows at list — no discount required.
- To meet the 1% rule (rent ≥ 1% of price), the offer needs to be $274k (3.8% below list).
- Recommended offer: $251k (12.0% below list) — sets the bar for market timing.
- Cap rate 8.2% vs local median 4.3% in Charlotte Park — top-decile yield for the area; either an underpriced asset or a hidden risk that comps aren't pricing in. Stress-test before assuming the spread holds.
Location & tenants
- Location reads 66/100 on livability (#624 in FL) — a middle-class / working-renter tenant base. Strengths: crime A+, cost of living A+, housing A+; Watch: amenities F, commute F, health & safety D-.
- Charlotte (suburban): math 54% / reading 54% proficiency, ranked #22 of 73 in FL (top 30%) — acceptable for families but not a draw, mixed tenant base, ~2y average lease.
- Zoned schools: Sallie Jones Elementary School (math 75% / reading 74%, grade A, #230 of 2,144 statewide, top 12%, 694 students, 47% FRL); Charlotte High School (math 44% / reading 46%, grade D-, #228 of 667 statewide, top 35%, 1,994 students, 41% FRL).
- Market conditions: Rents soft (-0.1%/yr); 999 active listings in the ZIP; 40 comparable units currently listed for rent nearby; rentals at typical pace (median 22d on market — plan ~3-4 weeks tenant-placement turnaround); solid renter incomes; 4,585 units permitted in Charlotte County in 2024 (703 in 5+ unit buildings).
- This rent runs 43% of the median local income ($76k/yr) — at the standard rent-burdened threshold; future hikes will face affordability resistance.
Forward outlook
- Local home prices are declining (-3.0%/yr); year-one equity from $2k of loan paydown is wiped out by about $9k of value loss. Plan a longer hold.
- Charlotte County population projected at +24% by 2050 — long-run rental-demand tailwind backs the buy-and-hold thesis.
Negotiation context
- It's been on market 387 days — a 12% lower offer ($251k) is reasonable based on typical stale-listing flexibility.
- 2 sale attempts since 17y ago; this cycle's ask has dropped $64k (18%) from the opening price — seller is motivated, your offer sets the floor, not the list.
- Current owner paid $58k; list at $285k implies a 391% gain — meaningful room to come down on a strong offer.
Risks & watch-outs
- Watch-outs: flood insurance adds $427/mo.
- Climate carrying-cost: in FEMA flood zone AE (mandatory federal flood insurance); severe wind risk, 99% chance of damaging wind over 30y; extreme-heat days projected 7→28/yr by 2055 (HVAC capex compounding) — expect insurance premiums to compound above CPI over the hold.
Questions for the listing agent
- It's been on market 387 days. Have you received any prior offers? Is the seller open to a 12% concession, seller financing, or rate buy-down credit?
- Built in 1962 — when were the roof, HVAC, electrical panel, plumbing, and water heater last replaced?
- What's the actual annual flood-insurance premium (NFIP or private), and is the property in a SFHA with mandatory coverage?
- Why hasn't it sold? Are there any deal-killer items the seller is aware of (foundation, flood, title, zoning, code violations)?
- Is there a deadline driving the sale (1031 exchange, divorce, estate, relocation)? That informs how much negotiation room exists.
- Schools are F-rated, which usually means shorter tenancies and higher turnover. Who's the typical renter profile here, and what's been the actual vacancy rate?
- This sits on a lake — are riparian / water-frontage rights deeded with the parcel? Any dock permits, shoreline easements, or HOA water-use restrictions?
- What's the documented flood / surge / shoreline-erosion history here (FEMA AND non-FEMA — e.g., storm surge, creek backup, septic-field saturation)?
- Any water-quality or seasonal algae-bloom issues that affect tenant satisfaction or short-term-rental demand?
- What's the average days-on-market for RENTAL listings here right now (not sales)? A rising rental-DOM trend means longer vacancies and softer asking-rent achievability than the comps imply.
- What's the recent tenant-quality profile in this submarket — average credit score on applications, eviction rate, late-payment / NSF rate, and stable-employment percentage? A property-management company in the area should have these aggregated.
- How much new for-sale + rental construction is in the pipeline within 1–3 miles? Heavy new supply typically softens prices + rents 12–24 months out; constrained supply supports both.
Investment metrics
- 1% rule
- 0.96% ✗
- Cap rate
- 8.19%
- Cash-on-cash
- 6.77%
- DSCR
- 1.30
- GRM
- 8.7
CMA / ARV
- ARV (on-the-fly)
- $356,314
- Comps found
- 10
Show comp detail 10 sales within ~0.75 mi
| Address | Dist | Beds/Ba | Sqft | Sold | Price | $/sf | Match |
|---|---|---|---|---|---|---|---|
| 1000 Marlin Dr | 0.23mi | 3/2.0 | 1,543 (-6%) | 6mo | $165,000 | $107 | 74 |
| 3425 Magnolia Way | 0.34mi | 3/2.0 | 1,537 (-6%) | 3mo | $403,000 | $262 | 71 |
| 24556 Rio Villa Lakes Cir | 0.72mi | 3/2.0 | 1,575 (-4%) | 2mo | $250,000 | $159 | 58 |
| 3021 Palm Dr | 0.43mi | 3/2.0 | 1,446 (-12%) | 9mo | $314,000 | $217 | 53 |
| 24676 Rio Villa Lakes Cir | 0.62mi | 3/2.0 | 1,477 (-10%) | 3mo | $317,000 | $215 | 52 |
| 324 Tarpon Way | 0.54mi | 3/2.0 | 1,821 (+11%) | 6mo | $385,000 | $211 | 52 |
| 1112 Muscovie Ct | 0.54mi | 3/2.0 | 1,867 (+14%) | 1mo | $531,000 | $284 | 51 |
| 808 Santa Margerita Ln | 0.66mi | 3/2.0 | 1,790 (+9%) | 6mo | $473,000 | $264 | 49 |
| 808 Lucia Dr | 0.70mi | 3/2.0 | 1,831 (+12%) | 6mo | $710,000 | $388 | 44 |
| 3510 Amanda St | 0.67mi | 2/2.0 (-1) | 1,412 (-14%) | 16mo | $225,000 | $159 | 28 |
Match score weights: distance 35% · size 25% · config 20% · recency 20%. Top-matched comps best support the ARV.
Projected returns pro-forma
-3.0% appreciation · 0.0% rent growth · sell at horizon
- IRR
- -19.4%
- Equity multiple
- 0.34×
- Total profit
- $-52,574
- Equity at exit
- $42,494
- IRR
- -21.0%
- Equity multiple
- 0.07×
- Total profit
- $-74,303
- Equity at exit
- $24,642
Cash invested: $79,800 (down + closing). Projections, not guarantees.
Landlord ↔ Tenant lean methodology
- Overall (STATE)
- 87 Strongly Landlord-Friendly
- State Florida
- 87 Strongly Landlord-Friendly · R+3
- County
- — inherits STATE
- City
- — inherits STATE
ZIP-level market 33950
- Home prices YoY
- -29.9%
- Rents YoY
- -0.1%
- Active inventory
- 999
- Price-to-rent
- 8.7×
Monthly cashflow live
- Estimated rent
- $2,741 high interval (Pro) →
- Mortgage (P&I)
- −$1,495
- Tax from tax record
- −$102 /mo · $1,226/yr
- Insurance
- −$119
- Flood insurance flood zone
- −$427 /mo · $5,118/yr
- HOA
- −$0
- Vacancy / Maint / Mgmt
- −$576
- Net cashflow
- $23
Break-even live
Sensitivity live
| Price | -10% $185 | -5% $104 | +0% $23 | +5% $-57 | +10% $-138 |
|---|---|---|---|---|---|
| Rent | -10% $-193 | -5% $-85 | +0% $23 | +5% $132 | +10% $240 |
| Rate | -1.0pp $167 | -0.5pp $96 | base $23 | +0.5pp $-50 | +1.0pp $-126 |
UW: 25.0% down · 7.5% · 30yr · 1.5% tax · 5.0% vac · 8.0% maint · 8.0% mgmt
Financing live
Cash to close
- Down payment
- $71,250
- Closing costs
- $8,550
- Reserves months
- —
- Total cash needed
- —
Loan-product check · same deal, 3 products live
Conventional
25% down · 7.5% · 30yr
- Down + closing
- —
- Monthly P&I
- —
- Monthly cashflow
- —
- DSCR
- —
- Eligible?
- —
Personal DTI + credit; lowest rate.
DSCR
20% down · 8.5% · 30yr
- Down + closing
- —
- Monthly P&I
- —
- Monthly cashflow
- —
- DSCR
- —
- Eligible?
- —
No personal income docs; deal must DSCR.
Hard money
10% down · 12.0% · 12mo
- Down + closing
- —
- Monthly P&I
- —
- Monthly cashflow
- —
- DSCR
- —
- Eligible?
- —
Short-term bridge; refi at stabilization.
Rent comps 40 comps
| Address | Beds | Baths | Sqft | Rent | $/sqft | DOM | Units | Dist |
|---|---|---|---|---|---|---|---|---|
| 3004 Banyan Way Punta Gorda, FL | 3.0 | 2.0 | 1522 | $3,390 | $2.23 | 22d | 1 | 0.10mi |
| 2811 Poinciana Ct Punta Gorda, FL | 3.0 | 2.0 | 2154 | $2,300 | $1.07 | 14d | 1 | 0.27mi |
| 1340 Rock Dove Ct #144 Punta Gorda, FL | 3.0 | 2.0 | 1813 | $1,850 | $1.02 | 22d | 1 | 0.28mi |
| 1340 Rock Dove Ct #144 Punta Gorda, FL | 3.0 | 2.0 | 1813 | $1,850 | $1.02 | 14d | 1 | 0.28mi |
| 2736 Magdalina Dr Punta Gorda, FL | 3.0 | 2.0 | 2004 | $5,000 | $2.50 | 22d | 1 | 0.29mi |
| 3025 Magnolia Way Punta Gorda, FL | 2.0 | 2.0 | 1068 | $2,500 | $2.34 | 22d | 1 | 0.33mi |
| 920 Conecta Dr Punta Gorda, FL | 2.0 | 2.5 | 1137 | $1,500 | $1.32 | 14d | 1 | 0.37mi |
| 1431 Aqui Esta Dr #411 Punta Gorda, FL | 3.0 | 2.0 | 1556 | $2,000 | $1.29 | 22d | 1 | 0.48mi |
| 625 Pompano Ter Punta Gorda, FL | 2.0 | 2.0 | 1220 | $1,850 | $1.52 | 22d | 1 | 0.48mi |
| 3320 Palm Dr Punta Gorda, FL | 3.0 | 2.0 | 1703 | $2,400 | $1.41 | 22d | 1 | 0.49mi |
| 323 Dolphin Pkwy Punta Gorda, FL | 2.0 | 2.0 | 1272 | $2,100 | $1.65 | 22d | 1 | 0.50mi |
| 2926 Vasco St Unit 112 Punta Gorda, FL | 3.0 | 2.0 | 1329 | $2,250 | $1.69 | 22d | 1 | 0.56mi |
| 3228 Purple Martin Dr #125 Punta Gorda, FL | 3.0 | 2.0 | 1501 | $4,000 | $2.66 | 14d | 1 | 0.56mi |
| 3228 Purple Martin Dr #125 Punta Gorda, FL | 3.0 | 2.0 | 1501 | $4,000 | $2.66 | 22d | 1 | 0.56mi |
| 3322 Purple Martin Dr #132 Punta Gorda, FL | 2.0 | 2.0 | 1381 | $1,650 | $1.19 | 22d | 1 | 0.62mi |
| 3322 Purple Martin Dr Unit Reservation Spot 1 Punta Gorda, FL | 2.0 | 2.0 | 1400 | $3,800 | $2.71 | 22d | 1 | 0.62mi |
| 3334 Purple Martin Dr #211 Punta Gorda, FL | 2.0 | 2.0 | 1851 | $4,500 | $2.43 | 22d | 1 | 0.62mi |
| 1204 Spanish Cay Ln Unit A Punta Gorda, FL | 2.0 | 2.0 | 1176 | $1,495 | $1.27 | 22d | 1 | 0.63mi |
| 732 Santa Margerita Ln Punta Gorda, FL | 3.0 | 2.0 | 2017 | $3,000 | $1.49 | 22d | 1 | 0.66mi |
| 255 W End Dr Punta Gorda, FL | 2.0–3.0 | 2.0 | 1559 | $3,500 | $2.24 | 22d | 3 | 0.69mi |
| 240 W End Dr #611 Punta Gorda, FL | 2.0 | 2.0 | 1306 | $1,675 | $1.28 | 22d | 1 | 0.73mi |
| 4020 Palm Dr Punta Gorda, FL | 2.0 | 2.0 | 1228 | $2,300 | $1.87 | 22d | 1 | 0.74mi |
| 1001 Mineo Dr Punta Gorda, FL | 3.0 | 2.0 | 1850 | $4,500 | $2.43 | 22d | 1 | 0.75mi |
| 1080 Bal Harbor Blvd Unit 4D Punta Gorda, FL | 2.0 | 2.0 | 1114 | $1,675 | $1.50 | 22d | 1 | 0.86mi |
| 601 Shreve St Punta Gorda, FL | 2.0 | 2.0 | 1396 | $3,500 | $2.51 | 22d | 3 | 0.88mi |
| 16 Freeman Ave Unit Reservation spot 2 Punta Gorda, FL | 2.0 | 2.0 | 1375 | $3,500 | $2.55 | 22d | 1 | 0.88mi |
| 2000 Bal Harbor Blvd #9112 Punta Gorda, FL | 3.0 | 2.0 | 1517 | $1,900 | $1.25 | 14d | 1 | 0.91mi |
| 945 Bal Harbor Blvd Punta Gorda, FL | 3.0 | 2.0 | 2085 | $5,500 | $2.64 | 22d | 1 | 0.95mi |
| 311 Garvin St Unit 407A Punta Gorda, FL | 2.0 | 2.0 | 1114 | $2,200 | $1.97 | 22d | 1 | 0.95mi |
| 2001 Bal Harbor Blvd #2412 Punta Gorda, FL | 2.0 | 2.0 | 1367 | $2,300 | $1.68 | 14d | 1 | 0.96mi |
| 2002 Bal Harbor Blvd Punta Gorda, FL | 3.0 | 2.0 | 1517 | $2,700 | $1.78 | 22d | 1 | 0.96mi |
| 2 Emden Cir Unit 1 Punta Gorda, FL | 2.0 | 2.0 | 1800 | $3,500 | $1.94 | 22d | 1 | 0.96mi |
| 67 Windmill Blvd Unit 212O Punta Gorda, FL | 2.0 | 2.0 | 1620 | $1,895 | $1.17 | 22d | 1 | 0.98mi |
| 3640 Bal Harbor Blvd #534 Punta Gorda, FL | 2.0 | 2.0 | 1405 | $1,800 | $1.28 | 14d | 1 | 1.03mi |
| 316 Coldeway Dr #26 Punta Gorda, FL | 2.0 | 2.0 | 1460 | $1,500 | $1.03 | 14d | 1 | 1.05mi |
| 1620 Montia Ct Punta Gorda, FL | 2.0 | 2.0 | 1100 | $2,300 | $2.09 | 22d | 1 | 1.05mi |
| 423 Matares Dr Punta Gorda, FL | 2.0 | 2.0 | 1650 | $2,500 | $1.52 | 22d | 1 | 1.07mi |
| 3627 Bal Harbor Blvd Punta Gorda, FL | 2.0 | 2.0 | 1105 | $2,500 | $2.26 | 22d | 1 | 1.09mi |
| 1980 Aqui Esta Dr Punta Gorda, FL | 3.0 | 2.0 | 1862 | $2,850 | $1.53 | 22d | 1 | 1.11mi |
| 470 Bal Harbor Blvd Punta Gorda, FL | 3.0 | 2.0 | 2213 | $5,000 | $2.26 | 22d | 1 | 1.13mi |
Listing history 21 events
-
2026-06-18days on market $285,000 Active 387 DOM
-
2026-06-17days on market $285,000 Active 386 DOM
-
2026-06-16days on market $285,000 Active 385 DOM
-
2026-06-15days on market $285,000 Active 384 DOM
-
2026-06-14days on market $285,000 Active 382 DOM
-
2026-06-13days on market $285,000 Active 381 DOM
-
2026-06-10days on market $285,000 Active 379 DOM
-
2026-06-09days on market $285,000 Active 378 DOM
-
2026-06-08days on market $285,000 Active 377 DOM
-
2026-06-05days on market $285,000 Active 373 DOM
-
2026-06-02days on market $285,000 Active 371 DOM
-
2026-06-01days on market $285,000 Active 370 DOM
-
2026-05-31days on market $285,000 Active 369 DOM
-
2026-05-30days on market $285,000 Active 368 DOM
-
2026-03-18price $285,000
-
2026-02-17price $295,000
-
2025-12-18price $300,000
-
2025-08-08price $325,000
-
2025-05-27$349,000 Active
-
2009-11-18$149,000
-
1988-12-01soldstatus $58,000
ⓘ Source: listings_history table (triggers on properties + properties_extension) + one-shot
backfill from property_details.listing_events for pre-trigger history.
Tax reassessment forecast FL · Resets to sale price
- Current annual tax
- $1,226 · $102/mo
- Projected year-2 tax
- $2,366 · $197/mo
- Expected delta
- +$1,140/yr (+$95/mo · 93.0%)
ⓘ Screening estimate from a state-policy table — verify with the county assessor before closing.
Climate risk First Street
- Flood 10/10 Extreme FEMA zone AE · 99% chance over 30 yrs
- Wildfire 2/10 Low
- Heat 10/10 Extreme 7 d/yr ≥107°F today · 28 d/yr by 30 yrs out
- Wind 10/10 Extreme 99% chance of damaging wind over 30 yrs
- Air quality 3/10 Moderate 2 unhealthy d/yr today · 2 by 30 yrs out
Nearby sold comps map
Loading sold comps map…
Walkable amenities ~0.75 mi
Loading nearby amenities…
Taxation est. · year 1
- Rental income
- $32,893
- − Mortgage interest
- −$15,964
- − Property taxes
- −$1,226
- − Insurance
- −$6,544
- − Repairs & maintenance
- −$2,631
- − Management
- −$2,631
- − Depreciation
- −$8,291
- Taxable loss
- −$4,394
- Est. tax savings @ 24.0%
- +$1,055
- After-tax cash flow
- $1,336/yr
For passive investors: Depreciation is non-cash, so a rental often shows a tax loss while cash-flowing — sheltering income. Rental losses are passive: they offset passive income freely, and up to $25,000/yr can offset ordinary (W-2) income if you actively participate and your MAGI is under $100k (phasing out to $0 by $150k); unused losses carry forward. On sale, claimed depreciation is recaptured at up to 25%, and gains may owe capital-gains tax (a 1031 exchange can defer both). Figures are a year-1 estimate at your 24.0% rate — not tax advice; consult a CPA.
Schools (NCES district)
- District
- Charlotte
- NCES district ID
- 1200240
- Math proficiency
- 54% ▼ -6.00%
- Reading proficiency
- 54% ▼ -1.00%
- Median HH income
- $44,864
- Composite
- 45.62/100
- National rank
- #2586
- State rank
- #22 of 73 in FL
Livability — Charlotte Park
- Score
- 66/100
- State rank
- #624
- US rank
- #12150
Category grades
Schools grade is shown separately in the Schools card above.
Census & demographics
- Census place
- Charlotte Park, FL
- County
- Charlotte County · 196,994 people
- Metro
- Punta Gorda, FL
- Population (ZIP)
- 24,955
- Household income
- $76,369
- Rent vs Own
- Severe rent burden
- 608.0
Population outlook (Charlotte County) Hauer SSP2
- Today (2025)
- 198,646 people
- By 2030
- 210,507 · +6.0%
- By 2040
- 230,857 · +16.2%
- By 2050
- 247,148 · +24.4%
- By 2075
- 281,777 · +41.8%
- By 2100
- 293,609 · +47.8%
Race, ethnicity, and origin ACS 2023
- Neighborhood character
- Predominantly White (86%)
- Race & ethnicity
- White 86% Two or more races 5% Black 5% Hispanic / Latino 4% Asian 1%
- Common ancestry
- Lithuanian 5% Romanian 4% Italian 2%
- Foreign-born
- 7% · Canada
- Languages at home
- 95% English-only · Spanish 3% Other Indo-European 1% German/W. Germanic 1%
Political lean MEDSL · Charlotte
- 2024 margin
- Solid R (+34.0) · D 32.7% · R 66.7%
- 2008→2024 swing
- -26.7pp toward R · 2008: -7.2pp · 2024: -34.0pp
- All cycles
- 2024: R+34.0 2020: R+26.6 2016: R+27.8 2012: R+14.3 2008: R+7.2
Not yet ingested
- Civics
- —
Market trends
- HPI YoY
- ▼ -111.73%
- Current HPI
- 261.6573
- Rent YoY
- ▼ -0.06%
- Metro
- Punta Gorda, FL
- State GDP YoY
- ▲ 3.28%
- F500 in state
- 36
Industry mix (Fortune 500 HQ in FL)
| Industry | F500 HQs | Revenue |
|---|---|---|
| Industrial Technology | 2 | $29B |
|
||
| Insurance | 2 | $17B |
|
||
| Retail | 1 | $60B |
|
||
| Technology Distribution | 1 | $58B |
|
||
| Homebuilding | 1 | $35B |
|
||
| Technology Manufacturing | 1 | $35B |
|
||
Price history
+391.4% since first listed7 events — show timeline
- 2026-03-18 Price Changed $285,000 Stellar MLS as Distributed by MLS Grid
- 2026-02-17 Price Changed $295,000 Stellar MLS as Distributed by MLS Grid
- 2025-12-18 Price Changed $300,000 Stellar MLS as Distributed by MLS Grid
- 2025-08-08 Price Changed $325,000 Stellar MLS as Distributed by MLS Grid
- 2025-05-27 Listed $349,000 Stellar MLS as Distributed by MLS Grid
- 2009-11-18 Listed $149,000 Stellar MLS as Distributed by MLS Grid
- 1988-12-01 Sold (Public Records) $58,000 Public Records
Property tax history
-2.5%/yrLatest (2025): $1,226 · -38.7% YoY. Source: county tax records.
Cash-flow waterfall
monthlySold comps — $/sqft
last 12 mo · ≤1 miLoading sold comps…