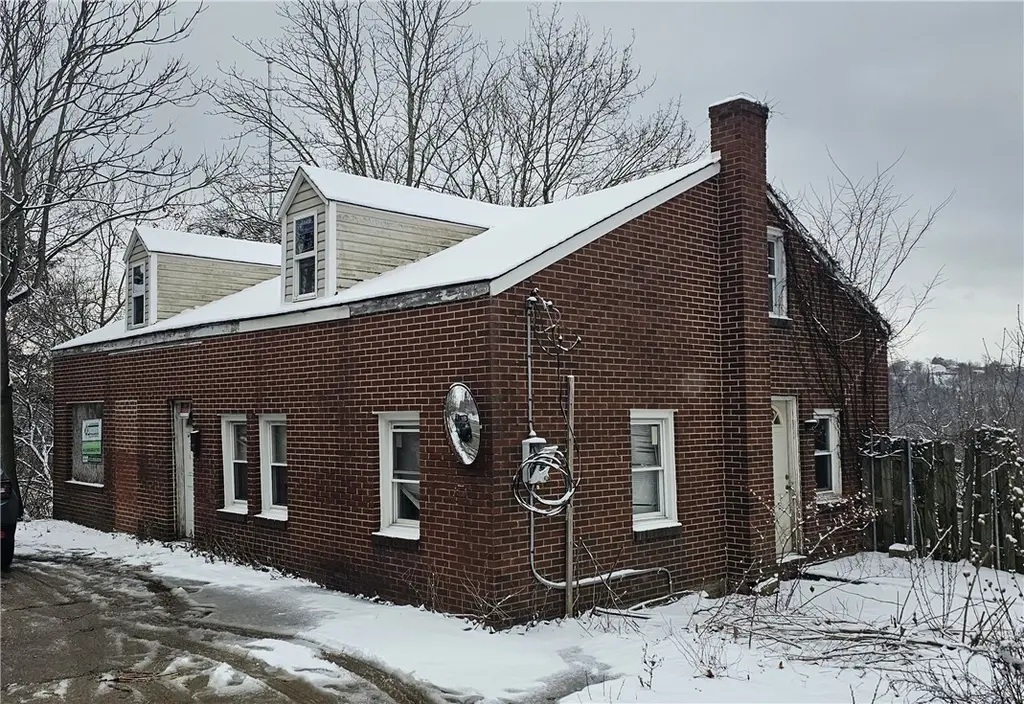
2851 Mount Troy Rd · Reserve, PA
Flood risk 1/10 · Minimal
- FEMA flood zone
- X (unshaded)
- Chance of flooding over 30 yrs
- 0.0%
- Est. flood insurance / yr
- $473 – $860
Fire risk 1/10 · Minimal
- Est. fire insurance / yr
- $511 – $949
Heat risk 3/10 · Minor
- Hot days now (above 98°F)
- 7 days/yr
- Hot days in 30 yrs
- 17 days/yr
Wind risk 2/10 · Minimal
- Chance of severe wind over 30 yrs
- 0.0%
Air-quality risk 4/10 · Minor
- Unhealthy air days now
- 4 days/yr
- Unhealthy air days in 30 yrs
- 5 days/yr
Risk factors via First Street. Map © Google.
Why this score? — see what drove the B grade
The composite is a weighted blend of 9 inputs, each scored 0–100. Each bar is that input's sub-score; the figure is the points it added to the 100-point composite (weight × sub-score).
- Cash flow +30.0/30.0
- 1% rule +10.0/10.0
- DSCR +10.0/10.0
- ARV discount +7.5/15.0
- Schools +4.1/10.0
- Rent growth +3.5/5.0
- Livability +2.5/5.0
- Condition / age +2.5/5.0
- Appreciation +0.0/10.0
$42,000
🖨 Deal sheet 📄 Offer letter ✓ Due diligence
Listing remarks MLS
Solid, brick ranch featuring 3 bedrooms, 1 bathroom and 1,614 square feet. The property has a main level bedroom and bathroom and off-street parking and is being sold as-is.
Key facts
- 0.61 acre lot
- Parking
- Built 1920
Neighborhood map
What this means for you Summary
Snapshot
- This is a 2-bed/1.5-bath single-family listed at $42k.
Deal economics
- At list price, monthly cash flow is $1k ($13k/yr) — positive.
- The deal already cash-flows at list — no discount required.
- Meets the 1% rule at list price ($2k rent vs $42k).
- Recommended offer: $37k (12.0% below list) — sets the bar for market timing.
Location & tenants
- Location reads: area grade B — affects rentability + tenant quality, not the cash-flow math above.
- Shaler Area SD (suburban): math 36% / reading 59% proficiency, ranked #208 of 539 in PA (top 39%) — families likely to look elsewhere, expect single-tenant / working-renter base with shorter leases.
- Market conditions: Rents rising fast (+4.0%/yr); 11 active listings in the ZIP; 8 comparable units currently listed for rent nearby; rentals at typical pace (median 15d on market — plan ~3-4 weeks tenant-placement turnaround); 2,996 units permitted in Allegheny County in 2024 (1,588 in 5+ unit buildings).
- This rent runs 32% of the median local income ($64k/yr) — at the standard rent-burdened threshold; future hikes will face affordability resistance.
Forward outlook
- Local home prices are declining (-3.0%/yr); year-one equity from $290 of loan paydown is wiped out by about $1k of value loss. Plan a longer hold.
- At projected returns (-3.0% appreciation + 4.0% rent growth), your $12k cash investment doubles in ~2 years — after that, you're playing with house money.
Negotiation context
- It's been on market 181 days — a 12% lower offer ($37k) is reasonable based on typical stale-listing flexibility.
- 2 sale attempts since 2y ago; this cycle's ask has dropped $8k (16%) from the opening price — seller is motivated, your offer sets the floor, not the list.
- Current owner paid $22k; list at $42k implies a 91% gain — meaningful room to come down on a strong offer.
Risks & watch-outs
- Watch-outs: built in 1920 — expect roof / HVAC / electrical / plumbing capex.
Questions for the listing agent
- It's been on market 181 days. Have you received any prior offers? Is the seller open to a 12% concession, seller financing, or rate buy-down credit?
- Built in 1920 — when were the roof, HVAC, electrical panel, plumbing, and water heater last replaced?
- Why hasn't it sold? Are there any deal-killer items the seller is aware of (foundation, flood, title, zoning, code violations)?
- Is there a deadline driving the sale (1031 exchange, divorce, estate, relocation)? That informs how much negotiation room exists.
- What's the average days-on-market for RENTAL listings here right now (not sales)? A rising rental-DOM trend means longer vacancies and softer asking-rent achievability than the comps imply.
- What's the recent tenant-quality profile in this submarket — average credit score on applications, eviction rate, late-payment / NSF rate, and stable-employment percentage? A property-management company in the area should have these aggregated.
- How much new for-sale + rental construction is in the pipeline within 1–3 miles? Heavy new supply typically softens prices + rents 12–24 months out; constrained supply supports both.
Investment metrics
- 1% rule
- 4.02% ✓
- Cap rate
- 36.07%
- Cash-on-cash
- 106.34%
- DSCR
- 5.73
- GRM
- 2.1
CMA / ARV
- ARV (median comp)
- $256,433
- List price
- $42,000
- Delta
- -83.62%
- Verdict
- UNDERPRICED
- Comps
- 20 within 1.0 mi
Show comp detail 12 sales within ~0.75 mi
| Address | Dist | Beds/Ba | Sqft | Sold | Price | $/sf | Match |
|---|---|---|---|---|---|---|---|
| 1619 Haug St | 0.69mi | 2/1.5 | 1,836 (-0%) | 2mo | $180,000 | $98 | 66 |
| 2375 E Beckert Ave | 0.37mi | 3/2.0 (+1) | 1,715 (-7%) | 1mo | $265,000 | $155 | 64 |
| 1339 Romanhoff St | 0.55mi | 3/1.0 (+1) | 1,800 (-2%) | 2mo | $61,000 | $34 | 63 |
| 3226 Spring Gdn | 0.35mi | 3/2.0 (+1) | 1,710 (-7%) | 8mo | $149,000 | $87 | 58 |
| 1411 Hetzel St | 0.66mi | 3/2.0 (+1) | 1,952 (+6%) | 2mo | $295,000 | $151 | 50 |
| 833 Reserve St | 0.45mi | 3/1.5 (+1) | 1,632 (-11%) | 8mo | $317,900 | $195 | 49 |
| 841 Stanton Ave | 0.48mi | 3/1.5 (+1) | 1,648 (-10%) | 11mo | $235,000 | $143 | 47 |
| 9 Spring St | 0.53mi | 3/1.0 (+1) | 1,750 (-5%) | 16mo | $150,000 | $86 | 46 |
| 1146 S Side Ave | 0.58mi | 3/2.0 (+1) | 1,736 (-6%) | 14mo | $260,000 | $150 | 45 |
| 419 Kinkura Dr | 0.33mi | 3/2.0 (+1) | 1,616 (-12%) | 15mo | $270,000 | $167 | 45 |
| 2100 Rockledge St | 0.65mi | 3/1.0 (+1) | 1,712 (-7%) | 9mo | $236,000 | $138 | 44 |
| 130 Royal St | 0.74mi | 3/1.5 (+1) | 1,737 (-5%) | 18mo | $35,000 | $20 | 37 |
Match score weights: distance 35% · size 25% · config 20% · recency 20%. Top-matched comps best support the ARV.
Projected returns pro-forma
-3.0% appreciation · 4.01% rent growth · sell at horizon
- IRR
- —
- Equity multiple
- 6.21×
- Total profit
- $61,322
- Equity at exit
- $6,262
- IRR
- —
- Equity multiple
- 13.43×
- Total profit
- $146,216
- Equity at exit
- $3,631
Cash invested: $11,760 (down + closing). Projections, not guarantees.
Landlord ↔ Tenant lean methodology
- Overall (STATE)
- 62 Landlord-Friendly
- State Pennsylvania
- 62 Landlord-Friendly · EVEN
- County
- — inherits STATE
- City
- — inherits STATE
ZIP-level market 15212
- Home prices YoY
- -31.6%
- Rents YoY
- 4.0%
- Active inventory
- 11
- Price-to-rent
- 2.1×
Monthly cashflow live
- Estimated rent
- $1,687 medium interval (Pro) →
- Mortgage (P&I)
- −$220
- Tax est. 1.5%
- −$52 /mo · $630/yr
- Insurance
- −$18
- HOA
- −$0
- Vacancy / Maint / Mgmt
- −$354
- Net cashflow
- $1,042
Break-even live
UW: 25.0% down · 7.5% · 30yr · 1.5% tax · 5.0% vac · 8.0% maint · 8.0% mgmt
Financing live
Cash to close
- Down payment
- $10,500
- Closing costs
- $1,260
- Reserves months
- —
- Total cash needed
- —
Loan-product check · same deal, 3 products live
Conventional
25% down · 7.5% · 30yr
- Down + closing
- —
- Monthly P&I
- —
- Monthly cashflow
- —
- DSCR
- —
- Eligible?
- —
Personal DTI + credit; lowest rate.
DSCR
20% down · 8.5% · 30yr
- Down + closing
- —
- Monthly P&I
- —
- Monthly cashflow
- —
- DSCR
- —
- Eligible?
- —
No personal income docs; deal must DSCR.
Hard money
10% down · 12.0% · 12mo
- Down + closing
- —
- Monthly P&I
- —
- Monthly cashflow
- —
- DSCR
- —
- Eligible?
- —
Short-term bridge; refi at stabilization.
Rent comps 8 comps
| Address | Beds | Baths | Sqft | Rent | $/sqft | DOM | Units | Dist |
|---|---|---|---|---|---|---|---|---|
| 107 Shoup St #2 Pittsburgh, PA | 2.0 | 1.0 | 2064 | $2,000 | $0.97 | 43d | 1 | 0.90mi |
| 1304 Firth St Pittsburgh, PA | 3.0 | 1.0 | 1893 | $2,399 | $1.27 | 17d | 1 | 1.05mi |
| 4107 Willow St Pittsburgh, PA | 2.0 | 1.0–2.0 | 917 | $3,334 | $3.63 | 1d | 28 | 1.29mi |
| 147 39th St Pittsburgh, PA | 3.0 | 1.0–2.0 | 934 | $2,728 | $2.92 | 1d | 44 | 1.30mi |
| 2939 Smallman St Pittsburgh, PA | 3.0 | 1.0–2.0 | 919 | $3,687 | $4.01 | 1d | 53 | 1.42mi |
| 3725 Butler St Pittsburgh, PA | 2.0 | 2.0 | 1236 | $3,899 | $3.15 | 14d | 1 | 1.42mi |
| 2926 Smallman St Pittsburgh, PA | 3.0 | 1.0–2.0 | 871 | $3,650 | $4.19 | 14d | 52 | 1.45mi |
| 2930 Smallman St Pittsburgh, PA | 3.0 | 1.0–2.0 | 872 | $3,650 | $4.18 | 7d | 56 | 1.45mi |
Listing history 20 events
-
2026-06-18days on market $42,000 Active 181 DOM
-
2026-06-17price $42,000 Active 180 DOM
-
2026-06-17days on market $50,000 Active 180 DOM
-
2026-06-16days on market $50,000 Active 179 DOM
-
2026-06-15days on market $50,000 Active 178 DOM
-
2026-06-13days on market $50,000 Active 176 DOM
-
2026-06-13days on market $50,000 Active 175 DOM
-
2026-06-09days on market $50,000 Active 172 DOM
-
2026-06-08days on market $50,000 Active 171 DOM
-
2026-06-07days on market $50,000 Active 170 DOM
-
2026-06-03days on market $50,000 Active 166 DOM
-
2026-06-02days on market $50,000 Active 165 DOM
-
2026-06-01days on market $50,000 Active 164 DOM
-
2026-05-31days on market $50,000 Active 163 DOM
-
2025-12-19$50,000 Active 173-char remark
Show marketing remark (173 chars)
Solid, brick ranch featuring 3 bedrooms, 1 bathroom and 1,614 square feet. The property has a main level bedroom and bathroom and off-street parking and is being sold as-is.
-
2024-11-06price $63,900 412-char remark
Show marketing remark (412 chars)
Explorer the possibilities with this three bedroom brick home in Reserve Township in the Shaler school district. A lot of the hard work has been done for you already and now all you have to do is put in the design you want. Nestled on a peaceful street, this cozy hideaway offers the perfect blend of city excitement and serene relaxation, making it the ideal getaway after a long day. Property being sold as-is.
-
2024-10-18price $68,900 412-char remark
Show marketing remark (412 chars)
Explorer the possibilities with this three bedroom brick home in Reserve Township in the Shaler school district. A lot of the hard work has been done for you already and now all you have to do is put in the design you want. Nestled on a peaceful street, this cozy hideaway offers the perfect blend of city excitement and serene relaxation, making it the ideal getaway after a long day. Property being sold as-is.
-
2024-09-09$69,900 Active 412-char remark
Show marketing remark (412 chars)
Explorer the possibilities with this three bedroom brick home in Reserve Township in the Shaler school district. A lot of the hard work has been done for you already and now all you have to do is put in the design you want. Nestled on a peaceful street, this cozy hideaway offers the perfect blend of city excitement and serene relaxation, making it the ideal getaway after a long day. Property being sold as-is.
-
1998-12-02soldstatus $22,000
-
1993-11-23soldstatus $26,000
ⓘ Source: listings_history table (triggers on properties + properties_extension) + one-shot
backfill from property_details.listing_events for pre-trigger history.
Climate risk First Street
- Flood 1/10 Low FEMA zone X (unshaded) · 0% chance over 30 yrs
- Wildfire 1/10 Low
- Heat 3/10 Moderate 7 d/yr ≥98°F today · 17 d/yr by 30 yrs out
- Wind 2/10 Low 0% chance of damaging wind over 30 yrs
- Air quality 4/10 Moderate 4 unhealthy d/yr today · 5 by 30 yrs out
Nearby sold comps map
Loading sold comps map…
Walkable amenities ~0.75 mi
Loading nearby amenities…
Taxation est. · year 1
- Rental income
- $20,238
- − Mortgage interest
- −$2,353
- − Property taxes
- −$630
- − Insurance
- −$210
- − Repairs & maintenance
- −$1,619
- − Management
- −$1,619
- − Depreciation
- −$1,222
- Taxable income
- $12,586
- Est. tax owed @ 24.0%
- −$3,021
- After-tax cash flow
- $9,485/yr
For passive investors: Depreciation is non-cash, so a rental often shows a tax loss while cash-flowing — sheltering income. Rental losses are passive: they offset passive income freely, and up to $25,000/yr can offset ordinary (W-2) income if you actively participate and your MAGI is under $100k (phasing out to $0 by $150k); unused losses carry forward. On sale, claimed depreciation is recaptured at up to 25%, and gains may owe capital-gains tax (a 1031 exchange can defer both). Figures are a year-1 estimate at your 24.0% rate — not tax advice; consult a CPA.
Schools (NCES district)
- District
- Shaler Area SD
- NCES district ID
- 4221200
- Math proficiency
- 36% ▼ -16.00%
- Reading proficiency
- 59% ▼ -15.00%
- Median HH income
- $57,411
- Composite
- 41.33/100
- National rank
- #3506
- State rank
- #208 of 539 in PA
Livability — Reserve
No livability data for this city. (Only ~50 U.S. cities are tracked.)
Census & demographics
- County
- Allegheny County · 1,022,028 people
- Metro
- Pittsburgh, PA
- Population (ZIP)
- 27,652
- Household income
- $64,077
- Rent vs Own
- Severe rent burden
- 1584.0
Population outlook (Allegheny County) Hauer SSP2
- Today (2025)
- 1,250,282 people
- By 2030
- 1,256,482 · +0.5%
- By 2040
- 1,256,318 · +0.5%
- By 2050
- 1,244,169 · -0.5%
- By 2075
- 1,197,693 · -4.2%
- By 2100
- 1,093,187 · -12.6%
Race, ethnicity, and origin ACS 2023
- Neighborhood character
- Diverse neighborhood (Simpson 0.56)
- Race & ethnicity
- White 62% Black 25% Two or more races 7% Hispanic / Latino 4% Asian 2%
- Common ancestry
- Romanian 6% Lithuanian 3% Serbian 1%
- Foreign-born
- 5% · Canada
- Languages at home
- 94% English-only · Spanish 3% Other Indo-European 1% Arabic 1%
Political lean MEDSL · Allegheny
- 2024 margin
- Strong D (+20.3) · D 59.7% · R 39.4%
- 2008→2024 swing
- +4.8pp toward D · 2008: 15.5pp · 2024: 20.3pp
- All cycles
- 2024: D+20.3 2020: D+20.4 2016: D+16.4 2012: D+14.4 2008: D+15.5
Not yet ingested
- Civics
- —
Market trends
- HPI YoY
- ▼ -120.40%
- Current HPI
- 260.4262
- Rent YoY
- ▲ 4.01%
- Metro
- Pittsburgh, PA
- State GDP YoY
- ▲ 1.68%
- F500 in state
- 34
Industry mix (Fortune 500 HQ in PA)
| Industry | F500 HQs | Revenue |
|---|---|---|
| Healthcare | 2 | $309B |
|
||
| Insurance | 2 | $27B |
|
||
| Telecommunications / Media | 1 | $124B |
|
||
| Industrial Distribution | 1 | $22B |
|
||
| Financial Services | 1 | $20B |
|
||
| Chemicals / Materials | 1 | $18B |
|
||
Price history
+92.3% since first listed6 events — show timeline
- 2025-12-19 Listed $50,000 West Penn MLS
- 2024-11-06 Price Changed $63,900 West Penn MLS
- 2024-10-18 Price Changed $68,900 West Penn MLS
- 2024-09-09 Listed $69,900 West Penn MLS
- 1998-12-02 Sold (Public Records) $22,000 Public Records
- 1993-11-23 Sold (Public Records) $26,000 Public Records
Property tax history
+2.3%/yrLatest (2026): $4,042 · +0.0% YoY. Source: county tax records.
Cash-flow waterfall
monthlySold comps — $/sqft
last 12 mo · ≤1 miLoading sold comps…