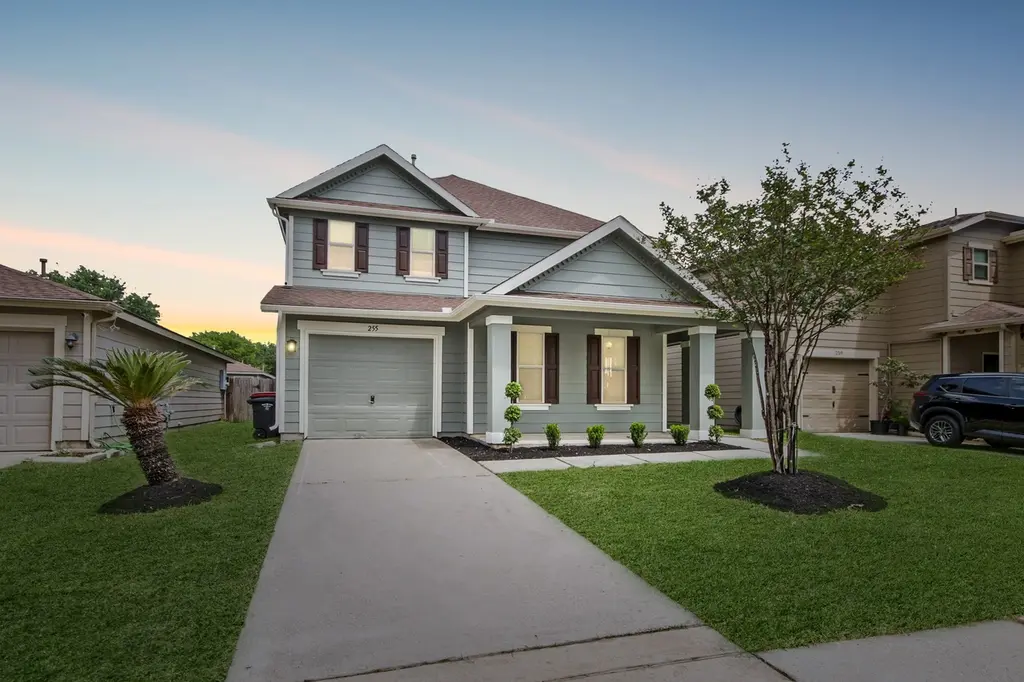
255 Silky Leaf Dr · Houston, TX
Flood risk 1/10 · Minimal
- FEMA flood zone
- X (unshaded)
- Chance of flooding over 30 yrs
- 0.0%
- Est. flood insurance / yr
- $507 – $1,088
Fire risk 1/10 · Minimal
- Est. fire insurance / yr
- $1,222 – $2,270
Heat risk 9/10 · Severe
- Hot days now (above 110°F)
- 7 days/yr
- Hot days in 30 yrs
- 24 days/yr
Wind risk 9/10 · Severe
- Chance of severe wind over 30 yrs
- 99.0%
Air-quality risk 3/10 · Minor
- Unhealthy air days now
- 3 days/yr
- Unhealthy air days in 30 yrs
- 3 days/yr
Risk factors via First Street. Map © Google.
Why this score? — see what drove the D- grade
The composite is a weighted blend of 9 inputs, each scored 0–100. Each bar is that input's sub-score; the figure is the points it added to the 100-point composite (weight × sub-score).
- ARV discount +9.9/15.0
- Cash flow +7.7/30.0
- Appreciation +4.7/10.0
- 1% rule +3.9/10.0
- Livability +3.7/5.0
- Rent growth +2.7/5.0
- Condition / age +2.5/5.0
- Schools +2.0/10.0
- DSCR +1.8/10.0
$230,000
🖨 Deal sheet 📄 Offer letter ✓ Due diligence
Listing remarks
Welcome home! This charming property offers 2,193 sqft of living space with 4 bedrooms, 2.5 baths, and a versatile upstairs flex room. The home features a single-car garage with an extended driveway. Inside, enjoy wood flooring, a stylish dining area with pendant lighting, and seamless access to the kitchen—perfect for entertaining. The kitchen boasts granite countertops, stainless steel appliances, recessed lighting, and ample cabinetry with a pantry. The cozy living room is filled with natural light and backyard views. The spacious primary suite includes a ceiling fan, large windows, and a private bath with wood cabinetry, sleek countertops, and a shower/tub combo. Upstairs offers a
Key facts
- Upstairs flex room
- Wood flooring
- Single-car garage
Tags
Property features AI
Finance
- HOA & community: Homeowners association (annual fee $550); Community features include curbs
Exterior
- Parking: Attached garage (1 space); Driveway
- Utilities: Public water; Public sewer
- Home design: Residential property; Faces south; Built in 2007; Slab foundation
- Construction: Composition roof
- Exterior features: Covered patio; Deck; Patio; Fence (back yard); Private yard; Backs to greenbelt/park; Concrete road surface
Interior
- Kitchen: Dishwasher; Gas cooktop; Gas oven; Oven; Microwave; Disposal
- Bedrooms: Primary bedroom on first floor (14x13); Three additional bedrooms on second floor (12x13, 12x15, 12x13)
- Flooring: Carpet; Tile; Wood
- Bathrooms: Two full bathrooms; One half bathroom
- Heating & cooling: Central heating (gas); Central air conditioning (electric)
- Interior features: Granite counters; Primary bathroom; Pots & pan drawers; Tub with shower; Ceiling fans; Kitchen/dining combo; Open living/dining area
- Laundry & utility: Washer hookup; Electric dryer hookup; Utility room (second floor, 7x6)
Neighborhood map
What this means for you Summary
Snapshot
- This is a 4-bed/2.5-bath single-family listed at $230k.
Deal economics
- At list price, monthly cash flow is $-263 ($-3k/yr) — negative.
- To cash-flow at today's rent, offer at most $184k (20.2% below list).
- To meet the 1% rule (rent ≥ 1% of price), the offer needs to be $204k (11.1% below list).
- Recommended offer: $184k (20.2% below list) — sets the bar for cash-flow.
- Cap rate 4.9% vs local median 3.2% in Houston — top-decile yield for the area; either an underpriced asset or a hidden risk that comps aren't pricing in. Stress-test before assuming the spread holds.
Location & tenants
- Location reads 74/100 on livability (#184 in TX, #4,771 nationally) — a middle-class / working-renter tenant base. Strengths: amenities A+, cost of living A+, housing A+; Watch: crime F.
- Spring ISD (suburban): math 19% / reading 26% proficiency, ranked #730 of 826 in TX (top 88%) — low school quality limits family demand, transient renter base, plan for 1-2y turnover; 66% free/reduced lunch — lower-income household profile, screen leases tightly.
- Zoned schools: Milton Cooper El (math 25% / reading 24%, grade F, #3,052 of 4,322 statewide, top 74%, 660 students, 88% FRL); Dueitt Middle (math 12% / reading 23%, grade F, #1,507 of 1,662 statewide, top 91%, 773 students, 84% FRL); Andy Dekaney H S (math 5% / reading 13%, grade F, #1,599 of 1,632 statewide, top 98%, 2,401 students, 82% FRL) — zoned schools average 85% FRL vs 66% district-wide (18 pts higher); higher-poverty schools than district average — tighter screening recommended.
- Market conditions: Rents flat; 159 active listings in the ZIP; 4 comparable units currently listed for rent nearby; rentals at typical pace (median 22d on market — plan ~3-4 weeks tenant-placement turnaround); solid renter incomes; 29,883 units permitted in Harris County in 2024 (8,621 in 5+ unit buildings).
- This rent runs 31% of the median local income ($79k/yr) — at the standard rent-burdened threshold; future hikes will face affordability resistance.
Forward outlook
- In year one you build about $31 of equity ($2k loan paydown + $-2k appreciation (-0.7% local appreciation)).
- Harris County population projected at +47% by 2050 — long-run rental-demand tailwind backs the buy-and-hold thesis.
Negotiation context
- Only 13 days on market — expect competitive offers; lowballing is unlikely to land.
- 2 sale attempts with the ask held roughly flat each time — persistent listings suggest the price (not the market) is what's stuck; bring a comps-based counter.
Risks & watch-outs
- Watch-outs: property tax is 2.8% of price.
- Climate carrying-cost: severe wind risk, 99% chance of damaging wind over 30y; extreme-heat days projected 7→24/yr by 2055 (HVAC capex compounding) — expect insurance premiums to compound above CPI over the hold.
Questions for the listing agent
- What do current leases actually rent for vs. the listed asking? Can we see a recent rent roll and the last 12 months of T-12 income?
- Property tax is high relative to price — has the assessment been appealed recently, and will the sale trigger a re-assessment?
- What does the HOA fee cover, when was the last increase, and are there any pending special assessments or reserve-fund shortfalls?
- Is there a deadline driving the sale (1031 exchange, divorce, estate, relocation)? That informs how much negotiation room exists.
- Schools are D-rated, which usually means shorter tenancies and higher turnover. Who's the typical renter profile here, and what's been the actual vacancy rate?
- Crime grade is F in this area — have there been break-ins, vandalism, or insurance claims at this property in the last 3 years? What carrier currently insures it and at what premium?
- The area grade is low — what's the realistic commute time and amenity access for the typical tenant pool here? Any planned neighborhood developments (good or bad) we should know about?
- What's the average days-on-market for RENTAL listings here right now (not sales)? A rising rental-DOM trend means longer vacancies and softer asking-rent achievability than the comps imply.
- What's the recent tenant-quality profile in this submarket — average credit score on applications, eviction rate, late-payment / NSF rate, and stable-employment percentage? A property-management company in the area should have these aggregated.
- How much new for-sale + rental construction is in the pipeline within 1–3 miles? Heavy new supply typically softens prices + rents 12–24 months out; constrained supply supports both.
Investment metrics
- 1% rule
- 0.89% ✗
- Cap rate
- 4.92%
- Cash-on-cash
- -4.90%
- DSCR
- 0.78
- GRM
- 9.4
CMA / ARV
- ARV (median comp)
- $242,845
- List price
- $230,000
- Delta
- -1.17%
- Verdict
- FAIR
- Comps
- 20 within 2.0 mi
Show comp detail 12 sales within ~0.75 mi
| Address | Dist | Beds/Ba | Sqft | Sold | Price | $/sf | Match |
|---|---|---|---|---|---|---|---|
| 19135 Remington Bend Dr | 0.09mi | 3/2.5 (-1) | 2,252 (+3%) | 11mo | $240,000 | $107 | 78 |
| 414 Remington Ridge Dr | 0.17mi | 3/2.5 (-1) | 2,096 (-4%) | 11mo | $199,900 | $95 | 70 |
| 19514 Fletcher Way Dr | 0.61mi | 4/2.5 | 2,200 (+0%) | 3mo | $240,000 | $109 | 68 |
| 19114 Siril Dr | 0.17mi | 5/3.0 (+1) | 2,449 (+12%) | 1mo | $220,000 | $90 | 65 |
| 19102 Siril Dr | 0.18mi | 5/3.0 (+1) | 2,458 (+12%) | 1mo | $210,000 | $85 | 64 |
| 511 Remington Chase Ct | 0.40mi | 3/2.0 (-1) | 2,123 (-3%) | 8mo | $240,000 | $113 | 62 |
| 19010 Remington Springs Dr | 0.65mi | 3/2.5 (-1) | 2,166 (-1%) | 5mo | $230,000 | $106 | 58 |
| 802 Remington Walk Ct | 0.56mi | 3/2.5 (-1) | 2,052 (-6%) | 4mo | $239,900 | $117 | 55 |
| 18519 Prairie Larkspur Dr | 0.58mi | 3/2.5 (-1) | 1,992 (-9%) | 6mo | $230,000 | $115 | 48 |
| 930 Belshear Ct | 0.67mi | 3/2.5 (-1) | 1,980 (-10%) | 2mo | $229,999 | $116 | 46 |
| 802 NW Bandon Ln | 0.63mi | 3/2.5 (-1) | 1,915 (-13%) | 2mo | $229,900 | $120 | 43 |
| 806 Sun Lodge Dr | 0.74mi | 3/2.5 (-1) | 1,980 (-10%) | 8mo | $218,000 | $110 | 37 |
Match score weights: distance 35% · size 25% · config 20% · recency 20%. Top-matched comps best support the ARV.
Projected returns pro-forma
-0.68% appreciation · 0.69% rent growth · sell at horizon
- IRR
- -12.6%
- Equity multiple
- 0.45×
- Total profit
- $-35,143
- Equity at exit
- $59,094
- IRR
- -8.2%
- Equity multiple
- 0.27×
- Total profit
- $-47,266
- Equity at exit
- $65,154
Cash invested: $64,400 (down + closing). Projections, not guarantees.
Landlord ↔ Tenant lean methodology
- Overall (STATE)
- 87 Strongly Landlord-Friendly
- State Texas
- 87 Strongly Landlord-Friendly · R+5
- County
- — inherits STATE
- City
- — inherits STATE
ZIP-level market 77073
- Home prices YoY
- -0.3%
- Rents YoY
- 0.7%
- Active inventory
- 159
- Price-to-rent
- 9.4×
Monthly cashflow live
- Estimated rent
- $2,044 medium interval (Pro) →
- Mortgage (P&I)
- −$1,206
- Tax from tax record
- −$530 /mo · $6,358/yr
- Insurance
- −$96
- HOA
- −$46
- Vacancy / Maint / Mgmt
- −$429
- Net cashflow
- $-263
Break-even live
UW: 25.0% down · 7.5% · 30yr · 1.5% tax · 5.0% vac · 8.0% maint · 8.0% mgmt
Financing live
Cash to close
- Down payment
- $57,500
- Closing costs
- $6,900
- Reserves months
- —
- Total cash needed
- —
Loan-product check · same deal, 3 products live
Conventional
25% down · 7.5% · 30yr
- Down + closing
- —
- Monthly P&I
- —
- Monthly cashflow
- —
- DSCR
- —
- Eligible?
- —
Personal DTI + credit; lowest rate.
DSCR
20% down · 8.5% · 30yr
- Down + closing
- —
- Monthly P&I
- —
- Monthly cashflow
- —
- DSCR
- —
- Eligible?
- —
No personal income docs; deal must DSCR.
Hard money
10% down · 12.0% · 12mo
- Down + closing
- —
- Monthly P&I
- —
- Monthly cashflow
- —
- DSCR
- —
- Eligible?
- —
Short-term bridge; refi at stabilization.
Rent comps 4 comps
| Address | Beds | Baths | Sqft | Rent | $/sqft | DOM | Units | Dist |
|---|---|---|---|---|---|---|---|---|
| 1418 Spencer Glen Ln Houston, TX | 3.0 | 2.0 | 1540 | $1,900 | $1.23 | 17d | 1 | 1.06mi |
| 19959 Oland Way Houston, TX | 3.0 | 2.0 | 2005 | $1,800 | $0.90 | 24d | 1 | 1.13mi |
| 920 Century Plaza Dr Houston, TX | 3.0–4.0 | 2.0 | 1298 | $1,799 | $1.39 | 2d | 1 | 1.14mi |
| 1514 Glasholm Dr Houston, TX | 3.0 | 2.0 | 1400 | $1,300 | $0.93 | 22d | 1 | 1.25mi |
HOA detail
- Monthly dues
- $46 · $552/yr
Listing history 17 events
-
2026-06-18days on market $230,000 Active 13 DOM
-
2026-06-17days on market $230,000 Active 12 DOM
-
2026-06-16days on market $230,000 Active 11 DOM
-
2026-06-15days on market $230,000 Active 10 DOM
-
2026-06-13days on market $230,000 Active 8 DOM
-
2026-06-13days on market $230,000 Active 7 DOM
-
2026-06-09days on market $230,000 Active 4 DOM
-
2026-06-08days on market $230,000 Active 3 DOM
-
2026-06-07pricedays on market $230,000 Active 2 DOM
-
2026-06-04days on market $240,000 Active 58 DOM
-
2026-06-03days on market $240,000 Active 57 DOM
-
2026-06-02days on market $240,000 Active 56 DOM
-
2026-06-01days on market $240,000 Active 55 DOM
-
2026-05-31days on market $240,000 Active 54 DOM
-
2026-04-11price $250,000 921-char remark
-
2026-04-07$295,000 Active 921-char remark
-
2026-02-27soldstatus
ⓘ Source: listings_history table (triggers on properties + properties_extension) + one-shot
backfill from property_details.listing_events for pre-trigger history.
Tax reassessment forecast TX · Resets to sale price
- Current annual tax
- $6,358 · $530/mo
- Projected year-2 tax
- $6,358 · $530/mo
- Expected delta
- $0/yr ($0/mo · 0.0%)
ⓘ Screening estimate from a state-policy table — verify with the county assessor before closing.
Climate risk First Street
- Flood 1/10 Low FEMA zone X (unshaded) · 0% chance over 30 yrs
- Wildfire 1/10 Low
- Heat 9/10 Extreme 7 d/yr ≥110°F today · 24 d/yr by 30 yrs out
- Wind 9/10 Extreme 99% chance of damaging wind over 30 yrs
- Air quality 3/10 Moderate 3 unhealthy d/yr today · 3 by 30 yrs out
Nearby sold comps map
Loading sold comps map…
Walkable amenities ~0.75 mi
Loading nearby amenities…
Taxation est. · year 1
- Rental income
- $24,530
- − Mortgage interest
- −$12,884
- − Property taxes
- −$6,358
- − Insurance
- −$1,150
- − Repairs & maintenance
- −$1,962
- − Management
- −$1,962
- − HOA
- −$552
- − Depreciation
- −$6,691
- Taxable loss
- −$7,030
- Est. tax savings @ 24.0%
- +$1,687
- After-tax cash flow
- $-1,468/yr
For passive investors: Depreciation is non-cash, so a rental often shows a tax loss while cash-flowing — sheltering income. Rental losses are passive: they offset passive income freely, and up to $25,000/yr can offset ordinary (W-2) income if you actively participate and your MAGI is under $100k (phasing out to $0 by $150k); unused losses carry forward. On sale, claimed depreciation is recaptured at up to 25%, and gains may owe capital-gains tax (a 1031 exchange can defer both). Figures are a year-1 estimate at your 24.0% rate — not tax advice; consult a CPA.
Schools (NCES district)
- District
- Spring ISD
- NCES district ID
- 4841220
- Math proficiency
- 19% ▼ -13.00%
- Reading proficiency
- 26% ▼ -6.00%
- Median HH income
- $51,584
- Composite
- 20.12/100
- National rank
- #8643
- State rank
- #730 of 826 in TX
Livability — Houston
- Score
- 74/100
- State rank
- #184
- US rank
- #4771
Category grades
Schools grade is shown separately in the Schools card above.
Census & demographics
- County
- Harris County · 4,702,590 people
- City population
- 3,226,434
- Metro
- Houston-The Woodlands-Sugar Land, TX
- Population (ZIP)
- 46,084
- Household income
- $78,592
- Rent vs Own
- Severe rent burden
- 1297.0
Population outlook (Harris County) Hauer SSP2
- Today (2025)
- 5,571,493 people
- By 2030
- 6,089,821 · +9.3%
- By 2040
- 7,142,806 · +28.2%
- By 2050
- 8,185,864 · +46.9%
- By 2075
- 10,574,329 · +89.8%
- By 2100
- 12,109,958 · +117.4%
Race, ethnicity, and origin ACS 2023
- Neighborhood character
- Diverse neighborhood (Simpson 0.57)
- Race & ethnicity
- Hispanic / Latino 59% Black 27% Two or more races 24% White 9% Native American 2% Asian 2%
- Hispanic origin (detail)
- Mexican 38% Cuban 2%
- Common ancestry
- Lithuanian 1%
- Foreign-born
- 29% · Canada, Jamaica
- Languages at home
- 44% English-only · Spanish 53% French/Haitian/Cajun 2% Other Indo-European 1%
Political lean MEDSL · Harris
- 2024 margin
- Lean D (+5.5) · D 52.0% · R 46.4% · Other 1.6%
- 2008→2024 swing
- +3.9pp toward D · 2008: 1.6pp · 2024: 5.5pp
- All cycles
- 2024: D+5.5 2020: D+13.3 2016: D+12.4 2012: D+0.1 2008: D+1.6
Not yet ingested
- Civics
- —
Market trends
- HPI YoY
- ▼ -0.68%
- Current HPI
- 215.8688
- Rent YoY
- ▲ 0.69%
- Metro
- Houston-The Woodlands-Sugar Land, TX
- State GDP YoY
- ▲ 3.95%
- F500 in state
- 110
Industry mix (Fortune 500 HQ in TX)
| Industry | F500 HQs | Revenue |
|---|---|---|
| Energy | 16 | $1,198B |
|
||
| Technology | 5 | $198B |
|
||
| Engineering / Construction | 4 | $72B |
|
||
| Energy Services | 3 | $60B |
|
||
| Utilities | 3 | $41B |
|
||
| Healthcare | 2 | $330B |
|
||
Price history
-22.0% since first listed6 events — show timeline
- 2026-06-05 Listed $230,000 HARMLS
- 2026-06-05 Listing Removed — HARMLS
- 2026-05-19 Price Changed $240,000 HARMLS
- 2026-04-11 Price Changed $250,000 HARMLS
- 2026-04-07 Listed $295,000 HARMLS
- 2026-02-27 Sold (Public Records) — Public Records
Property tax history
+5.9%/yrLatest (2025): $6,358 · +11.8% YoY. Source: county tax records.
Cash-flow waterfall
monthlySold comps — $/sqft
last 12 mo · ≤1 miLoading sold comps…