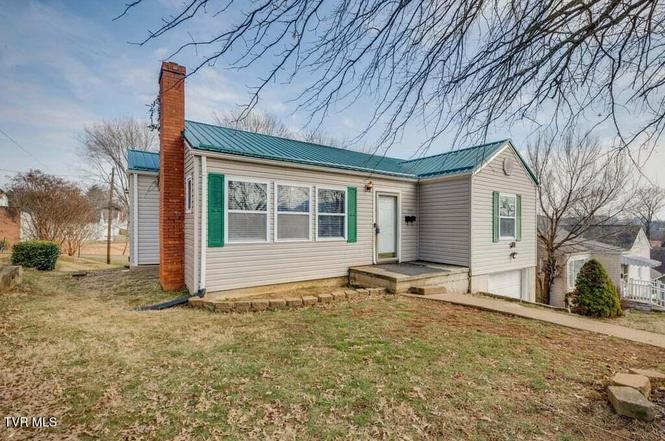
529 Fulton Ave Ave · Kingsport, TN
Flood risk 1/10 · Minimal
- FEMA flood zone
- X (unshaded)
- Chance of flooding over 30 yrs
- 0.0%
- Est. flood insurance / yr
- $473 – $860
Fire risk 3/10 · Minor
- Est. fire insurance / yr
- $949 – $1,763
Heat risk 5/10 · Moderate
- Hot days now (above 101°F)
- 7 days/yr
- Hot days in 30 yrs
- 22 days/yr
Wind risk 2/10 · Minimal
- Chance of severe wind over 30 yrs
- —
Air-quality risk 1/10 · Minimal
- Unhealthy air days now
- 0 days/yr
- Unhealthy air days in 30 yrs
- 0 days/yr
Risk factors via First Street. Map © Google.
Why this score? — see what drove the C grade
The composite is a weighted blend of 9 inputs, each scored 0–100. Each bar is that input's sub-score; the figure is the points it added to the 100-point composite (weight × sub-score).
- Cash flow +18.7/30.0
- ARV discount +15.0/15.0
- DSCR +5.9/10.0
- Rent growth +4.5/5.0
- 1% rule +3.9/10.0
- Livability +3.6/5.0
- Schools +3.0/10.0
- Condition / age +2.5/5.0
- Appreciation +0.0/10.0
$195,000
🖨 Deal sheet (PDF) 📄 Offer letter ✓ Due diligence
Listing remarks
Motivated Sellers- Great opportunity In Kingsport! Welcome to 529 Fulton Avenue, Kingsport, TN 37660! Pictures coming 2-6-2026. A well cared for energy efficient home with major updates already completed. Features include a nearly new HVAC system (approx. 1 year old), roof approx. 2 years old, new attic insulation, updated ceiling and new electrical wiring in the attic. windows are approx 10 years old, helping keep the winter electric bill around $140. Additional highlights include new paint, new walls, gas logs, plumbing in place for an upstairs stackable washer/dryer. It is listed as a 2bd/1bath. But all plumbing has been done to easily put a second bathroom downstairs and finish out to h
Key facts
- Updated ceiling
- New paint
- New attic insulation
Tags
Property features AI
Exterior
- Parking: Attached garage (1 car); Driveway (concrete)
- Security: Smoke detector(s)
- Utilities: Public water
- Home design: Single family residence (house); Level and rolling slope topography; Zoned R 1C
- Construction: Frame construction with vinyl siding; Metal roof; Below-grade finished area present (340); Built as a house
- Exterior features: Balcony; Storm door(s)
Interior
- Kitchen: Range; Refrigerator
- Bedrooms: Total of 5 rooms (bedroom count not specified)
- Bathrooms: 1 full bathroom
- Heating & cooling: Central heating; Fireplace heating option; Central air; Heat pump; Ceiling fans
- Interior features: Double pane windows; Fireplace (1); Range; Refrigerator
- Laundry & utility: Washer hookup; Electric dryer hookup
Neighborhood map
What this means for you Summary
Snapshot
- This is a 2-bed/1.0-bath single-family listed at $195k.
Deal economics
- At list price, monthly cash flow is $194 ($2k/yr) — positive.
- The deal already cash-flows at list — no discount required.
- To meet the 1% rule (rent ≥ 1% of price), the offer needs to be $173k (11.4% below list).
- Recommended offer: $172k (12.0% below list) — sets the bar for market timing.
- Cap rate 7.5% vs local median 3.8% in Kingsport — top-decile yield for the area; either an underpriced asset or a hidden risk that comps aren't pricing in. Stress-test before assuming the spread holds.
Location & tenants
- Location reads 71/100 on livability (#39 in TN) — a middle-class / working-renter tenant base. Strengths: cost of living A+, health & safety A+, housing A; Watch: amenities C-, crime F, commute F.
- Kingsport (urban): math 35% / reading 38% proficiency, ranked #26 of 139 in TN (top 19%) — families likely to look elsewhere, expect single-tenant / working-renter base with shorter leases.
- Zoned schools: Andrew Jackson Elementary School (math 27% / reading 23%, grade F, #541 of 952 statewide, top 57%, 496 students, 0% FRL); John Sevier Middle School (math 21% / reading 24%, grade F, #172 of 333 statewide, top 52%, 750 students, 0% FRL); Dobyns - Bennett High School (math 23% / reading 56%, grade F, #28 of 332 statewide, top 9%, 2,514 students, 0% FRL) — zoned schools average 0% FRL vs 47% district-wide (47 pts lower); this property's tenant base skews higher-income than the district average.
- Market conditions: Rents rising fast (+8.0%/yr); 240 active listings in the ZIP; 12 comparable units currently listed for rent nearby; rentals at typical pace (median 23d on market — plan ~3-4 weeks tenant-placement turnaround); 453 units permitted in Sullivan County in 2024 (6 in 5+ unit buildings).
- This rent runs 42% of the median local income ($49k/yr) — at the standard rent-burdened threshold; future hikes will face affordability resistance.
Forward outlook
- Local home prices are declining (-3.0%/yr); year-one equity from $1k of loan paydown is wiped out by about $6k of value loss. Plan a longer hold.
- Sullivan County population projected to shrink 5% by 2050 — rents likely to lag national; underwrite the cash flow, not the appreciation.
- At projected returns (-3.0% appreciation + 8.0% rent growth), your $55k cash investment doubles in ~10 years — after that, you're playing with house money.
Negotiation context
- It's been on market 142 days — a 12% lower offer ($172k) is reasonable based on typical stale-listing flexibility.
- Current owner paid $72k; list at $195k implies a 169% gain — meaningful room to come down on a strong offer.
Risks & watch-outs
- Watch-outs: built in 1951 — expect roof / HVAC / electrical / plumbing capex.
- Climate carrying-cost: extreme-heat days projected 7→22/yr by 2055 (HVAC capex compounding) — expect insurance premiums to compound above CPI over the hold.
Questions for the listing agent
- It's been on market 142 days. Have you received any prior offers? Is the seller open to a 12% concession, seller financing, or rate buy-down credit?
- Built in 1951 — when were the roof, HVAC, electrical panel, plumbing, and water heater last replaced?
- Why hasn't it sold? Are there any deal-killer items the seller is aware of (foundation, flood, title, zoning, code violations)?
- Is there a deadline driving the sale (1031 exchange, divorce, estate, relocation)? That informs how much negotiation room exists.
- Schools are D-rated, which usually means shorter tenancies and higher turnover. Who's the typical renter profile here, and what's been the actual vacancy rate?
- Crime grade is F in this area — have there been break-ins, vandalism, or insurance claims at this property in the last 3 years? What carrier currently insures it and at what premium?
- What's the average days-on-market for RENTAL listings here right now (not sales)? A rising rental-DOM trend means longer vacancies and softer asking-rent achievability than the comps imply.
- What's the recent tenant-quality profile in this submarket — average credit score on applications, eviction rate, late-payment / NSF rate, and stable-employment percentage? A property-management company in the area should have these aggregated.
- How much new for-sale + rental construction is in the pipeline within 1–3 miles? Heavy new supply typically softens prices + rents 12–24 months out; constrained supply supports both.
Investment metrics
- 1% rule
- 0.89% ✗
- Cap rate
- 7.49%
- Cash-on-cash
- 4.26%
- DSCR
- 1.19
- GRM
- 9.4
CMA / ARV
- ARV (on-the-fly)
- $238,224
- Comps found
- 12
Show comp detail 12 sales within ~0.75 mi
| Address | Dist | Beds/Ba | Sqft | Sold | Price | $/sf | Match |
|---|---|---|---|---|---|---|---|
| 533 Bellvue Ave | 0.06mi | 2/2.0 | 1,624 (+14%) | 0mo | $160,000 | $99 | 69 |
| 830 Fairview Ave | 0.33mi | 3/2.0 (+1) | 1,484 (+5%) | 3mo | $235,000 | $158 | 65 |
| 1313 Putnam St | 0.11mi | 3/1.5 (+1) | 1,551 (+9%) | 12mo | $219,000 | $141 | 62 |
| 634 Riverside Ave | 0.27mi | 3/2.0 (+1) | 1,288 (-9%) | 2mo | $217,000 | $168 | 61 |
| 817 Mimosa Dr | 0.31mi | 3/2.0 (+1) | 1,537 (+8%) | 3mo | $268,000 | $174 | 60 |
| 562 Lovedale Dr | 0.64mi | 3/1.0 (+1) | 1,437 (+1%) | 5mo | $162,000 | $113 | 59 |
| 545 Bays View Rd | 0.65mi | 3/1.5 (+1) | 1,443 (+2%) | 3mo | $276,000 | $191 | 58 |
| 1413 Gress Mag Mtn | 0.52mi | 3/2.0 (+1) | 1,318 (-7%) | 2mo | $290,000 | $220 | 54 |
| 1016 Whippoorwill Ln | 0.47mi | 3/2.0 (+1) | 1,527 (+8%) | 4mo | $223,900 | $147 | 53 |
| 1024 Walnut Ave | 0.47mi | 3/2.0 (+1) | 1,286 (-9%) | 9mo | $240,000 | $187 | 46 |
| 557 Jackson St | 0.61mi | 3/1.5 (+1) | 1,234 (-13%) | 3mo | $234,900 | $190 | 40 |
| 414 Sullivan St | 0.68mi | 3/2.0 (+1) | 1,608 (+13%) | 2mo | $200,000 | $124 | 36 |
Match score weights: distance 35% · size 25% · config 20% · recency 20%. Top-matched comps best support the ARV.
Projected returns pro-forma
-3.0% appreciation · 7.95% rent growth · sell at horizon
- IRR
- -4.8%
- Equity multiple
- 0.81×
- Total profit
- $-10,305
- Equity at exit
- $29,075
- IRR
- 9.4%
- Equity multiple
- 1.87×
- Total profit
- $47,661
- Equity at exit
- $16,860
Cash invested: $54,600 (down + closing). Projections, not guarantees.
Landlord ↔ Tenant lean methodology
- Overall (STATE)
- 87 Strongly Landlord-Friendly
- State Tennessee
- 87 Strongly Landlord-Friendly · R+13
- County
- — inherits STATE
- City
- — inherits STATE
ZIP-level market 37660
- Home prices YoY
- -24.2%
- Rents YoY
- 8.0%
- Active inventory
- 240
- Price-to-rent
- 9.4×
Monthly cashflow live
- Estimated rent
- $1,728 high interval (Pro) →
- Mortgage (P&I)
- −$1,023
- Tax from tax record
- −$67 /mo · $808/yr
- Insurance
- −$81
- HOA
- −$0
- Vacancy / Maint / Mgmt
- −$363
- Net cashflow
- $194
Break-even live
Sensitivity live
| Price | -10% $304 | -5% $249 | +0% $194 | +5% $139 | +10% $83 |
|---|---|---|---|---|---|
| Rent | -10% $57 | -5% $126 | +0% $194 | +5% $262 | +10% $330 |
| Rate | -1.0pp $292 | -0.5pp $243 | base $194 | +0.5pp $143 | +1.0pp $92 |
UW: 25.0% down · 7.5% · 30yr · 1.5% tax · 5.0% vac · 8.0% maint · 8.0% mgmt
Financing live
Cash to close
- Down payment
- $48,750
- Closing costs
- $5,850
- Reserves months
- —
- Total cash needed
- —
Loan-product check · same deal, 3 products live
Conventional
25% down · 7.5% · 30yr
- Down + closing
- —
- Monthly P&I
- —
- Monthly cashflow
- —
- DSCR
- —
- Eligible?
- —
Personal DTI + credit; lowest rate.
DSCR
20% down · 8.5% · 30yr
- Down + closing
- —
- Monthly P&I
- —
- Monthly cashflow
- —
- DSCR
- —
- Eligible?
- —
No personal income docs; deal must DSCR.
Hard money
10% down · 12.0% · 12mo
- Down + closing
- —
- Monthly P&I
- —
- Monthly cashflow
- —
- DSCR
- —
- Eligible?
- —
Short-term bridge; refi at stabilization.
Rent comps 12 comps
| Address | Beds | Baths | Sqft | Rent | $/sqft | DOM | Units | Dist |
|---|---|---|---|---|---|---|---|---|
| 455 W Sullivan St Kingsport, TN | 1.0–3.0 | 1.0–2.0 | 988 | $1,647 | $1.67 | 14d | 16 | 0.54mi |
| 206 Hammond Ave Kingsport, TN | 3.0 | 1.0 | 1696 | $1,525 | $0.90 | 22d | 1 | 0.56mi |
| 724 Teasel Dr Kingsport, TN | 1.0–2.0 | 1.0 | 927 | $999 | $1.08 | 22d | 1 | 0.85mi |
| 109 W Wanola Ave Kingsport, TN | 3.0 | 2.0 | 1600 | $2,300 | $1.44 | 14d | 1 | 0.91mi |
| 116 E Market St Unit 4 Kingsport, TN | 2.0 | 1.0 | 1090 | $1,395 | $1.28 | 22d | 1 | 0.95mi |
| 124 Bloomingdale Pike Kingsport, TN | 1.0–2.0 | 1.0–1.5 | 878 | $1,300 | $1.48 | 14d | 1 | 1.04mi |
| 453 E Main St #400 Kingsport, TN | 2.0 | 2.0 | 1292 | $2,220 | $1.72 | 22d | 1 | 1.19mi |
| 453 E Main St Kingsport, TN | 2.0 | 2.0 | 1350 | $2,875 | $2.13 | 22d | 1 | 1.19mi |
| 453 E Main St Unit 900 Kingsport, TN | 2.0 | 2.0 | 1247 | $2,240 | $1.80 | 22d | 1 | 1.19mi |
| 453 E Main St Unit 700 Kingsport, TN | 2.0 | 2.0 | 1292 | $2,252 | $1.74 | 22d | 1 | 1.19mi |
| 453 E Main St #300 Kingsport, TN | 2.0 | 2.0 | 1292 | $2,172 | $1.68 | 22d | 1 | 1.19mi |
| 1040 Tiptop Ave Kingsport, TN | 2.0–3.0 | 2.0 | 947 | $960 | $1.01 | 14d | 1 | 1.25mi |
Listing history 24 events
-
2026-06-21days on market $195,000 Active 142 DOM
-
2026-06-19days on market $195,000 Active 140 DOM
-
2026-06-18days on market $195,000 Active 139 DOM
-
2026-06-17days on market $195,000 Active 138 DOM
-
2026-06-16days on market $195,000 Active 137 DOM
-
2026-06-15days on market $195,000 Active 136 DOM
-
2026-06-14days on market $195,000 Active 134 DOM
-
2026-06-13days on market $195,000 Active 133 DOM
-
2026-06-10days on market $195,000 Active 131 DOM
-
2026-06-09days on market $195,000 Active 130 DOM
-
2026-06-08days on market $195,000 Active 129 DOM
-
2026-06-07days on market $195,000 Active 128 DOM
-
2026-06-05days on market $195,000 Active 125 DOM
-
2026-06-03days on market $195,000 Active 124 DOM
-
2026-06-02days on market $195,000 Active 123 DOM
-
2026-06-01days on market $195,000 Active 122 DOM
-
2026-05-31days on market $195,000 Active 121 DOM
-
2026-05-30days on market $195,000 Active 120 DOM
-
2026-04-21price $195,000
-
2026-03-10price $199,000
-
2026-03-04price $212,000
-
2026-01-30$215,000 Active
-
2016-08-30soldstatus $72,500
-
2013-12-17soldstatus $65,000
ⓘ Source: listings_history table (triggers on properties + properties_extension) + one-shot
backfill from property_details.listing_events for pre-trigger history.
Tax reassessment forecast TN · Resets to sale price
- Current annual tax
- $808 · $67/mo
- Projected year-2 tax
- $1,384 · $115/mo
- Expected delta
- +$577/yr (+$48/mo · 71.4%)
ⓘ Screening estimate from a state-policy table — verify with the county assessor before closing.
Climate risk First Street
- Flood 1/10 Low FEMA zone X (unshaded) · 0% chance over 30 yrs
- Wildfire 3/10 Moderate
- Heat 5/10 Major 7 d/yr ≥101°F today · 22 d/yr by 30 yrs out
- Wind 2/10 Low
- Air quality 1/10 Low 0 unhealthy d/yr today · 0 by 30 yrs out
Nearby sold comps map
Loading sold comps map…
Walkable amenities ~0.75 mi
Loading nearby amenities…
Taxation est. · year 1
- Rental income
- $20,733
- − Mortgage interest
- −$10,923
- − Property taxes
- −$808
- − Insurance
- −$975
- − Repairs & maintenance
- −$1,659
- − Management
- −$1,659
- − Depreciation
- −$5,673
- Taxable loss
- −$963
- Est. tax savings @ 24.0%
- +$231
- After-tax cash flow
- $2,556/yr
For passive investors: Depreciation is non-cash, so a rental often shows a tax loss while cash-flowing — sheltering income. Rental losses are passive: they offset passive income freely, and up to $25,000/yr can offset ordinary (W-2) income if you actively participate and your MAGI is under $100k (phasing out to $0 by $150k); unused losses carry forward. On sale, claimed depreciation is recaptured at up to 25%, and gains may owe capital-gains tax (a 1031 exchange can defer both). Figures are a year-1 estimate at your 24.0% rate — not tax advice; consult a CPA.
Schools (NCES district)
- District
- Kingsport
- NCES district ID
- 4702190
- Math proficiency
- 35% ▼ -12.00%
- Reading proficiency
- 38% ▼ -5.00%
- Median HH income
- $38,017
- Composite
- 30.44/100
- National rank
- #6233
- State rank
- #26 of 139 in TN
Livability — Kingsport
- Score
- 71/100
- State rank
- #39
- US rank
- #6587
Category grades
Schools grade is shown separately in the Schools card above.
Census & demographics
- Census place
- Kingsport, TN
- County
- Sullivan County · 121,987 people
- City population
- 83,493
- Metro
- Kingsport-Bristol, TN-VA
- Population (ZIP)
- 40,996
- Household income
- $49,191
- Rent vs Own
- Severe rent burden
- 1384.0
Population outlook (Sullivan County) Hauer SSP2
- Today (2025)
- 157,030 people
- By 2030
- 156,415 · -0.4%
- By 2040
- 153,778 · -2.1%
- By 2050
- 149,018 · -5.1%
- By 2075
- 138,068 · -12.1%
- By 2100
- 119,927 · -23.6%
Race, ethnicity, and origin ACS 2023
- Neighborhood character
- Predominantly White (88%)
- Race & ethnicity
- White 88% Two or more races 4% Black 4% Hispanic / Latino 3%
- Common ancestry
- Serbian 3% Slovak 3% Italian 1%
- Foreign-born
- 2% · Canada
- Languages at home
- 98% English-only · Spanish 2%
Political lean MEDSL · Sullivan
- 2024 margin
- Solid R (+55.0) · D 22.0% · R 77.0% · Other 1.0%
- 2008→2024 swing
- -13.6pp toward R · 2008: -41.3pp · 2024: -55.0pp
- All cycles
- 2024: R+55.0 2020: R+51.9 2016: R+56.2 2012: R+47.2 2008: R+41.3
Not yet ingested
- Civics
- —
Market trends
- HPI YoY
- ▼ -80.93%
- Current HPI
- 252.9821
- Rent YoY
- ▲ 7.95%
- Metro
- Kingsport-Bristol, TN-VA
- State GDP YoY
- ▲ 2.78%
- F500 in state
- 22
Industry mix (Fortune 500 HQ in TN)
| Industry | F500 HQs | Revenue |
|---|---|---|
| Healthcare | 3 | $91B |
|
||
| Retail | 3 | $72B |
|
||
| Transportation / Logistics | 1 | $88B |
|
||
| Paper / Packaging | 1 | $19B |
|
||
| Insurance | 1 | $13B |
|
||
| Energy | 1 | $12B |
|
||
Price history
+200.0% since first listed6 events — show timeline
- 2026-04-21 Price Changed $195,000 TVRMLS
- 2026-03-10 Price Changed $199,000 TVRMLS
- 2026-03-04 Price Changed $212,000 TVRMLS
- 2026-01-30 Listed $215,000 TVRMLS
- 2016-08-30 Sold (Public Records) $72,500 Public Records
- 2013-12-17 Sold (Public Records) $65,000 Public Records
Property tax history
+0.1%/yrLatest (2025): $808 · -8.6% YoY. Source: county tax records.
Cash-flow waterfall
monthlySold comps — $/sqft
last 12 mo · ≤1 miLoading sold comps…